Categories
In the realm of data mastery, one tool stands tall, confidently paving the way for businesses to decipher consumer preferences and behaviors: the “Google Consumer Survey”.


You know it’s critical to success to improve customer satisfaction and the experiences you offer. To achieve this, you need to actively listen to your target audience. They’ll happily tell you everything they want and don’t want from your business! Their feedback influences positive changes to your business that help it grow.
The key is having the proper tools to acquire and use this feedback constructively and consistently. Remember, audience perceptions are always changing. You don’t just need consumer surveys to learn how your audience feels today, but also tomorrow.
Google consumer surveys are an excellent solution. They simplify making consumer surveys online. This saves you time and encourages an open dialogue between you and your customers.
With Google Forms, the free online form creator, you can make, send, and analyze customer feedback surveys in minutes. The tool is easy to use and you can ask all types of consumer survey questions.
There are even Google consumer survey templates to get you started even faster!
You don’t want to ignore what your audience thinks and feels. Consumer experience surveys and satisfaction questionnaires provide the necessary intel to improve key strategies.
Worse yet, neglecting their sentiments can create a negative impression. Without frequent customer experience surveys, your audience may get the impression that you aren’t invested in their satisfaction.
Start talking to your customers through consumer feedback surveys.
This discussion will look at the Google consumer survey creator. We’ll look at how you can use these online customer satisfaction surveys to better know your audience.
Definition: A Google consumer survey is a tool for gathering and analyzing audience feedback. The actual name of the tool is Google Forms. It’s an online form creator for surveys, invitations, scheduling forms, timesheets, and more.
The Google Forms survey maker is free, requiring only a Google account to use (also free). Thus, it saves you both time and money! That’s always a winning combination.
While many of the Google Forms templates are useful, the most crucial consumer survey examples are the Customer Feedback and Event Feedback forms. They ask direct questions about the audience.
You’ll use responses from the audience to improve your strategies and experiences.
You can always customize what questions you ask and how you ask them. Google Forms allows you to use multiple-choice responses, rating scales, short-answer replies, and more. They even have multiple options for how to send your customer feedback survey to audiences.
Since surveys happen digitally, all the results are tabulated immediately. You don’t have to sit and tally results by hand. This means you can see their responses as soon as someone completes your consumer survey online.
All the data is available instantly within Google Forms. You can even export results from your survey ideas for further analysis and charting.
A Google consumer survey is more than just a questionnaire. It is a streamlined process for gathering audience feedback.
While Google Forms makes creating consumer surveys incredibly easy, writing the questions themselves can still take some creativity and know-how.
Even the Google consumer survey templates the tool offers are only meant to be a starting point. You’ll want to add questions or create your questionnaires from scratch.
To help you, this section will look at Google consumer survey questions you can use in your feedback forms. Each of these Google consumer survey examples works toward a particular goal or objective.

This is a multiple-choice question that serves many valuable objectives. You can use it to segment responses into key categories.
In this consumer survey example, you’re categorizing the audience by preferred meal service. If you ask a follow-up question, such as “Rate the customer service,” you know when this service took place.
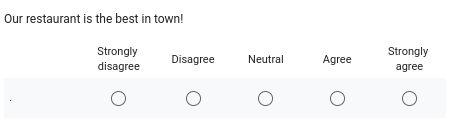
This type of rating survey question uses the Likert Scale Chart. It’s a system designed to remove subjectivity from ratings.
If you ask someone to rate your business on a scale of 1-10, there’s no clear indication of what each numerical value means. The Likert Scale clearly defines each part of the scale, giving you more clarity in your responses.

This is a great way to close any survey. The open-ended item allows the audience to share any thoughts not addressed in other questions. Many of the Google Forms templates end with this question.
Creating online consumer satisfaction surveys with Google sounds pretty good, right? How do you get started?
It’s very simple and all you need to get started making consumer surveys online is a Google account. If you don’t already have one (and there’s a high chance you do), it’s completely free. You can sign up on any Google page.
Once you’re signed in, access the Google Apps menu at the top of the page and choose Google Forms.

To begin making a Google consumer survey, you have the option to choose a prepared template or a blank form.
Many of the templates, like the consumer feedback survey, are useful for gaining audience insights. However, a blank form gives you the most control over your consumer survey. This will give you complete freedom in how you design your Google Forms for surveys.
You can easily incorporate some of the consumer survey questions from above. Just enter the title of your question into the appropriate field. Google Forms is smart enough to change the consumer survey questions based on your input.
For example, if you enter closed-ended questions and closed-ended responses into the fields.

Continue adding consumer survey questions to your form. Once you’re satisfied with the results, click the “Send” button at the top of the page. This will open the menu for sharing your consumer survey online.

As you can see, there are many options for sharing your Google consumer survey online. You can:
Google Forms free tool offers a basic overview of your response data. However, you may want to export the results of Google Forms to Google Sheets or Excel for deeper analysis.
Thankfully, the Google Forms free online survey tool makes it very easy to do this. Under the Responses tab, you can click the “Link to Sheets” link.

You’ll be able to create a new spreadsheet for the data or select an existing one.
For Excel users, the process is a little longer, but still very easy. Instead of clicking “Link to Sheets,” you’ll choose the three vertical dots next to it.

This creates a dropdown menu with the option to download your responses as a .csv file.

Choose the location on your device for the file download to go. Then, open up Excel, import the .csv file, and presto! Your Google Forms data is now in Excel!
Excel has a lot of helpful data analysis tools you can now use to explore your consumer survey results. The best tool of all is the ability to turn your consumer feedback survey results into charts.
Any time you have lots of data (like receiving thousands of consumer survey responses) it creates problems. There are so many numbers in your spreadsheet that it becomes impossible to understand.
The more data, the harder it is to understand. The sheer volume of information creates a paralyzing and fatiguing effect on the analyst.
Charts, diagrams, and dashboards offer a more approachable way to view the data. It’s easier to analyze visuals than walls of numbers. It’s tens of thousands of times easier, not to mention much faster.
Through charts, hidden insights rise straight to the surface. You can physically see the trends and emerging attitudes that demand further attention.
In a competitive consumer business world, timing is everything. Data visualizations enable you to respond quickly to your customer experience surveys and make impactful changes.
If you want to chart your Google consumer survey data in Excel, you need ChartExpo. This is an add-in for Excel that offers two primary benefits:
It’s unlike other data visualization tools because there are no scripts or other confusing settings to learn.
How to Install ChartExpo in Excel?
ChartExpo charts and graphs are available both in Google Sheets and Microsoft Excel. Please use the following CTA’s to install the tool of your choice and create beautiful visualizations in a few clicks in your favorite tool.


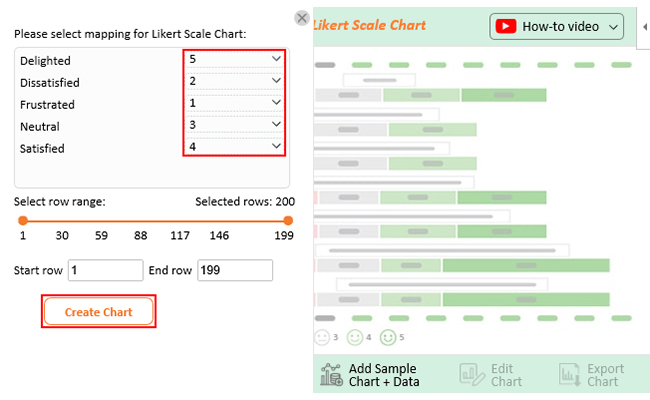
Let’s say you want to do a customer satisfaction survey. First, let’s have a look at the questions which you have asked consumers:
Below are the responses (feedback) that are associated with each question:
Finally prepared the data table as shown below:
| Responses | How satisfied are you with the reliability of the product? | How satisfied are you with the price of the product? | How satisfied are you with the customer service provided by the company? | How satisfied are you with packaging of the product? |
| Response 1 | Extremely Dissatisfied | Neutral | Extremely Satisfied | Satisfied |
| Response 2 | Satisfied | Dissatisfied | Extremely Satisfied | Satisfied |
The above table is just sample data. In actual scenarios, you will have a lot of responses and more questions as well.


Overall view, 62% of respondents are satisfied with the product and service. Out of 62, 28% had amazing experience with the product and service. 24% are dissatisfied with the product and service. 14% of customers said that they want to be neutral.


A consumer survey is where a business sends a feedback form to customers. It’s an attempt to receive intel on what consumers like and don’t like.
For example, online customer satisfaction surveys look at the items that make consumers happy or not. These questionnaires can help you highlight areas of your business that require improvement.
Similarly, a customer experience survey may reveal certain expectations that your audience has – some of these attitudes you may not be aware of!
No matter what the topic of your consumer survey is, the objective remains the same: find ways to improve your strategies and offerings. In turn, responding to audience feedback builds better relationships with your customers.
Thanks to Google Forms, Google’s consumer survey tool, it’s very easy to run any type of consumer survey online. The tool is completely free and the steps to begin gathering customer feedback are simple.
You fill out a blank form with consumer survey questions. Then, you can send the finished customer survey satisfaction form to others via a link or email. You can also make the link available on your social media platforms.
Suddenly, your Google consumer survey starts generating responses. You can see all the results in your Google Forms account under “Responses.”
Google Forms, the Google consumer survey maker is an impressive tool for generating audience feedback and insights.
Not only is it 100% free to use, but it also offers one of the easiest methods for creating online customer satisfaction surveys.
The tool is exceptionally intuitive. It will even anticipate what type of consumer survey question you’re asking and adjust your form accordingly!
Another advantage of Google Forms is creating online customer satisfaction surveys. In this digital format, the data is already there. You don’t have to manually hand-count the responses.
It also means your consumer surveys are easy to share with others, increasing how many responses you generate.
Google Forms becomes an even more valuable consumer survey solution when you pair it with other tools. For instance, you can export your customer survey satisfaction results to Excel for deeper analysis.
Then, you can visualize your results with ChartExpo’s data visualization add-in for Excel and Google Sheets.
Putting these tools together allows you to effortlessly build consumer surveys, track responses, analyze results, and chart findings.
The ChartExpo consumer survey charts are wonderful tools for reporting your findings to others. These data visualizations ensure you get every bit of value from your Google consumer surveys!
How much did you enjoy this article?


Google Forms to Google Sheets keeps your data organized and current with every submission. Learn the steps, methods, and tips now!

Product survey questions reveal what customers truly think. Learn how to ask the right ones and act on the survey results. Read on!

Learn how the 5-Point Performance Rating Scale improves employee evaluations with clear, consistent, and fair performance reviews across teams.


