Categories
Managing a commercial fleet without unified visibility is like flying blind. A Fleet Management Dashboard consolidates vehicle tracking, driver metrics, fuel consumption, and service records into one comprehensive interface.
It transforms scattered operational data into actionable intelligence that keeps fleets running smoothly and cost-effectively. This centralization reduces manual effort and improves response times across operations.
Organizations leverage these digital dashboards to spot inefficiencies, reduce downtime, and make better resource allocation decisions. Real-time data access eliminates guessing and enables managers to respond quickly when issues arise.
The dashboard becomes the central nervous system for fleet operations, connecting all moving parts and driving smarter choices.
Definition: A Fleet Management Dashboard is a visual analytics platform that centralizes vehicle, driver, and operational tracking in a single location. Raw fleet data gets converted into structured visualizations like charts, KPIs, and summary tables.
Fleet managers turn to dashboards to track vehicle whereabouts, evaluate driver conduct, and gauge operational effectiveness in real time. The interface surfaces patterns related to fuel usage, service intervals, and routing efficiency.
Complex information becomes digestible through clear visual formatting, supporting smarter decision-making, cutting operational expenses, and boosting fleet productivity, along with reliability.
It’s critical for sustaining control and transparency across expanding fleet operations. Organizations can shift from manual monitoring to data-powered fleet enhancement.
Key reasons include:
A properly designed Fleet Management Dashboard merges operational data with intuitive visual elements to produce actionable insights.
Key features include:
A unified digital dashboard keeps all fleet information accessible from one interface without toggling between tools.
Different operational needs demand different dashboard structures. Fleet dashboards can be organized by management tier and reporting goals.
Common types include:
Some companies match fleet reporting styles with wider analytics frameworks used in a marketing dashboard, guaranteeing uniform visualization standards.
Monitoring the right metrics guarantees that a Fleet Management Dashboard produces measurable value instead of surface-level reporting.
Important KPIs to monitor include:
These indicators help organizations link fleet performance with financial reporting structures often seen in an accounts dashboard.
Practical examples demonstrate how a Fleet Management Dashboard supports real-world decision-making.
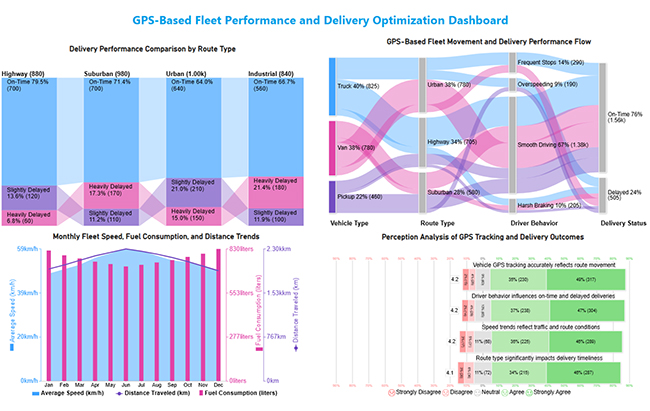
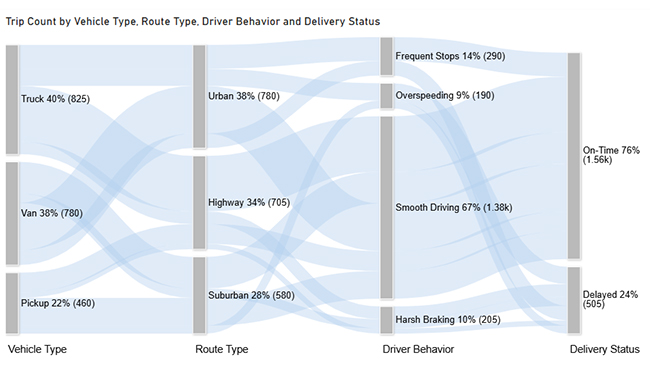
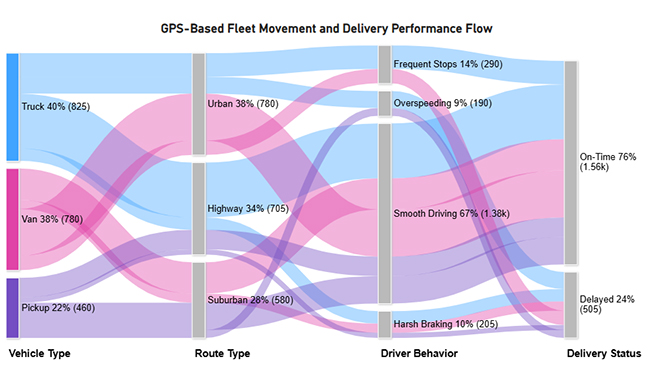
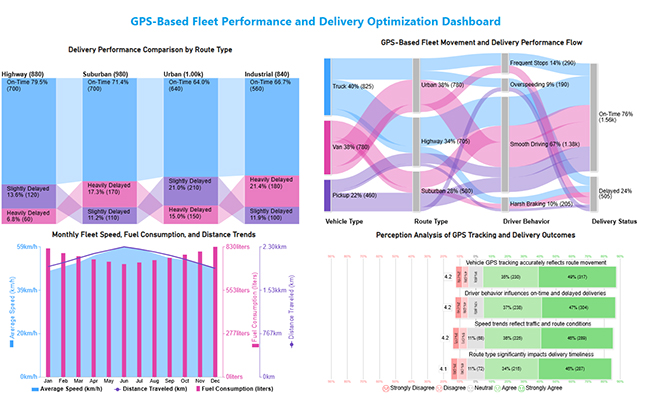
This dashboard provides a comprehensive view of GPS-based fleet operations by linking vehicle movement, route performance, driving behavior, and delivery outcomes to support data-driven fleet optimization.
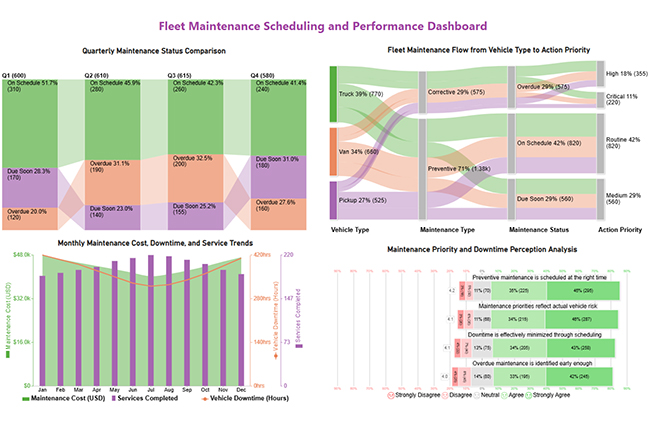
This dashboard summarizes fleet maintenance performance by combining scheduling status, downtime, costs, and feedback to support timely and prioritized maintenance decisions.
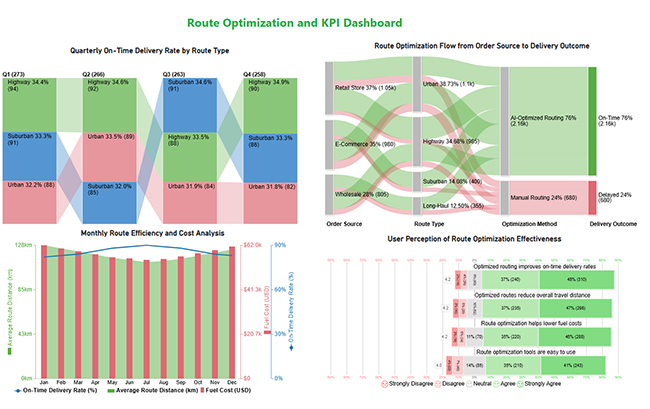
This dashboard highlights route optimization performance by tracking delivery reliability, cost efficiency, and key fleet KPIs in one view.
Many of these layouts align with visual patterns seen in business dashboards used across operations teams.
Building a reliable dashboard requires the right mix of tools, data sources, and visualization methods.
Common approaches include:
Fuel cost insights from fleet data often support analysis models used in a finance dashboard in Power BI.
Creating a Fleet Management Dashboard in Power BI involves structured data modeling and thoughtful visual design.
This structured workflow follows principles similar to guides that explain how to create a dashboard in Power BI.
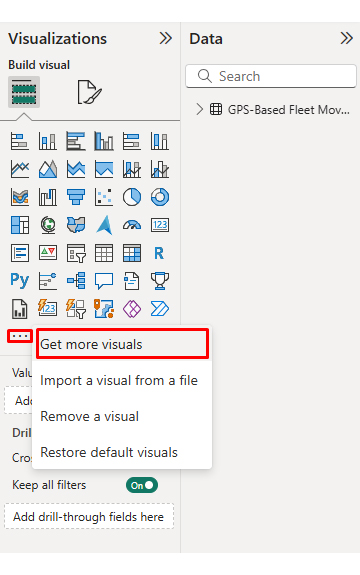
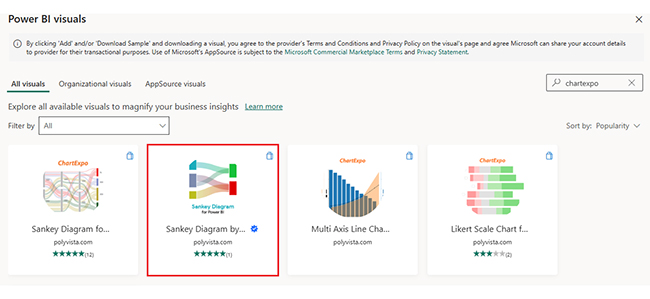
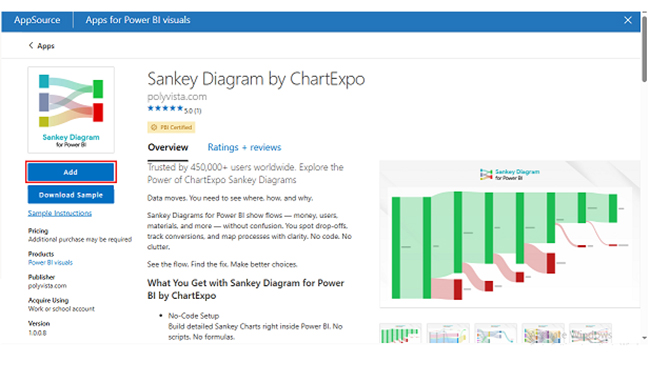
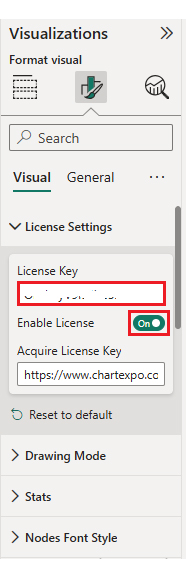
Why use ChartExpo?
Offers a 7-day free trial and costs $10/month.

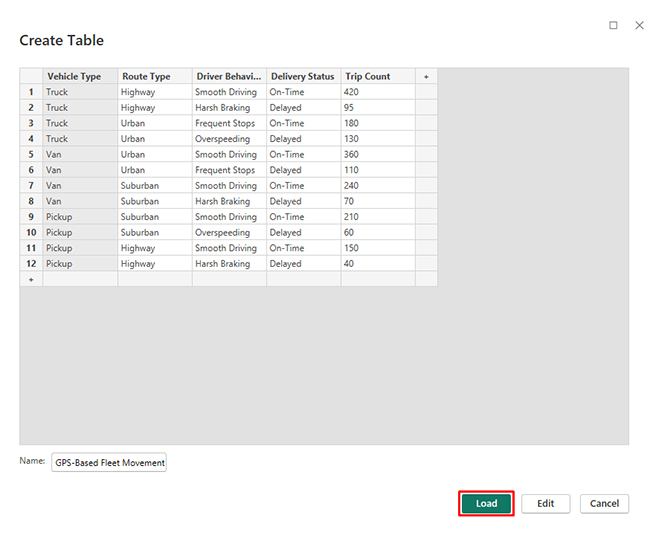
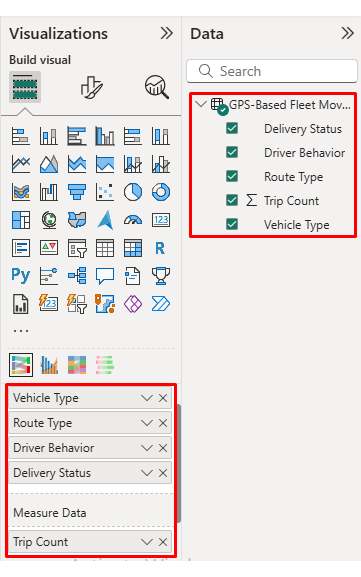
Now, consider we have the following data for a Sankey Chart.
| Vehicle Type | Route Type | Driver Behavior | Delivery Status | Trip Count |
| Truck | Highway | Smooth Driving | On-Time | 420 |
| Truck | Highway | Harsh Braking | Delayed | 95 |
| Truck | Urban | Frequent Stops | On-Time | 180 |
| Truck | Urban | Overspeeding | Delayed | 130 |
| Van | Urban | Smooth Driving | On-Time | 360 |
| Van | Urban | Frequent Stops | Delayed | 110 |
| Van | Suburban | Smooth Driving | On-Time | 240 |
| Van | Suburban | Harsh Braking | Delayed | 70 |
| Pickup | Suburban | Smooth Driving | On-Time | 210 |
| Pickup | Suburban | Overspeeding | Delayed | 60 |
| Pickup | Highway | Smooth Driving | On-Time | 150 |
| Pickup | Highway | Harsh Braking | Delayed | 40 |
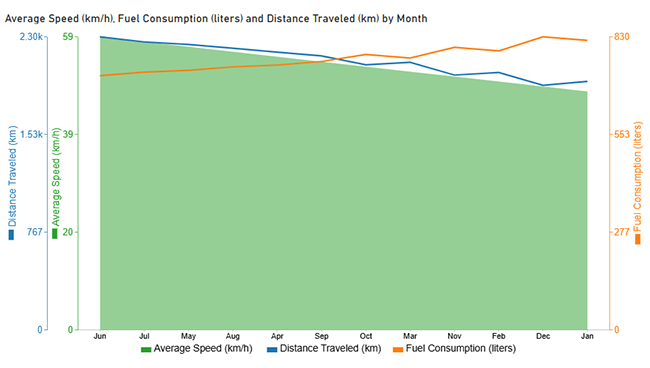
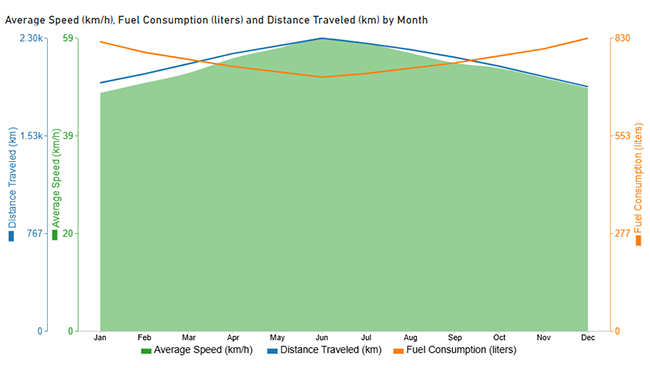
Now discuss the second chart. Consider we have the following data for a Multi-Axis Line Chart.
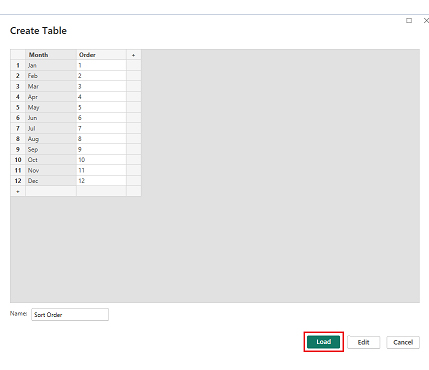
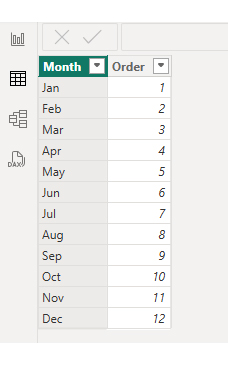
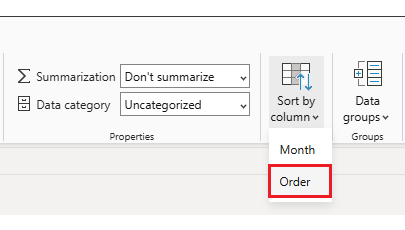
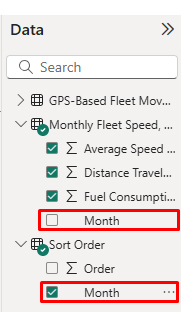
| Month | Average Speed (km/h) | Fuel Consumption (liters) | Distance Traveled (km) |
| Jan | 48 | 820 | 1,950 |
| Feb | 50 | 790 | 2,020 |
| Mar | 52 | 770 | 2,100 |
| Apr | 55 | 750 | 2,180 |
| May | 57 | 735 | 2,240 |
| Jun | 59 | 720 | 2,300 |
| Jul | 58 | 730 | 2,260 |
| Aug | 56 | 745 | 2,210 |
| Sep | 54 | 760 | 2,150 |
| Oct | 53 | 780 | 2,080 |
| Nov | 51 | 800 | 2,000 |
| Dec | 49 | 830 | 1,920 |
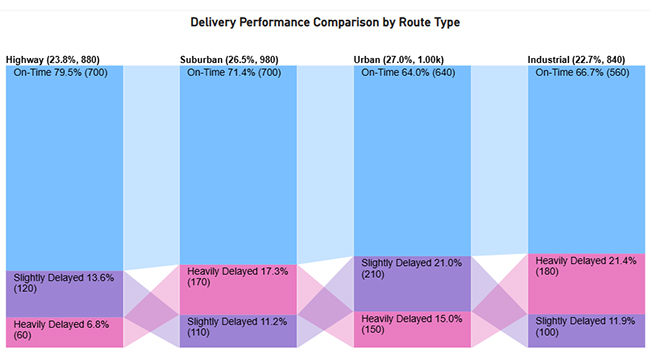
Now discus third chart. Consider we have the following data for a Comparison Bar Chart.
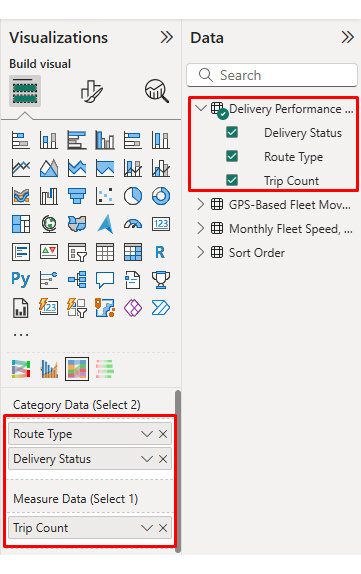
| Route Type | Delivery Status | Trip Count |
| Urban | On-Time | 640 |
| Urban | Slightly Delayed | 210 |
| Urban | Heavily Delayed | 150 |
| Suburban | On-Time | 700 |
| Suburban | Slightly Delayed | 110 |
| Suburban | Heavily Delayed | 170 |
| Highway | On-Time | 700 |
| Highway | Slightly Delayed | 120 |
| Highway | Heavily Delayed | 60 |
| Industrial | On-Time | 560 |
| Industrial | Slightly Delayed | 100 |
| Industrial | Heavily Delayed | 180 |
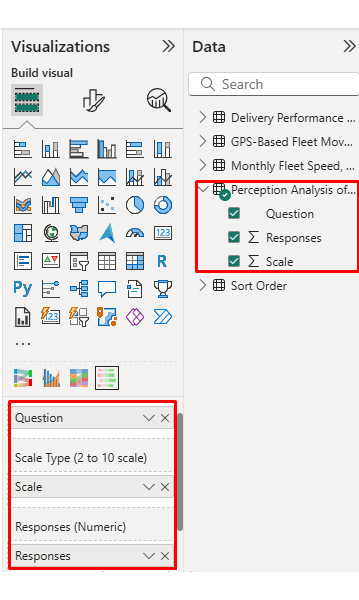
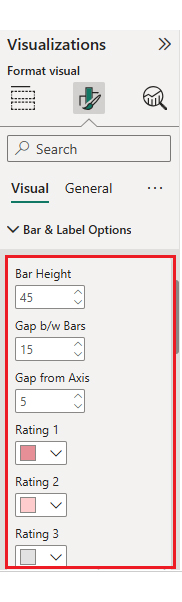
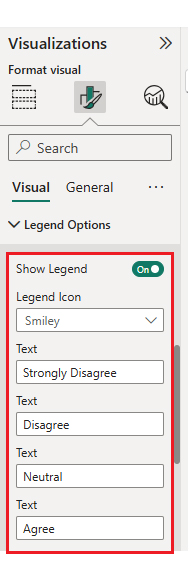
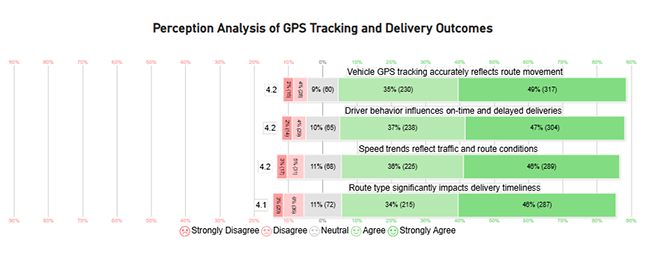
Now discuss the fourth chart. Consider we have the following data for a Likert Chart.
|
Question |
Scale |
Responses |
| Vehicle GPS tracking accurately reflects route movement | 1 | 15 |
| Vehicle GPS tracking accurately reflects route movement | 2 | 28 |
| Vehicle GPS tracking accurately reflects route movement | 3 | 60 |
| Vehicle GPS tracking accurately reflects route movement | 4 | 230 |
| Vehicle GPS tracking accurately reflects route movement | 5 | 317 |
| Route type significantly impacts delivery timeliness | 1 | 20 |
| Route type significantly impacts delivery timeliness | 2 | 36 |
| Route type significantly impacts delivery timeliness | 3 | 72 |
| Route type significantly impacts delivery timeliness | 4 | 215 |
| Route type significantly impacts delivery timeliness | 5 | 287 |
| Driver behavior influences on-time and delayed deliveries | 1 | 14 |
| Driver behavior influences on-time and delayed deliveries | 2 | 29 |
| Driver behavior influences on-time and delayed deliveries | 3 | 65 |
| Driver behavior influences on-time and delayed deliveries | 4 | 238 |
| Driver behavior influences on-time and delayed deliveries | 5 | 304 |
| Speed trends reflect traffic and route conditions | 1 | 17 |
| Speed trends reflect traffic and route conditions | 2 | 31 |
| Speed trends reflect traffic and route conditions | 3 | 68 |
| Speed trends reflect traffic and route conditions | 4 | 225 |
| Speed trends reflect traffic and route conditions | 5 | 289 |
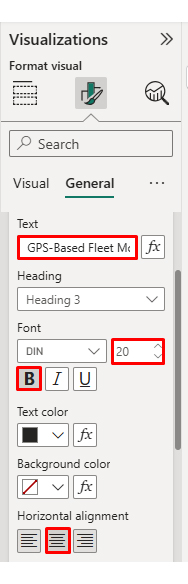
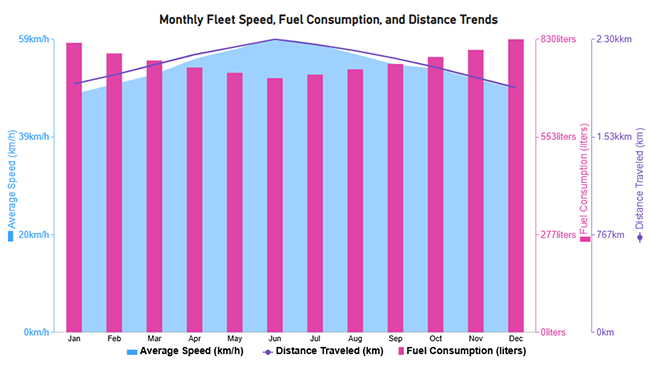
Arrange the charts efficiently and add interactivity to create a clear, engaging dashboard. After placement, the dashboard should appear as shown below.
It delivers both operational and strategic benefits by improving visibility and accountability.
Key benefits include:
These operational insights often complement service metrics tracked in a customer experience dashboard.
A Fleet Management System Dashboard should remain clear, relevant, and actionable as fleet operations evolve.
Best practices include:
Workforce efficiency metrics used alongside fleet data often reflect patterns found in the human resource dashboard. Performance comparisons across fleets can also be strengthened using a benchmarking dashboard.
Power BI, Tableau, and fleet management platforms are widely used. Tool selection depends on data complexity and integration needs.
It improves efficiency by identifying route delays, fuel waste, maintenance risks, and unsafe driving patterns early.
Common mistakes include tracking too many metrics, poor visual hierarchy, outdated data, and a lack of user-focused design.
A Fleet Management Dashboard empowers organizations to monitor performance, control costs, and improve operational efficiency through data-driven insights.
When built in Power BI and enhanced with advanced visuals from ChartExpo, fleet dashboards become more intuitive, insightful, and effective for smarter decision-making at every operational level. The combination delivers measurable business impact across your entire operation.
These dashboards don’t just track numbers passively. They turn raw fleet data into actionable strategies that protect budgets, reduce risks, and keep operations moving forward efficiently and profitably.
Fleet visibility translates directly into competitive advantage and bottom-line savings. Start building smarter, more effective dashboards today.
How much did you enjoy this article?


Calculate accounts receivable turnover ratio to measure credit collection speed, improve cash flow, and strengthen your financial strategy. Read on!

Change Management KPIs are the key to tracking adoption, performance, and ROI during transitions. Find out which metrics matter. Read on!

Data collection methods and techniques determine the quality of every insight you act on. Explore key approaches for gathering reliable data. Read on!


