Categories
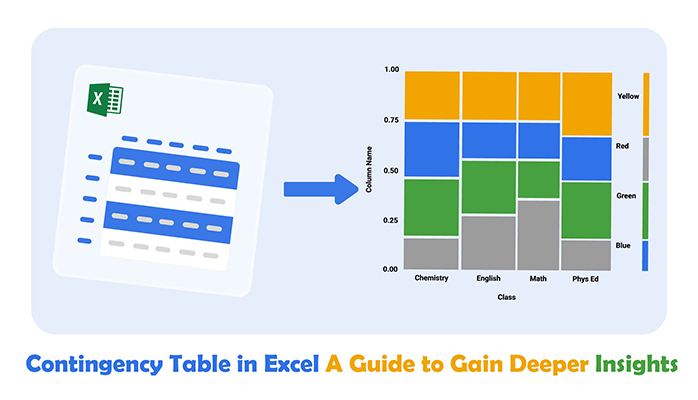
What is a contingency table in Excel? It is a powerful tool for identifying patterns and relationships in data. It helps organize and analyze data by showing how variables relate.
Imagine you’re tracking customer preferences for two different product features. A contingency table displays how often certain combinations occur, offering a straightforward approach to cross-tabulation in Excel.


Businesses rely on tools like this to make informed decisions. Excel makes creating a contingency table accessible for professionals across industries. Whether identifying trends in sales, analyzing survey results, or breaking down website traffic, the insights it provides are powerful. This is true when comparing tables vs. charts; tables provide detailed breakdowns, while charts offer overviews.
Excel’s functions allow you to create and customize a contingency table without specialized software. You can sort, filter, and visualize data with just a few clicks. It even simplifies data merging in Excel, combining datasets seamlessly to enhance your analysis.
Understanding how to use a contingency table in Excel isn’t only for data analysts. Teachers, marketers, and researchers can all benefit. For instance, educators use them to track student performance across subjects, while marketers evaluate customer preferences by demographics.
Data isn’t slowing down. The volume we generate daily is staggering—2.5 quintillion bytes. Making sense of it requires tools that are both simple and effective. That’s where a contingency table shines. It turns raw numbers into meaningful patterns, helping you make evidence-based decisions.
Excel brings this capability to your fingertips.
First…
Definition: A contingency table is a simple way to organize and analyze data. This table shows the relationship between two or more variables. Businesses, educators, and researchers use it to spot patterns and trends.
Excel makes creating tables quick and easy when paired with data consolidation in Excel. You can turn raw data into actionable insights with sorting, filtering, and visualization tools. Whether analyzing sales, surveys, or performance, a contingency table in Excel helps you make smarter decisions.
Are you feeling overwhelmed by data? Contingency tables can help. They simplify analysis and reveal trends. Plus, knowing how to change the chart style in Excel enhances your analysis for more precise insights. Here’s why they’re worth using:
Creating a contingency table in Excel is surprisingly easy. Follow these simple steps, and you’ll analyze patterns and relationships quickly. Want to visualize the results? Learn how to add charts in Excel to make your insights even clearer:
Your contingency table is ready—now what? Interpreting it is where the real magic happens. Whether you’re spotting trends, identifying relationships, or testing theories, here’s how to make sense of every detail:
Have you ever felt overwhelmed by data? Excel’s contingency tables can change that. They’re simple yet powerful tools for breaking down data into digestible pieces.
Here’s why they’re a must-have for your analysis toolkit;
Data analysis can feel like a puzzle. You’ve got the numbers, but are you making sense of them? That’s the hard part. Excel tries to help, but let’s face it—its visualizations can be limiting. Bland charts and static visuals often fail to tell the whole story.
ChartExpo transforms your Excel data into stunning, interactive visuals that speak volumes. With its intuitive interface, creating meaningful visuals becomes quick and effortless, including advanced visuals like a confidence interval graph in Excel for deeper statistical analysis.
Ready to take your analysis to the next level? ChartExpo helps you uncover insights that static graphs can’t. You’ll make better, faster decisions by combining Excel’s power with its advanced data visualizations.
Let’s learn how to install ChartExpo in Excel.
ChartExpo charts are available both in Google Sheets and Microsoft Excel. Please use the following CTAs to install the tool of your choice and create beautiful visualizations with a few clicks in your favorite tool.


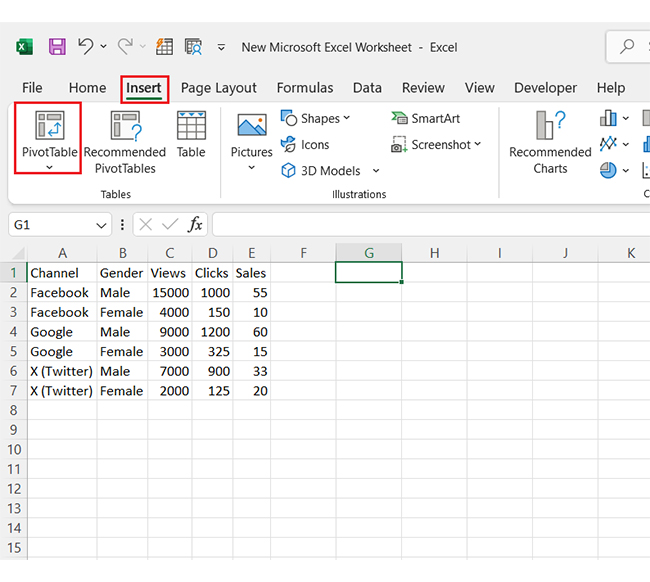
Let’s see how to visualize and analyze the contingency table sample data below in Excel using ChartExpo.
| Channel | Gender | Views | Clicks | Sales |
| Male | 15000 | 1000 | 55 | |
| Female | 4000 | 150 | 10 | |
| Male | 9000 | 1200 | 60 | |
| Female | 3000 | 325 | 15 | |
| X (Twitter) | Male | 7000 | 900 | 33 |
| X (Twitter) | Female | 2000 | 125 | 20 |


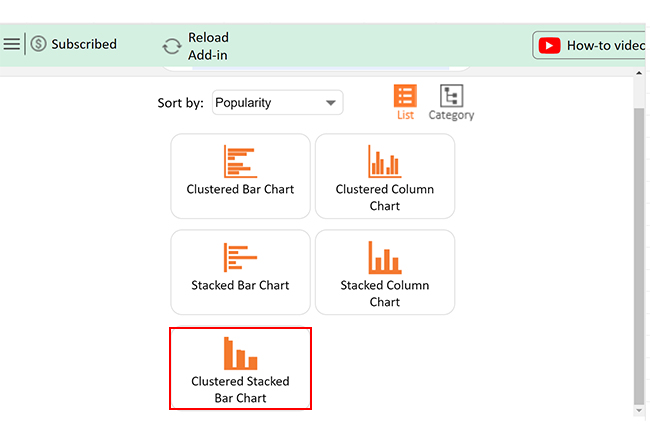
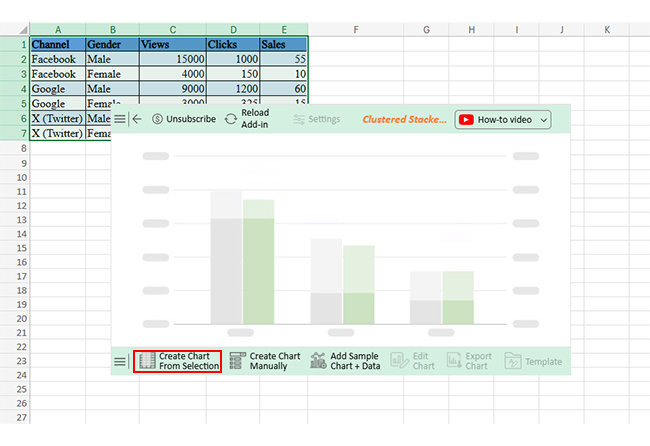
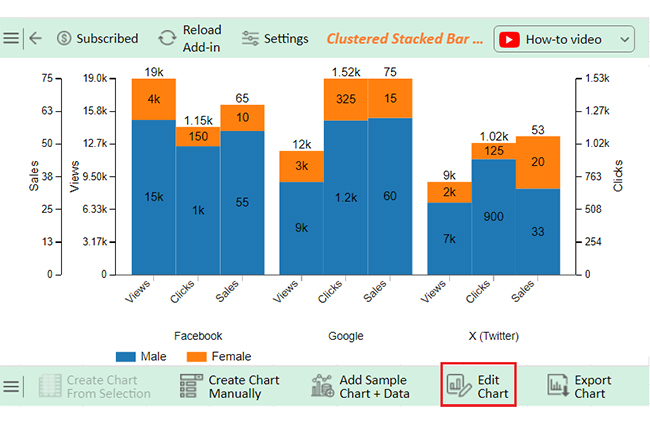
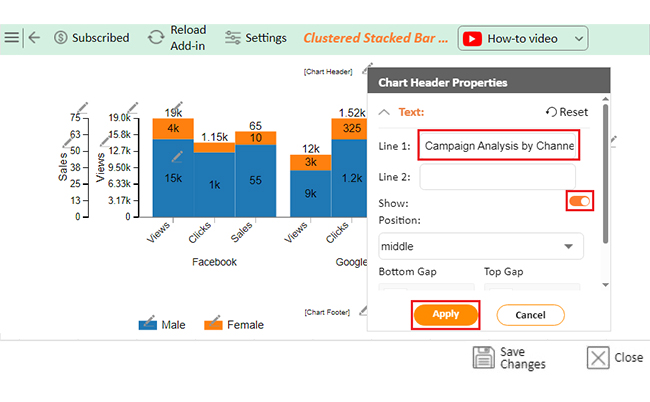
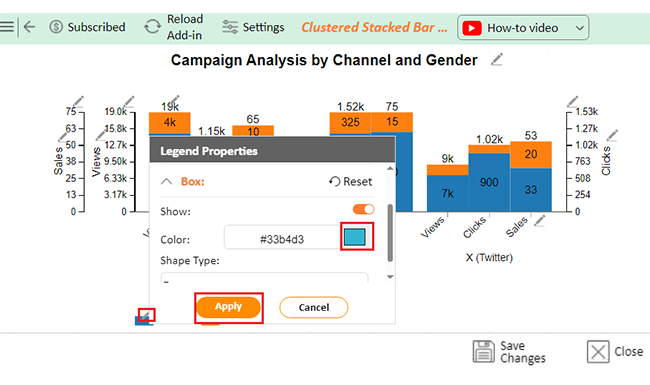
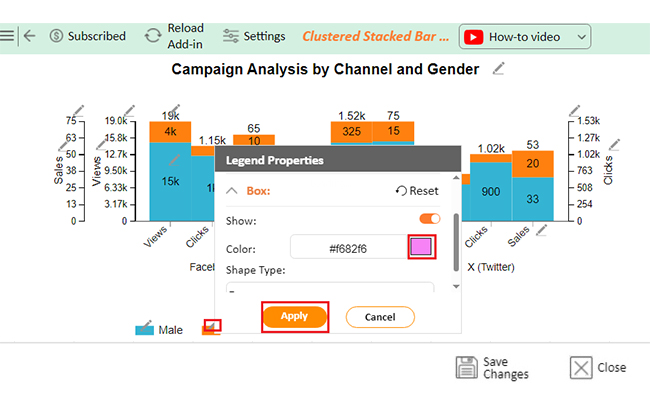
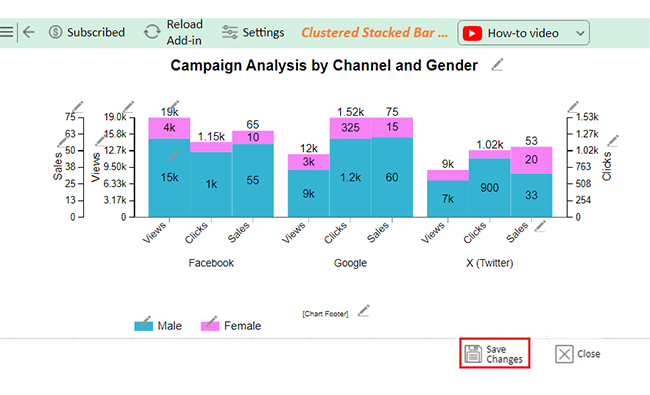
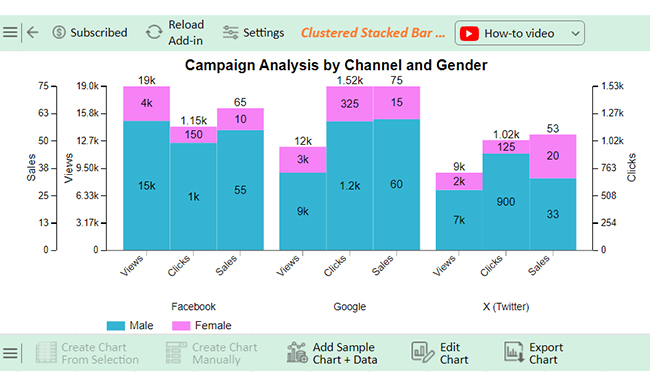


The following video will help you create a Clustered Stacked Bar Chart in Microsoft Excel.
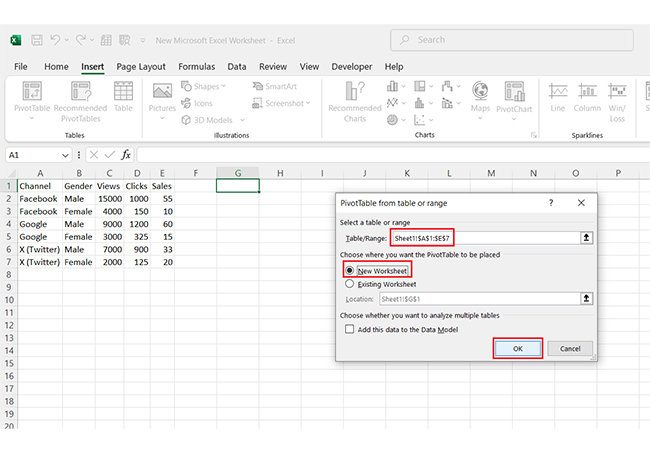
Yes, you can create a contingency table in Excel:
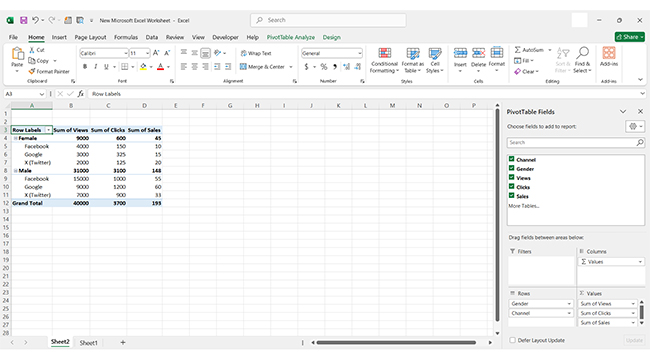
Excel calculates totals, giving you a clear contingency table.
A contingency table in Excel is a powerful tool for organizing and analyzing relationships between variables. Simplifying data turns complex numbers into clear patterns, speeding up and making decisions more accurate.
Excel makes creating contingency tables easy. Its pivot table feature lets you quickly sort, filter, and calculate data. Using a chart add-in for Excel can also enhance your visualizations, making patterns even clearer. Whether you’re analyzing sales, customer feedback, or survey results, Excel has the tools you need.
These versatile tables help research, marketing, education, and business. Their applications are wide-ranging, from tracking trends to testing hypotheses. Moreover, incorporating chart elements in Excel allows you to customize your tables for better presentation and understanding. Excel’s flexibility ensures your analysis fits your unique needs.
Contingency tables also facilitate collaboration. They provide transparent data formats that are easy to share. Teams can discuss insights and align decisions effectively, improving productivity and outcomes.
Analyzing and interpreting data doesn’t have to be overwhelming. A contingency table in Excel simplifies the process, bridging the gap between raw data and actionable insights.
Mastering this tool gives you a competitive edge. You’ll uncover patterns and make more intelligent choices.
With Excel, turning data into valuable information is just a few clicks away. Install ChartExpo to visualize your data easily and take your analysis to the next level.
How much did you enjoy this article?


Learn how to use sparklines in Excel to quickly visualize trends inside cells. Discover types, creation steps, customization, use cases, benefits, and best practices.

Learn what a confidence interval graph is, how to create it in Excel, and how to interpret results to make more reliable, data-driven decisions.

A correlation matrix in Excel helps identify relationships between variables. Learn how to create, read, and use it for effective data analysis.


