Categories
By ChartExpo Content Team
Excel plugins, commonly known as add-ins, serve as essential tools that significantly enhance the functionality, productivity, and efficiency of Microsoft Excel.
Seamlessly integrating into the Excel environment, these productivity tools, Whether developed by Microsoft or third-party developers, offer a diverse range of features to cater to various user needs.


The flexibility inherent in these plugins empowers users to personalize their Excel experience. Whether one requires advanced data visualization, robust data processing, or enhanced reporting capabilities, there exists an add-in to meet specific demands.
With the add-ins successfully incorporated, you’ll notice additional options or dedicated tabs within Excel’s interface. These new features help to enhance your workflow, perform complex tasks, and gain deeper insights from your data.
Should the need arise, managing or removing add-ins is a straightforward process. Succeed offers the
adaptability to empower, cripple, or uninstall these devices per your advancing requirements.
Don’t let your Excel spreadsheets be dull and lifeless. Take cues from me and add some fervor with add-
ins and watch your efficiency take off.
Definition: Excel plugins are essentially software utilities. They function as extensions that augment the native capabilities of Microsoft Excel. These tools, ranging from simple task automation to sophisticated data analysis, provide a pathway to more advanced functions and analyses than what Excel alone can offer.
Distinguishing between Excel’s built-in features and those introduced by external add-ins is crucial. While Excel’s native features are comprehensive, add-ins extend customization and capability beyond the standard Excel toolbox.
Microsoft Excel customization through plugins comes in various types, each serving distinct purposes. Third-party add-ins, developed externally, cater to specialized tasks. For example, if you want to make your financial analysis more attractive, you can utilize a Stacked waterfall chart. These add-ins offer features not available in standard Excel, enhancing the tool’s functionality to meet specific needs.
Web add-ins, utilizing HTML and JavaScript, provide cross-platform compatibility and modern Excel functionalities, ideal for users working across different operating systems or seeking cloud-based solutions.
Excel add-ins come in diverse forms, each designed to enhance specific facets of Excel’s functionality. Common COM Add-ins, developed using Visual Basic for Applications (VBA), enable extensive customization and task automation.
Microsoft’s built-in add-ins like Analysis ToolPak and Solver provide advanced analytical capabilities, such as statistical analysis and optimization modeling.
Third-party additions like ChartExpo enhance Excel’s data visualization, offering advanced chart types not available in stock Excel charts.
The adoption of Excel Plug-in significantly elevates Excel’s functionality by introducing advanced analytics and specialized calculations beyond the standard Excel version.
User-friendly Excel Plug-in seamlessly integrates into Excel, eliminating the need for advanced technical knowledge.
Beyond functional enhancements, Excel Plug-in transforms data handling, processing, and visualization, including Waterfall chart. They emerge as invaluable tools for individuals and businesses seeking to leverage Excel for more than basic spreadsheet tasks.
ChartExpo is an example of the best Excel add-ins. It showcases how an add-in can expand Excel’s charting capabilities beyond its default limitations. This user-friendly tool facilitates the creation of advanced charts like Sankey Diagrams, Radar Charts, and Sentiment Trend Charts with minimal effort.
The ease of use, extensive customization, and versatility make ChartExpo not just a data visualization tool but a means of effective data communication, accessible even to users with basic Excel skills.
Excel add-ins play a crucial role in enhancing Excel’s native capabilities, boosting productivity, and unlocking visualization potential. These tools enable users to perform specialized calculations and complex data analysis within the familiar Excel environment, reducing the time and effort required for data manipulation.
Moreover, add-ins offer capabilities beyond Excel’s default tools, particularly in data visualization. ChartExpo’s advanced chart types, such as Sankey Diagrams, Tornado Charts, and Radar Charts, go beyond standard Excel, facilitating better understanding and decision-making through engaging visual representations.
Selecting the right Excel add-in involves balancing functionality, security, and cost considerations. Users must choose add-ins based on their specific needs and understand the security implications of installing third-party tools. Reputable add-ins ensure reliable integration with data while maintaining security.
Cost is a critical factor, and users must weigh the benefits against the expenses to ensure value for money. Considering these factors enables informed decision-making, ensuring that add-ins enhance Excel without compromising on security or budget.
Excel chart extensions transform data interaction, elevating basic charts into advanced data storytelling tools. Excel chart plugins empower users to create interactive, sophisticated visualizations crucial for comprehensive data analysis and data presentation.
Excel graph plugin facilitates more effective data communication, particularly in sectors where storytelling is vital, such as marketing, finance, and research.
Follow these steps to add add-ins to Excel:
Deciphering a tangled web of numbers is like reading a mystery novel in a foreign language. While Excel is a trusty sidekick, its charting prowess might leave you longing for more, especially when you’re aiming for the best funnel chart to visualize your data.
But fear not, there’s a superhero solution add-ins! Cue ChartExpo, the knight in shining armor for your data’s visual journey.
With ChartExpo, your data bursts into vibrant visuals, telling stories everyone can understand.
Let’s learn how to Install ChartExpo in Excel.
ChartExpo charts are available both in Google Sheets and Microsoft Excel. Please use the following CTAs to install the tool of your choice and create beautiful visualizations with a few clicks in your favorite tool.
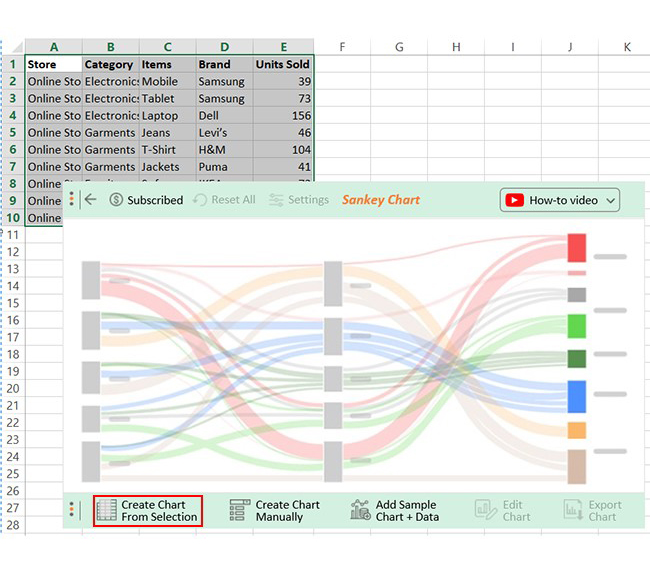
Let’s say you want to track the flow of sales order data below for a store.
| Store | Category | Items | Brand | Units Sold |
| Online Store | Electronics | Mobile | Samsung | 39 |
| Online Store | Electronics | Tablet | Samsung | 73 |
| Online Store | Electronics | Laptop | Dell | 156 |
| Online Store | Garments | Jeans | Levi’s | 46 |
| Online Store | Garments | T-Shirt | H&M | 104 |
| Online Store | Garments | Jackets | Puma | 41 |
| Online Store | Furniture | Sofa | IKEA | 73 |
| Online Store | furniture | Chair | Kartell | 46 |
| Online Store | furniture | Desk | Stickley | 43 |
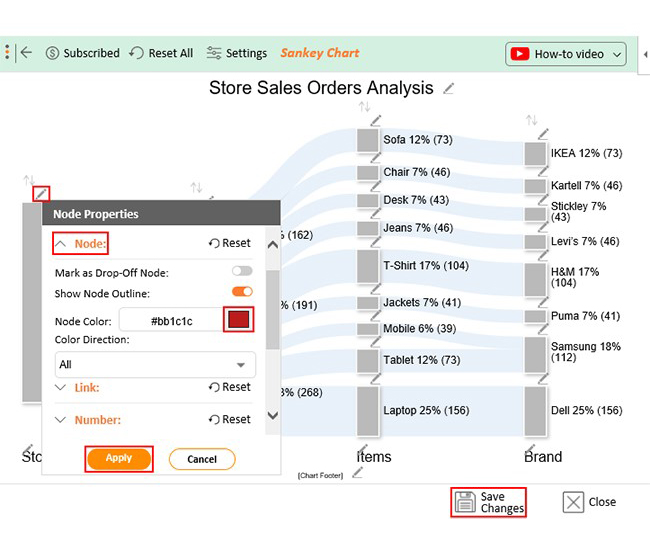
The Sankey Diagram is best suited since it displays flow data with precision and clarity. Follow the steps below to create a Sankey chart with ChartExpo.


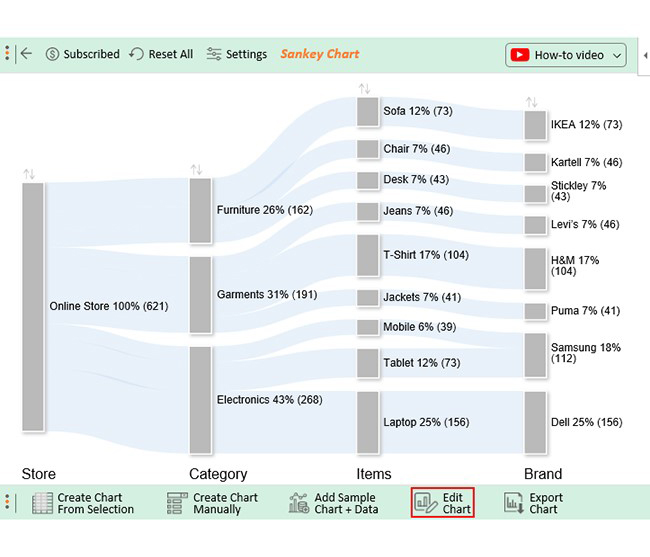
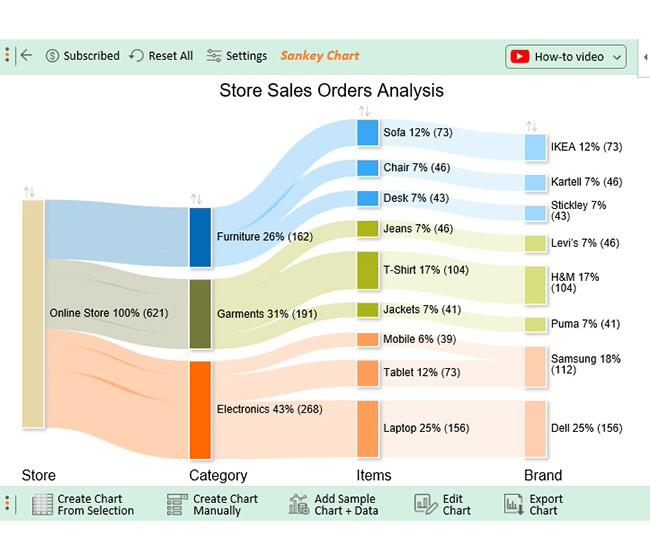
The online store provides a wide selection of products to accommodate varying customer preferences.
While Excel’s built-in charts serve basic data visualization needs, add-ins like ChartExpo offer a significant advantage for complex data sets and advanced visualization requirements.
ChartExpo provides a diverse array of chart types, such as Sankey Diagrams and clustered stacked bar charts, which are ideal for representing complex data relationships, highlighting the limitations of Excel’s built-in charts.
Excel add-ins like ChartExpo are designed to save time and effort, particularly when dealing with large datasets or complex analyses.
Streamlining various processes, from data entry to visualization, these data reporting tools reduce the need for manual data manipulation, fostering more efficient workflow management.
The integration of these add-ins speeds up the data analysis process significantly, providing efficiency benefits in professional settings where time is critical.
Excel add-ins are transformative tools that significantly enhance productivity by providing advanced functionalities within the familiar Excel environment. The streamlined approach to complex tasks, facilitated by add-ins, allows for more efficient task execution, leading to better time management and increased productivity.
Excel add-ins are tailor-made to solve specific business problems by offering customized solutions that extend Excel’s capabilities.
For instance, ChartExpo can be used to visualize sales trends, customer demographics, or financial forecasts, providing valuable insights for strategic decision-making. The seamless integration with Excel allows businesses to leverage existing data and infrastructure efficiently.
Using add-ins in Excel brings a multitude of benefits that significantly enhance your spreadsheet experience:
Add-ins introduce new functions and features to Excel, expanding its capabilities beyond the built-in tools. This engages you to perform complex estimations, data analysis, and particular assignments consistently.
Add-ins streamline workflows by automating repetitive tasks. They can speed up data manipulation, analysis, and reporting, saving time and effort.
Add-ins let you tailor Excel to suit your needs. You can customize functions, shortcuts, and interfaces to align with your workflow, making your Excel environment more user-friendly.
Many add-ins offer specialized tools for specific tasks, such as financial analysis, project management, or scientific calculations. This means you can access tools tailored to your industry or domain.
Some add-ins offer advanced data chart options. This allows you to create interactive charts, graphs, and dashboards that make it easier to understand complex data.
Collaborative add-ins facilitate real-time collaboration on Excel documents. They enable multiple users to simultaneously work on the same file, enhancing teamwork and productivity.
Add-ins can automate processes through macros sequences of predefined actions. This reduces the chances of errors and speeds up repetitive tasks.
Certain add-ins offer error-checking functionalities that help identify and rectify mistakes in your spreadsheets. This goes far to guarantee the exactness of your information and
computations.
Add-ins can simplify data import from various sources and export to different formats. This usefulness is convenient for overseeing information from various frameworks.
Trusted add-ins from reputable sources enhance the security of your data. They are less likely to contain malicious code and are safer than unknown macros or scripts.
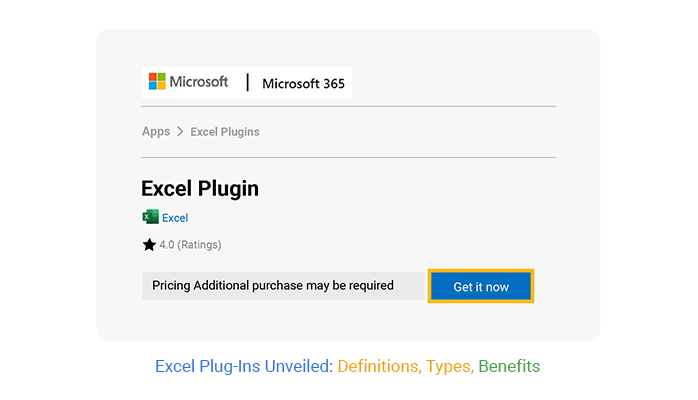
Excel plugins can be found in the Office Add-ins store, accessible through the ‘Insert’ tab in Excel.
Some Excel add-ins are free, while others, like ChartExpo, require a subscription.
After installation, most plugins can be accessed from the Excel ribbon, where they appear as new tabs or menu options.
In conclusion, Excel plugins act as transformative catalysts, turning a basic spreadsheet tool into a dynamic platform for advanced data handling and visualization.
Excel plugins provide substantial enhancements to Excel’s capabilities, offering advanced data visualization and analysis tools. These tools save time, enhance productivity, and solve specific business problems, making them indispensable for professionals across various sectors.
The “Insert” tab serves as your Launchpad, granting access to the realm of add-ins. With a few clicks, you can explore a variety of options, whether from Microsoft’s collection or third-party developers.
Though the integration process may involve granting permissions or additional installation steps, the outcome is soothing. Your tasks become streamlined, your data visualization becomes captivating, and your collaboration gains momentum.
However, the quest for the right add-in might come with considerations. Not all are free, and security should always be a priority.
As we conclude, ChartExpo isn’t just an add-in; it’s the key to unlocking new understanding through visualization. Your data deserves nothing less than the brilliance that ChartExpo provides.
How much did you enjoy this article?


Learn how to use sparklines in Excel to quickly visualize trends inside cells. Discover types, creation steps, customization, use cases, benefits, and best practices.

Learn what a confidence interval graph is, how to create it in Excel, and how to interpret results to make more reliable, data-driven decisions.

A correlation matrix in Excel helps identify relationships between variables. Learn how to create, read, and use it for effective data analysis.


