• Home
  • Tools dropdown img
    • Spreadsheet Charts

      • ChartExpo for Google Sheets
      • ChartExpo for Microsoft Excel
    • Power BI Charts

      • Power BI Custom Visuals by ChartExpo
    • Word Cloud

  • Charts dropdown img
    • Chart Category

      • Bar Charts
      • Circle Graphs
      • Column Charts
      • Combo Charts
      • Comparison Charts
      • Line Graphs
      • PPC Charts
      • Sentiment Analysis Charts
      • Survey Charts
    • Chart Type

      • Box and Whisker Plot
      • Clustered Bar Chart
      • Clustered Column Chart
      • Comparison Bar Chart
      • Control Chart
      • CSAT Survey Bar Chart
      • CSAT Survey Chart
      • Dot Plot Chart
      • Double Bar Graph
      • Funnel Chart
      • Gauge Chart
      • Likert Scale Chart
      • Matrix Chart
      • Multi Axis Line Chart
      • Overlapping Bar Chart
      • Pareto Chart
      • Radar Chart
      • Radial Bar Chart
      • Sankey Diagram
      • Scatter Plot Chart
      • Slope Chart
      • Sunburst Chart
      • Tornado Chart
      • Waterfall Chart
      • Word Cloud
    • Google Sheets
      Microsoft Excel
  • Services
  • Pricing
  • Contact us
  • Blog
  • Support dropdown img
      • Gallery
      • Videos
      • Contact us
      • FAQs
      • Resources
    • Please feel free to contact us

      atsupport@chartexpo.com

Categories
All Data Visualizations Data Analytics Surveys
Add-ons/
  • Google Sheets
  • Microsoft Excel
  • Power BI
All Data Visualizations Data Analytics Surveys
Add-ons
  • Google Sheets
  • Microsoft Excel
  • Power BI

We use cookies

This website uses cookies to provide better user experience and user's session management.
By continuing visiting this website you consent the use of these cookies.

Ok

ChartExpo Survey


Home > Blog > Data Analytics

Snowflake Data Schema: Definition, Structure, and Benefits

Structured data warehouses depend on thoughtful schema design to remain manageable as data volumes grow. The snowflake data schema addresses this by organizing dimension tables into normalized, layered hierarchies rather than wide, flat structures.

Snowflake Data Schema

This approach reduces duplication, enforces referential integrity, and allows analytical systems to expand without performance penalties as demand scales across the organization.

For Power BI analysts and data engineers, grasping this schema type leads to more precise models, richer hierarchies, and faster queries across large datasets. This guide covers what the schema is, the benefits it delivers, common real-world applications, and practical steps for applying it.

What is Snowflake Data Schema?

Definition: The snowflake data schema is a relational database design in which a central fact table connects to multiple dimension tables, and those dimension tables extend further into sub-dimension tables. This hierarchical branching gives the model its name, resembling the branching arms of a snowflake.

Where a star schema keeps dimensions in single, wide tables, the snowflake data schema normalizes each dimension into related layers, eliminating repeated values and enforcing consistency across the warehouse.

Because every level of the hierarchy lives in its own table, the design fits environments that prioritize data integrity and storage efficiency. It has become a standard pattern in large-scale analytical platforms where scalability and the model’s structural discipline matter most.

Why is Snowflake Data Schema Important?

Choosing the snowflake data schema delivers measurable value across several analytical priorities:

  • Lifts query efficiency in analytical workloads: Well-defined table relationships let queries execute faster within a Power BI data model.
  • Cuts data redundancy through normalization: Breaking dimension tables into smaller related units eliminates duplicate entries across the warehouse.
  • Scales reliably across growing data warehouses: The Snowflake data schema accommodates expanding datasets without degrading analytical performance.
  • Handles multi-level dimension hierarchies: Modelers can represent layered structures such as region, category, and product within a single schema.
  • Lowers overall storage overhead: Removing redundant values through normalization shrinks the storage footprint of the warehouse.
  • Strengthens data governance and integrity: Clearly defined relationships keep records aligned across connected systems, including Power BI data flows.
  • Makes dimension table maintenance simpler: Changes to a shared dimension value propagate cleanly without disrupting the full dataset.

Key Features of Snowflake Data Schema

The snowflake data schema structures data into normalized tables connected by well-defined relationships, making complex datasets manageable at scale. Core features include:

  • Normalized dimension tables: Dimension attributes are distributed across smaller related tables, reducing data duplication across the warehouse.
  • Fact table connected to multiple related dimensions: A central fact table anchors the model and references dimension tables that supply context for metrics, including values surfaced through a KPI visual in Power BI.
  • Hierarchical relationships between dimension tables: Dimensions branch into sub-dimensions representing levels such as region, country, and city for layered analytical navigation.
  • Reduced data duplication: Normalizing shared values into dedicated tables prevents redundancy and keeps data consistent across queries.
  • Structured star-like branching design: The schema radiates from the fact table through multiple normalized layers, forming its characteristic snowflake shape.
  • Optimized for OLAP queries: The architecture supports multidimensional analysis at scale, including workflows that leverage Power BI artificial intelligence for advanced insights.

Real-World Applications of the Snowflake Schema

Across industries, the snowflake data schema supports large-scale structured analysis where accuracy and consistent relationships matter. Common applications include:

  • Retail sales analytics: Product, store, and customer dimensions can be normalized into layered tables, enabling granular dashboards built on Power BI features.
  • Financial performance reporting: Revenue, expense, and time dimensions connect through normalized hierarchies to support detailed cost and profit analysis.
  • Healthcare data analysis: Patient records, treatment types, and department structures fit naturally into normalized dimension tables for regulatory and operational reporting.
  • Supply chain optimization: Inventory levels, supplier details, and logistics routes are modeled as separate normalized dimensions, improving traceability and demand forecasting.
  • Customer behavior analysis: Purchasing patterns and segmentation data can be analyzed more precisely when stored in normalized tables managed with Power BI incremental refresh for large volumes.

When to Use a Snowflake Schema?

Not every data environment benefits equally from a normalized approach. This model performs best where complex hierarchies, strict data governance, and long-term scalability are primary concerns.

Consider adopting this model in the following situations:

  • When dimension tables contain several levels of hierarchical data.
  • When eliminating data redundancy is a key architectural requirement.
  • When the project involves managing large, enterprise-grade data warehouses.
  • When consistent data across multiple reporting systems is a priority.
  • When storage optimization is a constraint in a large analytical database.

Environments that pull data from several source systems benefit especially from deliberate schema planning. Identifying the correct data source in Power BI early ensures that table relationships remain accurate and that analytical models produce trustworthy results across all connected reports.

How Snowflake Data Schema Works in Power BI?

Putting the snowflake data schema in Power BI to work requires loading tables in a way that preserves normalized relationships and supports hierarchical navigation. Once configured correctly, the model enables scalable, accurate analysis across complex datasets.

  • Import normalized tables into Power BI: Load each fact and dimension table separately to preserve the layered structure of the schema.
  • Define relationships between fact and dimension tables: Link tables so that metric fields in the fact table correctly correspond to descriptive attributes in each dimension.
  • Create hierarchy fields for drill-down: Map dimension levels into navigational hierarchies, such as category to subcategory to product, for deeper filtering.
  • Optimize model view for performance: Position tables and relationship lines clearly in the model canvas to make the structure easy to navigate and maintain.
  • Use DAX for aggregated measures: Build calculated fields for totals, running totals, and period-based calculations using time intelligence in Power BI.
  • Build visuals leveraging structured relationships: Draw on the connected model to create interactive, drill-capable reports that reflect the full hierarchy of the schema.

How to Analyze Snowflake Data Schema in Power BI?

Analyzing a Snowflake data schema in Power BI helps you understand complex relationships between fact and dimension tables while turning raw data into meaningful insights. Follow these steps to perform effective analysis:

Step 1: Connect Power BI to Your Data Source

Begin by connecting Power BI to your Snowflake database or importing your dataset. Ensure all fact and dimension tables are properly loaded for analysis.

Step 2: Understand the Snowflake Schema Structure

Review how your data is organized. A Snowflake schema consists of a central fact table connected to multiple normalized dimension tables. Understanding these relationships is key to accurate analysis.

Step 3: Build Relationships Between Tables

Use Power BI’s model view to create relationships between fact and dimension tables. Ensure keys are correctly mapped so data flows seamlessly across related tables.

Step 4: Create Measures and Calculations

Use DAX (Data Analysis Expressions) to create measures such as totals, averages, or growth rates. These calculations help you extract meaningful insights from your schema.

Step 5: Design Visualizations for Insights

Create visuals like bar charts, line charts, and dashboards to analyze trends and performance. For enhanced and advanced visual storytelling, you can also use ChartExpo to simplify complex data visualization.

Step 6: Analyze Trends and Patterns

Interpret your visuals to identify trends, compare performance across dimensions, and uncover hidden patterns within your data.

Step 7: Adding Final Visualization Dashboard Image

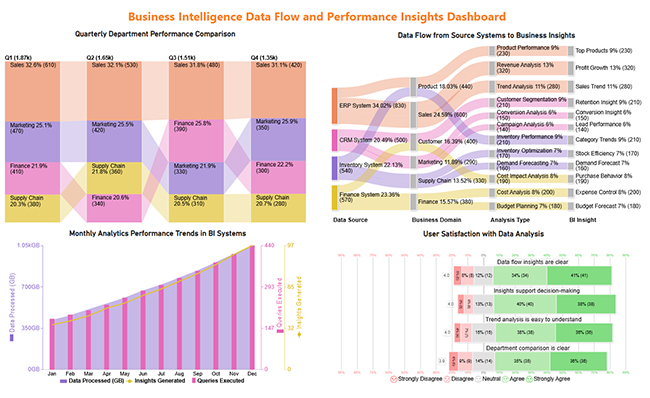
Include a final dashboard image that presents a comprehensive view of your analysis, such as performance trends, data flow insights, and comparisons across departments or metrics. This helps communicate complex Snowflake schema insights in a clear and visually engaging way.

Snowflake Data Schema

Key Insights

  • Sales and Product outcomes, including revenue, trend data, and performance measures, draw primarily from ERP, Finance, CRM, and Inventory systems.
  • Among business functions, Sales holds the leading share across all quarters at roughly 31 to 33 percent, with Marketing and Finance remaining stable and Supply Chain recording the lowest contribution.
  • Analytical activity increases each month, with data volumes, query counts, and generated insights all reaching their highest point in December.
  • Survey results reflect a broadly positive user experience, with respondents expressing strong agreement that dashboards are clear and that the data supports sound decisions.

Advantages and Disadvantages of Snowflake Data Schema

Applying the snowflake data schema brings structural advantages to complex warehousing environments, though certain trade-offs deserve consideration before adoption.

Pros

  • Lowers redundancy by normalizing shared values into dedicated dimension tables.
  • Strengthens data integrity and maintains consistent records across the warehouse.
  • Accommodates multi-level dimension hierarchies within a single schema.
  • Reduces storage requirements through the elimination of repeated data values.
  • Handles large analytical environments without sacrificing structural integrity.

Cons

  • Query construction is more involved than with a flatter star schema design.
  • Retrieving data typically requires joining several tables rather than a single one.
  • Performance on some queries may be slower due to the additional join complexity.
  • New analysts may find the layered table structure harder to navigate and understand.
  • Schema design and ongoing maintenance demand a higher level of data modeling knowledge.

Best Practices for Implementing Snowflake Data Schema

Getting the most from this design depends on consistent decisions and deliberate relationship management throughout the modeling process.

  • Clearly define fact and dimension tables: Establish which tables hold measurable events and which carry descriptive attributes before building the model.
  • Normalize only when necessary: Use normalization selectively to reduce redundancy without creating join complexity that outweighs the benefit.
  • Maintain consistent naming conventions: Apply standardized names to all tables and columns so the schema remains readable and manageable over time.
  • Optimize indexing strategies: Apply appropriate indexes to frequently joined columns to keep query response times acceptable across large tables.
  • Monitor query performance regularly: Track execution times and join costs periodically to catch inefficiencies before they affect reporting speed.
  • Document relationships and hierarchies: Record table connections and dimension levels so teams can navigate and maintain the model in Power BI workspaces.

FAQs

What is the difference between a database and a schema in Snowflake?

A database in Snowflake is a container that holds schemas, tables, views, and other objects. A schema sits within that database and defines how related tables and views are organized. In the context of the snowflake data schema, the schema layer is where the fact and dimension tables are arranged and connected.

What are the three types of tables in Snowflake?

Snowflake supports three main table types: permanent tables, which retain data indefinitely; transient tables, which have limited data retention and no fail-safe storage; and temporary tables, which exist only for the duration of a session. All three types can be used within this layered table structure.

Is Snowflake an OLAP or OLTP?

Snowflake is designed primarily for OLAP workloads, meaning it is optimized for complex analytical queries across large datasets rather than high-frequency transactional operations. This makes it a strong fit for the snowflake data schema, where layered dimensions and fact tables support reporting and business intelligence use cases.

Wrap Up

The snowflake data schema remains one of the most dependable approaches to organizing complex warehouse data. Its normalized structure controls redundancy, supports hierarchical dimensions, and scales effectively as analytical demands grow.

By separating dimensions into related layers rather than combining everything into wide tables, teams gain cleaner data, stronger governance, and a model built for long-term analytical performance.

Analysts who understand how to configure and query this schema in Power BI can deliver more accurate, drillable reports with less maintenance overhead. Whether the goal is financial reporting, retail analytics, or supply chain visibility, a well-implemented model creates a foundation built for long-term performance.

How much did you enjoy this article?

GSAd1
Start Free Trial!
160436

Related articles

next previous
Data Analytics9 min read

What are Data Products: Everything You Need to Know

What are data products? Discover how they turn raw data into business value through structured design, analytics, and smart governance. Read on!

Data Analytics8 min read

SaaS Dashboard: A Complete Walkthrough

Dashboard for SaaS shows revenue, churn, usage, and retention in one view. See metrics, examples, and build steps in Power BI. Read on!

Data Analytics7 min read

Employee Turnover Rate: Definition, Formula & Insights

Employee Turnover Rate shows where exits rise, how to measure change, and what numbers mean in Excel. See the formula, examples, and steps. Read on!

Data Analytics11 min read

Primary vs Secondary Research: Which Method Is Better?

Primary vs secondary research shapes data quality and analytical outcomes. Learn the key differences and when to use each method. Discover now!

Data Analytics12 min read

Staff Onboarding Template: Insights for HR Decisions

Staff onboarding template: discover how to build, track, and analyze a process that gets new hires productive from day one. Read on!

ChartExpo logo

Turn Data into Visual
Stories

CHARTEXPO

  • Home
  • Gallery
  • Videos
  • Services
  • Pricing
  • Contact us
  • FAQs
  • Privacy policy
  • Terms of Service
  • Sitemap

TOOLS

  • ChartExpo for Google Sheets
  • ChartExpo for Microsoft Excel
  • Power BI Custom Visuals by ChartExpo
  • Word Cloud

CATEGORIES

  • Bar Charts
  • Circle Graphs
  • Column Charts
  • Combo Charts
  • Comparison Charts
  • Line Graphs
  • PPC Charts
  • Sentiment Analysis Charts
  • Survey Charts

TOP CHARTS

  • Sankey Diagram
  • Likert Scale Chart
  • Comparison Bar Chart
  • Pareto Chart
  • Funnel Chart
  • Gauge Chart
  • Radar Chart
  • Radial Bar Chart
  • Sunburst Chart
  • see more
  • Scatter Plot Chart
  • CSAT Survey Bar Chart
  • CSAT Survey Chart
  • Dot Plot Chart
  • Double Bar Graph
  • Matrix Chart
  • Multi Axis Line Chart
  • Overlapping Bar Chart
  • Control Chart
  • Slope Chart
  • Clustered Bar Chart
  • Clustered Column Chart
  • Box and Whisker Plot
  • Tornado Chart
  • Waterfall Chart
  • Word Cloud
  • see less

RESOURCES

  • Blog
  • Resources
  • YouTube
SIGN UP FOR UPDATES

We wouldn't dream of spamming you or selling your info.

© 2026 ChartExpo, all rights reserved.