Categories
The Intelligence in Power BI helps users to analyze data over time. It offers powerful functions to calculate trends, compare periods, and make informed, time-based business decisions.


This guide dives deep into what Time Intelligence in Power BI is, why you should use it, and how the Power BI workspaces work.
You’ll discover how to perform predictive analytics in Power BI and how the Date Hierarchy in Power BI works. This guide explores how to connect the No of Days between two dates, calculate a function in Power BI, and use the Power BI ALLEXCEPT and Power BI calculated columns.
If you’re yet to figure out the Power BI field parameter, Datediff in Power BI, and Power BI automatic refresh, there are sections in this guide that explore all that.
Definition: Time Intelligence in Power BI is a set of DAX (Data Analysis Expressions) functions that give users the ability to perform calculations and analysis based on time-based data.
These functions help analyze trends, compare values across different time periods (like month-over-month or year-over-year), and aggregate data over specific intervals like days, months, quarters, and years.
Key features of Time Intelligence in Power BI include:
Time Intelligence functions in Power BI simply perform common calculations like Year-to-Date (YTD), Month-to-Date (MTD), and Quarter-to-Date (QTD). These built-in DAX functions reduce the complexity of writing time-related formulas and enable users to generate accurate results quickly and consistently.
Businesses use time-based measures to detect trends over days, months, or years. It helps stakeholders track performance, compare metrics across periods, and identify patterns (or anomalies) that may affect business operations.
Time Intelligence enables comparisons like “this month vs. last month” or “this year vs. previous year.” These insights help understand growth, forecast demand, and set realistic targets based on past performance.
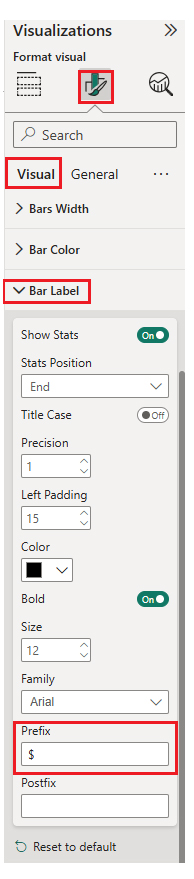
When paired with interactive slicers and visuals like a Sankey Chart, Time Intelligence functions create dynamic reports that adjust based on user-selected time frames. The interactivity of the Sankey Chart helps users explore data from multiple perspectives without building separate reports.
Many organizations operate on fiscal years instead of calendar years. Power BI supports custom data tables and gives users the room to tailor Time Intelligence calculations to match fiscal periods. This improves accuracy in financial analysis.
The Time Intelligence function in Power BI is a type of DAX (Data Analysis Expressions) function that enables users to perform time-based calculations and analysis.
These functions give you room to analyze data over different periods like days, months, quarters, or years and perform operations like period comparisons, cumulative totals, and date shifting.
Common Time Intelligence Functions are:
To calculate year-to-date sales, you’ll use:
Time Intelligence functions in Power BI play a major role in analyzing data and enable users to create dynamic reports. These reports track trends, compare periods (like month-over-month or year-over-year), and calculate cumulative totals.
These functions simplify complex date-based calculations and make it easy to gain insights from time-series data and drive informed, timely decisions.
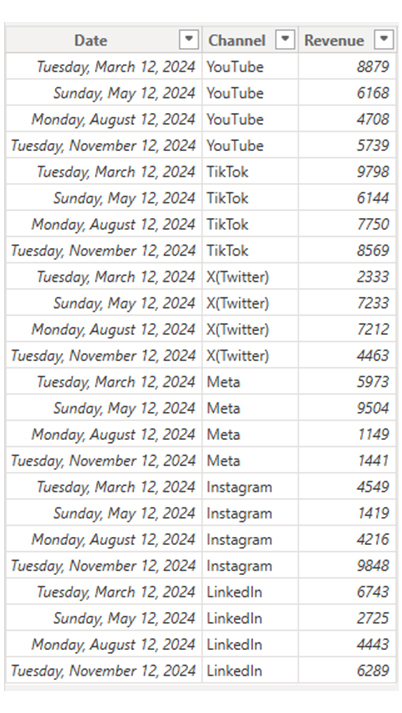
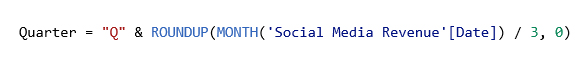
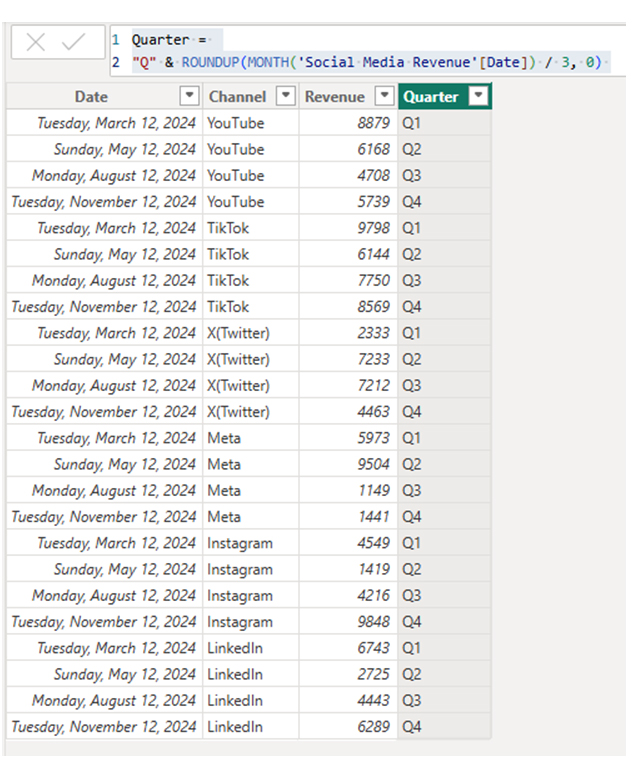
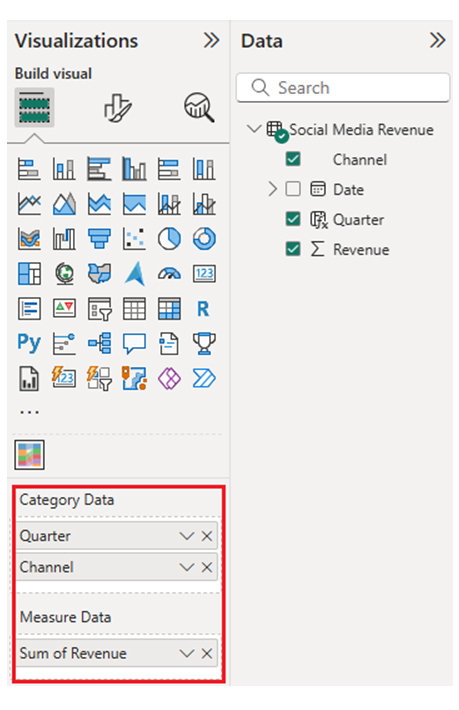
The data table below will be used to make the chart in Power BI. The first column shows the date with day, month, and year. You will add a new column that fills with quarters only, and that will make your chart with quarters data.
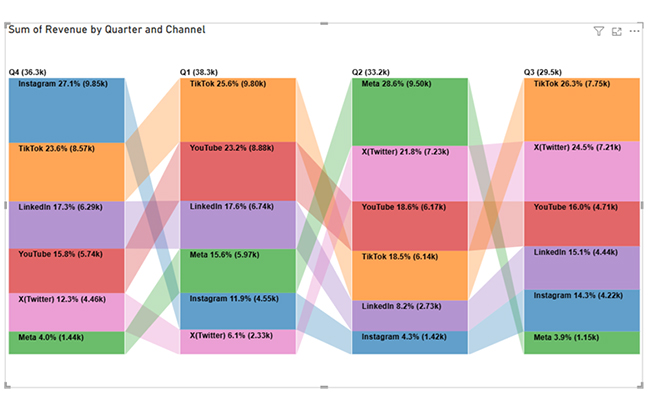
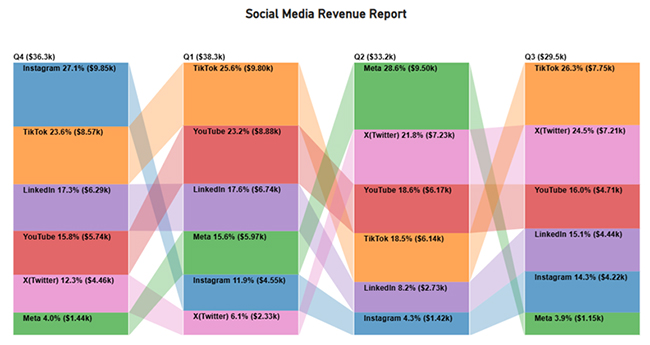
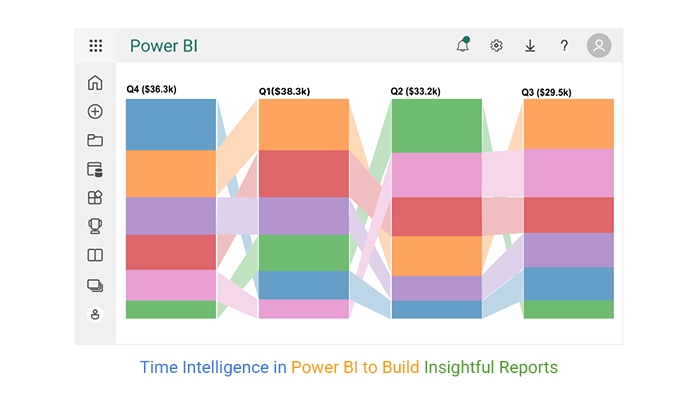
TikTok leads Q1 with peak revenue but declines in Q2 and recovers by Q4. Meta sees a sharp Q2 spike before plummeting.
Instagram rebounds with strong Q4 revenue. X (Twitter) peaks in Q2-Q3, while YouTube declines steadily. LinkedIn remains stable and ends with a Q4 boost.
Time Intelligence functions need a well-structured Date table. You have to create (or import) a calendar table that spans all the dates in the dataset. Include columns like Year, Month, Quarter, and Day. You have to mark it as a Date Table in Power BI.
After creating the date table, right-click on the “Model View” and choose “Mark as Date Table.” Select the Date column. This ascertains that Power BI recognizes it for Time Intelligence calculations.
For better performance and control, you’ll have to disable Power BI’s Auto Date/Time feature. To do that, navigate to File —> Options —> Data Load and unlock “Auto Date/Time for new files.”
Power BI provides ready-to-use Time Intelligence DAX functions like:
If your organization uses a fiscal year, adjust the calendar accordingly. Add Fiscal Year and Fiscal Quarter columns using DAX logic based on the fiscal start month.
Use slicers with fields like Year, Month, or Quarter from your Date table. This gives the user room to dynamically filter and compare data over time.
Always validate your Time Intelligence measures by testing them in visuals like bar charts, line charts, or metrics to ensure they return expected results.
To turn off Time Intelligence in Power BI, you have to ascertain that your date table is marked as a regular table, and not a Date table. Navigate to the Model View, right-click the table, and select “Unmark as Date Table.” You should also avoid using auto date/time by disabling it in Options > Data Load.
The Time Intelligence feature in Power BI is used to perform advanced time-based analysis, like comparing sales year-over-year. You can also use it to calculate YTD or QTD values and identify trends.
It simplifies complex date calculations and enables better insights, forecasting, and strategic decision-making based on historical and current time data.
To use real-time intelligence in Power BI, you’ll have to connect live data sources like Azure Stream Analytics or push data via the Power BI REST API.
You can use DirectQuery mode or streaming datasets to visualize live updates in dashboards. Real-time tiles auto-refresh enables immediate monitoring and fast, informed decision-making.
Time Intelligence in Power BI refers to DAX functions that enable analysis over time. This analysis could be YTD, MTD, and previous year comparisons.
It simplifies complex date calculations and supports trends and performance analysis. It provides clear insights from time-based data, which helps in decision-making.
To get the most out of Power BI Time Intelligence, you’ll have to use a proper date table, use the built-in DAX functions, and disable auto date/time.
Time Intelligence functions need a well-structured data table. You have to create (or import) a calendar table that spans all the dates in the dataset. There are ready-to-use Time Intelligence DAX functions that simplify complex time-based calculations.
To improve performance and control, disable Power BI’s Auto Date/Time feature.
Now you know the importance of Time Intelligence in Power BI, how will you incorporate it into your analytic process?
How much did you enjoy this article?


Discover diverse and high-quality Power BI report examples for inspiration and insights. Elevate your reporting with strategic visualization techniques.

A Customer Relationship Management Dashboard centralizes data, tracks key metrics, and drives smarter business decisions. Discover now!

Explore Healthcare Dashboard Examples and learn how to turn complex healthcare data into clear, actionable insights for better decision-making.


