• Home
  • Tools dropdown img
    • Spreadsheet Charts

      • ChartExpo for Google Sheets
      • ChartExpo for Microsoft Excel
    • Power BI Charts

      • Power BI Custom Visuals by ChartExpo
    • Word Cloud

  • Charts dropdown img
    • Chart Category

      • Bar Charts
      • Circle Graphs
      • Column Charts
      • Combo Charts
      • Comparison Charts
      • Line Graphs
      • PPC Charts
      • Sentiment Analysis Charts
      • Survey Charts
    • Chart Type

      • Box and Whisker Plot
      • Clustered Bar Chart
      • Clustered Column Chart
      • Comparison Bar Chart
      • Control Chart
      • CSAT Survey Bar Chart
      • CSAT Survey Chart
      • Dot Plot Chart
      • Double Bar Graph
      • Funnel Chart
      • Gauge Chart
      • Likert Scale Chart
      • Matrix Chart
      • Multi Axis Line Chart
      • Overlapping Bar Chart
      • Pareto Chart
      • Radar Chart
      • Radial Bar Chart
      • Sankey Diagram
      • Scatter Plot Chart
      • Slope Chart
      • Sunburst Chart
      • Tornado Chart
      • Waterfall Chart
      • Word Cloud
    • Google Sheets
      Microsoft Excel
  • Services
  • Pricing
  • Contact us
  • Blog
  • Support dropdown img
      • Gallery
      • Videos
      • Contact us
      • FAQs
      • Resources
    • Please feel free to contact us

      atsupport@chartexpo.com

Categories
All Data Visualizations Data Analytics Surveys
Add-ons/
  • Google Sheets
  • Microsoft Excel
  • Power BI
All Data Visualizations Data Analytics Surveys
Add-ons
  • Google Sheets
  • Microsoft Excel
  • Power BI

We use cookies

This website uses cookies to provide better user experience and user's session management.
By continuing visiting this website you consent the use of these cookies.

Ok

ChartExpo Survey


Home > Blog > Power BI

Date Table for Power BI: Steps to Unlock Hidden Insights

Most analysis in Power BI relies on time. Whether you’re tracking sales trends, measuring seasonal performance, or planning, your data needs a reliable date foundation. That’s where a Date Table for Power BI comes in.

Date Table for Power BI

A Power BI date table centralizes time logic so every chart and calculation uses the same date structure.

Whether you’re new or building advanced dashboards, knowing how to use Power BI with a Date Table ensures your visuals show accurate trends.

Even in Power BI advanced reporting setups, the Date Table keeps calculations consistent across complex models.

A Date Table stores a complete list of dates in a set period, along with helpful fields like year, month, and quarter. This structure lets you filter, group, and calculate without errors or mismatched formats. You can run time intelligence functions, compare periods, and keep your visuals consistent.

Without it, your reports risk inconsistency. You might have date columns scattered across datasets, each formatted differently. A Date Table for Power BI centralizes this logic. You create it once, connect it to your data model, and every visual gets the same date structure.

We’ll break down what a Date Table is, why you need it, methods to create one, and how to analyze it. You’ll also see how tools like ChartExpo help visualize your data clearly. By the end, you’ll know how to make your reports more accurate and easier to maintain.

Table of Contents:

  1. What is a Date Table in Power BI?
  2. Why is the Date Table for Power BI Useful?
  3. Methods for Creating a Date Table for Power BI
  4. How to Create a Date Table in Power BI?
  5. How to Analyze a Date Table in Power BI?
  6. How to Use a Date Table in Power BI?
  7. Pros and Cons of Using a Date Table for Power BI
  8. Best Practices of Power BI Date Table
  9. FAQs: Date Table for Power BI
  10. Wrap Up: Date Table for Power BI

What is a Date Table in Power BI?

Definition: Many ask what is date table is in Power BI — it’s a dedicated table listing all dates in a range with related time fields.

A Date Table in Power BI is a dedicated table that lists all dates in a chosen period and adds extra fields such as year, month, week, and day. It supports the date hierarchy in Power BI, which is needed for drilling down in visuals.

In Power BI pro workspaces, a shared Date Table improves collaboration and keeps every report aligned on the same time periods.

A Date Table enables the date hierarchy in Power BI so you can drill from years down to days in visuals.

You can use it to group data, set fiscal calendars, or standardize formats. In Power BI Pro environments, a Date Table helps teams work with the same time logic across all reports. This avoids confusion when multiple datasets feed into the same dashboard.

It also makes your model easier to maintain. You store date logic in one place instead of repeating calculations in every visual or dataset.

Why is the Date Table for Power BI Useful?

An effective calendar table in Power BI lets you use fiscal calendars, custom week numbers, and other time logic not in your source data.

An effective calendar table in Power BI unlocks more than simple filtering. It’s required for many DAX time intelligence functions such as TOTALYTD, SAMEPERIODLASTYEAR, and DATESINPERIOD.

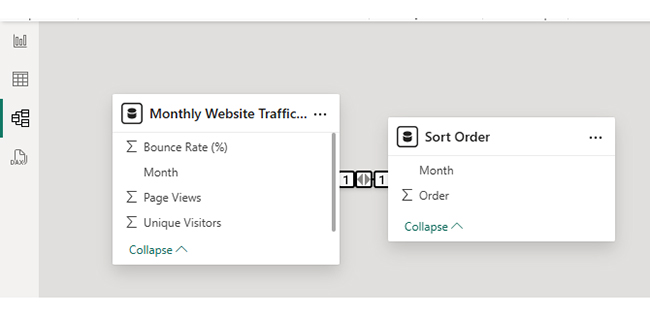
A Date Table strengthens your Power BI data model by linking facts to a single, reliable time dimension.

You can create fiscal years, custom week numbers, and special reporting periods that your raw data may not include. This helps you align reporting to your business calendar, not just the standard calendar.

It also improves your Power BI data model. A clear relationship between your fact tables and the Date Table ensures filters and slicers work consistently. You get reliable rolling averages, period comparisons, and seasonal trend analysis without rebuilding date logic each time.

Methods for Creating a Date Table for Power BI

You can create a date table in Power BI from source data, DAX, Power Query, or auto-generated options.

You have multiple ways to build a Date Table, depending on your needs and technical setup.

  • Source Data
    If your ERP or warehouse already has a clean date table, you can import it. This is fast, and the table may already include useful fields like fiscal periods. It works best when you share one standard calendar across systems.
  • Auto Date/Time
    Power BI can generate hidden date tables automatically. It’s quick and needs no setup. But you can’t edit it, so it’s better for simple reports or prototypes.
  • DAX (Data Analysis Expressions)
    Using DAX functions like CALENDAR() or CALENDARAUTO(), you can create a Date Table with exactly the range and columns you want. This is ideal for advanced scenarios with custom date logic.
  • Power Query (M Code)
    In Power Query, you can generate a Date Table during your ETL process. It refreshes automatically and works well when you want reusable date logic in multiple reports.

You can define your own Power BI date format when building a Date Table using DAX or Power Query.

How to Create a Date Table in Power BI?

Using DAX Method

  • Step 1: Open Power BI Desktop

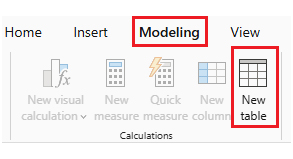
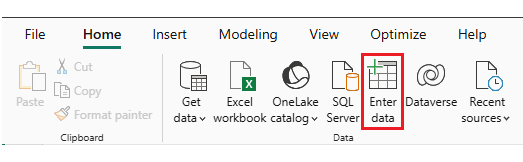
You create Power BI calculated tables when you use the Modeling tab to add a new Date Table with DAX.

Open your report or start a new file. Click the Modeling tab in the top ribbon, then select New Table to create a blank table with a formula bar.

Date Table for Power BI
  • Step 2: Enter the DAX Formula

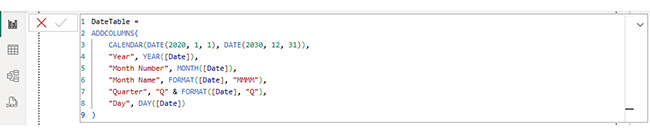
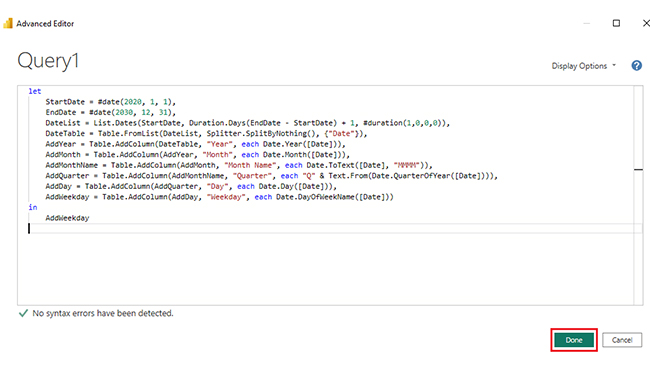
In the formula bar, type your DAX expression to generate dates and add columns like year, month name, and quarter.

Date Table for Power BI
  • Step 3: Mark the Table as a Date Table

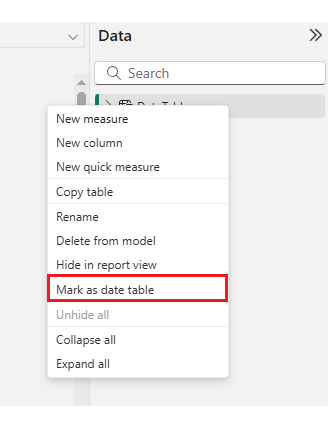
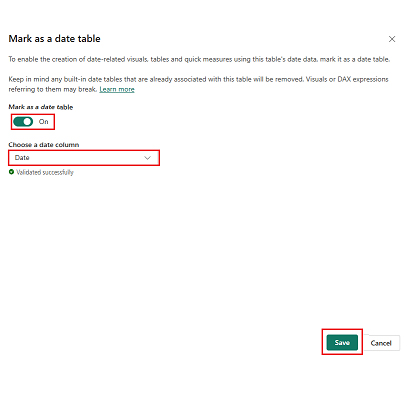
Right-click the table in the Fields pane, choose Mark as Date Table, pick your date column, and save. This lets DAX time functions work correctly.

Date Table for Power BI

Select the correct column in the dialog and click Save.

Date Table for Power BI

Using Power Query

  • Step 1: Open Power BI and Launch Power Query Editor

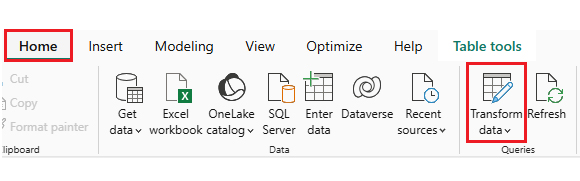
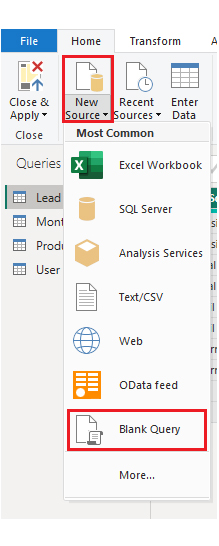
Open Power BI and click Power BI transform data to create your Date Table in the Query Editor.

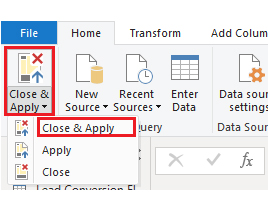
In the Home tab, click Transform Data to open Power Query.

Date Table for Power BI
  • Step 2: Create a New Blank Query
Date Table for Power BI
In New Source, choose Blank Query, then open Advanced Editor to paste your M code.
Date Table for Power BI
  • Step 3: Rename and Load the Table

Click Close & Apply to load the table, and give it a clear name like DateTable.

Date Table for Power BI
  • Step 4: Mark as a Date Table

Right-click it in the Fields pane, choose Mark as Date Table, and select the date column.

How to Analyze a Date Table in Power BI?

With a date table in Power BI, you can run accurate trend charts and period comparisons across years or months.

With a Date Table active, you can track trends over time, compare this year’s data to last year’s, and spot seasonal shifts. You can use charts to show monthly growth or weekly averages.

A Power BI date table also supports filtering across multiple visuals with one slicer. Combine it with a tool like ChartExpo for more chart options beyond the defaults.
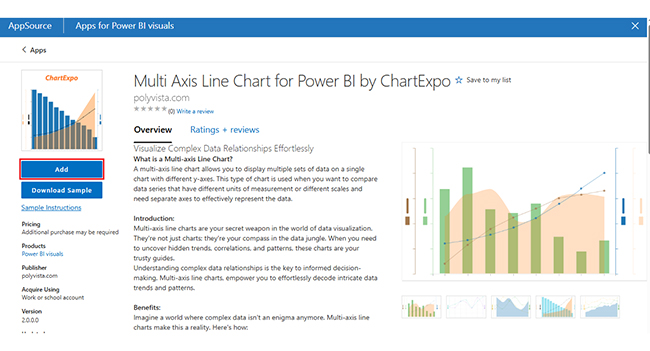
Why Use ChartExpo?

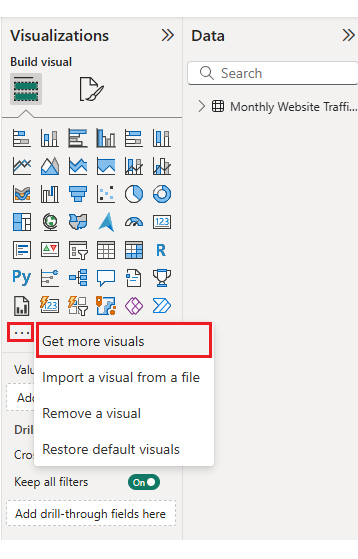
ChartExpo makes building visuals in Power BI easier. You don’t need complex DAX to design clear, time-based charts.

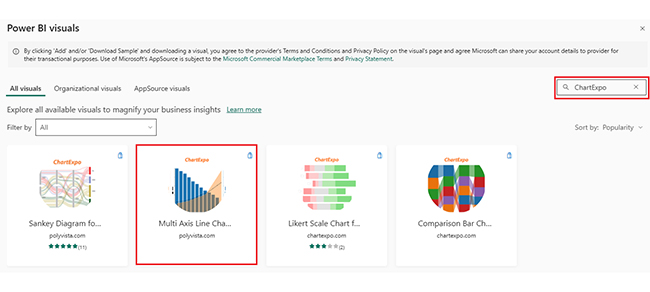
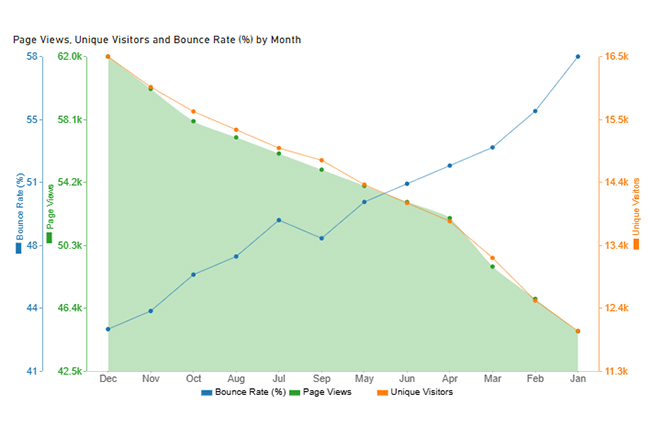
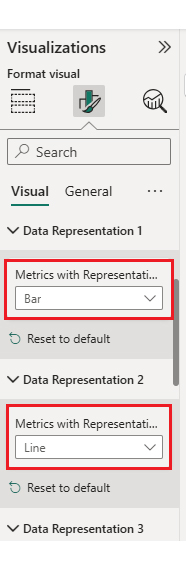
It includes visual types you won’t find in the default Power BI set. You can quickly create a Multi Axis Line Chart to compare different metrics on the same timeline.

ChartExpo works smoothly with Date Tables, helping you present seasonal patterns, growth trends, and other time-based insights. It’s affordable, easy to install, and offers a free trial.
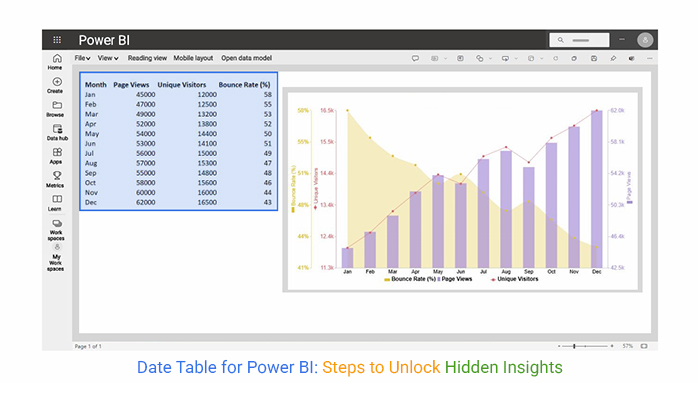
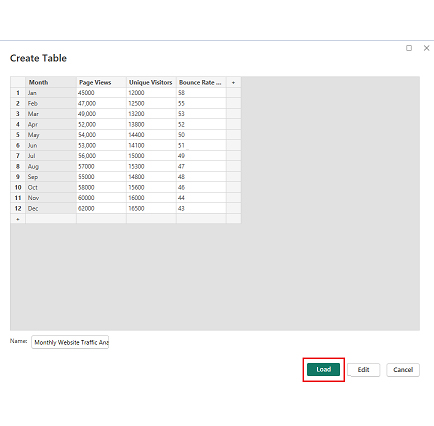
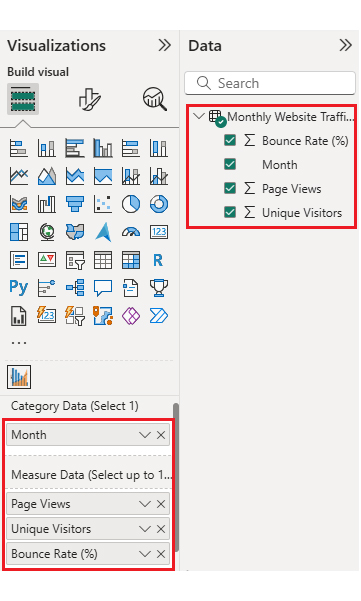
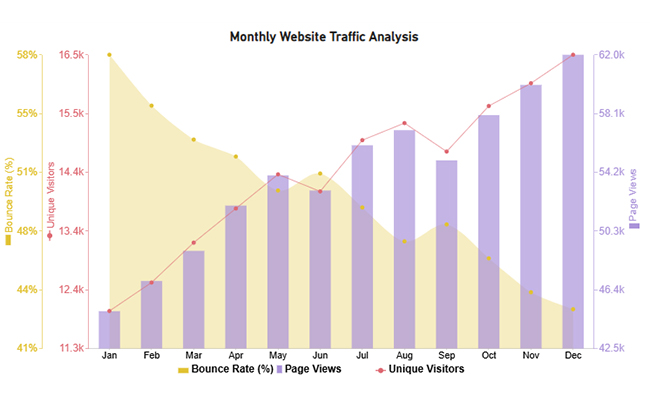
Example Data:

Month Page Views Unique Visitors Bounce Rate (%)
Jan 45000 12000 58
Feb 47,000 12500 55
Mar 49,000 13200 53
Apr 52,000 13800 52
May 54,000 14400 50
Jun 53,000 14100 51
Jul 56,000 15000 49
Aug 57000 15300 47
Sep 55000 14800 48
Oct 58000 15600 46
Nov 60000 16000 44
Dec 62000 16500 43

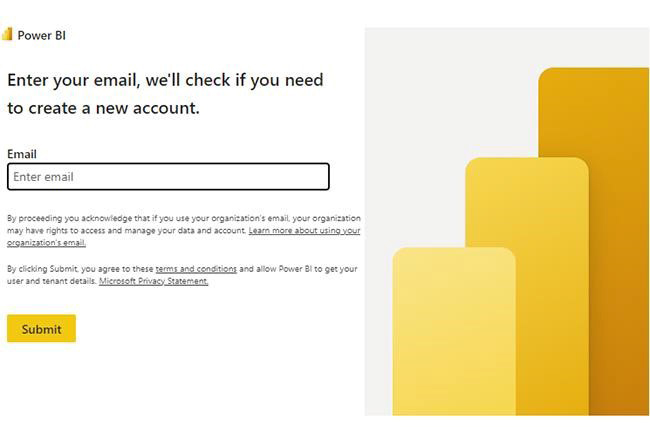
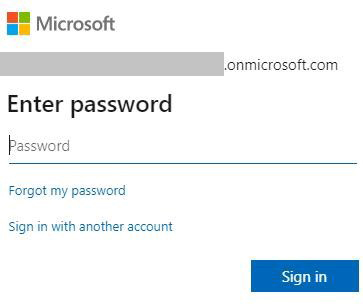
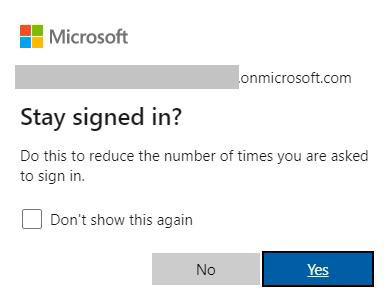
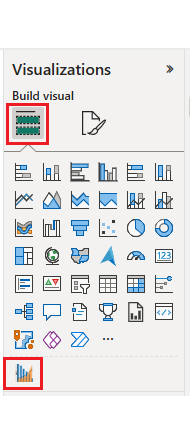
Power BI Login and Setup for Chart

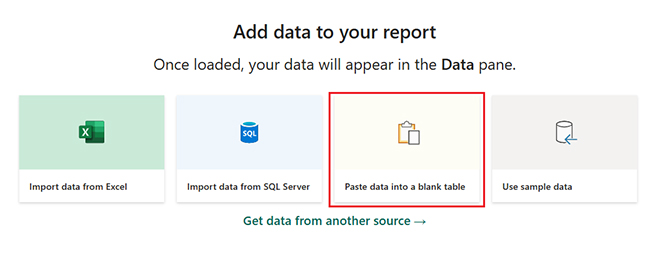
Open Power BI, sign in, and paste the dataset into a blank report.

  • Enter your email, and click the “Submit” button.
Date Table for Power BI
  • Enter your password and click the “Sign in” button.
Date Table for Power BI
  • Choose whether to stay signed in.
Date Table for Power BI
  • Click Paste data into a blank report to load your table.
Date Table for Power BI
  • Name the table and click Load.
Date Table for Power BI
  • Open “Get more visuals” from the Visualizations panel.
Date Table for Power BI
  • Search for ChartExpo and choose Multi Axis Line Chart.
Date Table for Power BI
  • Click Add to install.
Date Table for Power BI
  • Select the visual from the panel.
Date Table for Power BI
  • Assign your category and measure fields.
Date Table for Power BI
  • Enter your ChartExpo license key to remove the watermark.
Date Table for Power BI
  • The chart now displays cleanly.
Date Table for Power BI

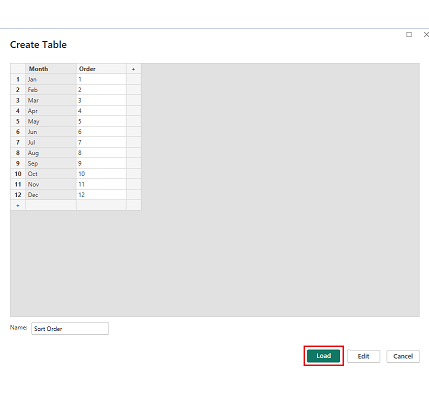
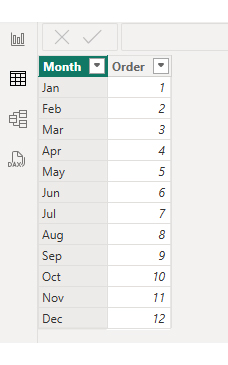
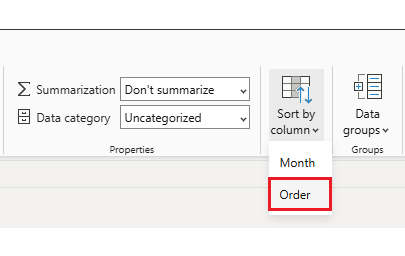
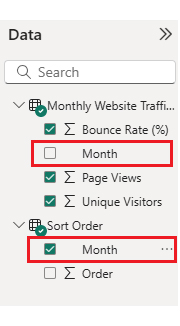
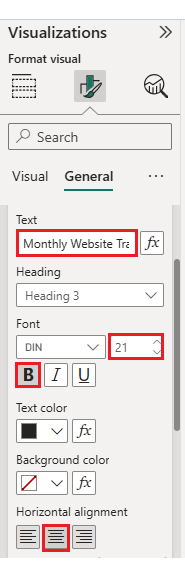
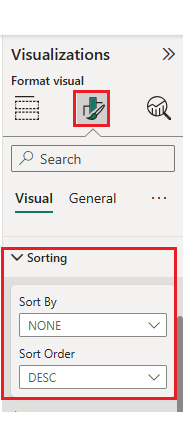
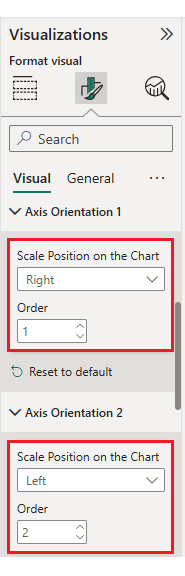
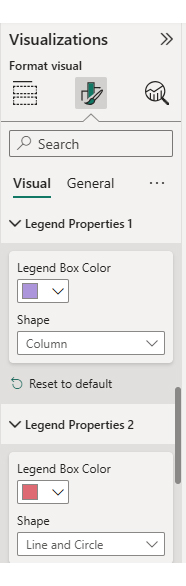
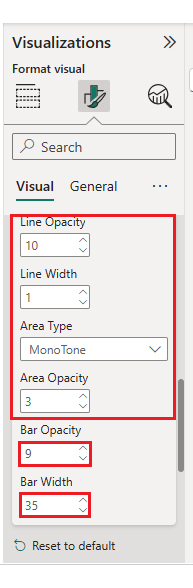
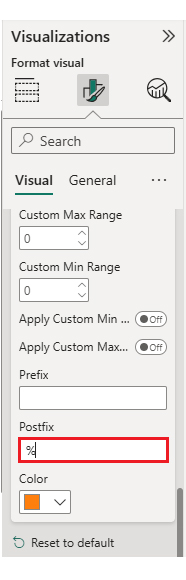
Custom Sorting and Styling
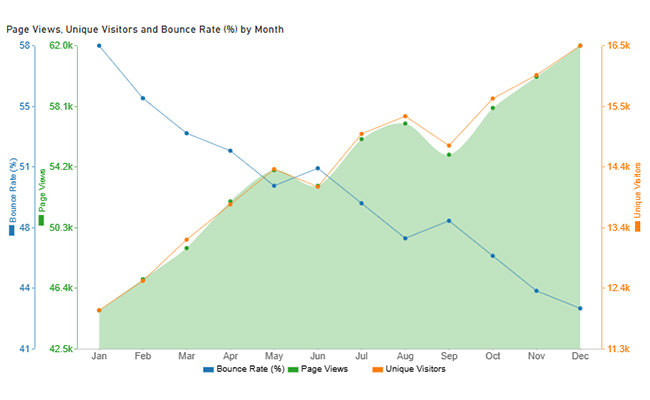
  • Click Enter data to make a Sort Order table.
Date Table for Power BI
  • Name it and load it.
Date Table for Power BI
  • Link it to your main table.
Date Table for Power BI
  • Select the Month column.
Date Table for Power BI
  • Choose Sort by Order.
Date Table for Power BI
  • Use the Month column from Sort Order in your chart.
Date Table for Power BI
  • The X-axis now shows the correct month order.
Date Table for Power BI
  • Change the chart title.
Date Table for Power BI
  • Sort the data.
Date Table for Power BI
  • Adjust the data display.
Date Table for Power BI
  • Switch axis orientation if needed.
Date Table for Power BI
  • Change legend shapes and colors.
Date Table for Power BI
  • Adjust bar width and opacity.
Date Table for Power BI
  • Add a percentage sign to the bounce rate.
Date Table for Power BI
  • Here’s the finished chart.
Date Table for Power BI

Key Insights

  • Page views rose steadily each month.
  • Bounce rate dropped from 58% to 41% over the year.
  • Unique visitors increased, with a slight dip mid-year.
  • December had the highest engagement.
  • Growth in page views aligned with improved bounce rate.

How to Use a Date Table in Power BI?

You can group data in a pivot table in Power BI to reveal trends over months or quarters using your Date Table.

With a Date Table marked, you can:

  • Add slicers for year, month, or quarter that control all visuals.
  • Use DAX to calculate metrics like YTD sales.
  • Drill down from year to month to day in charts.
  • Group dates in a pivot table in Power BI to spot trends.

Pros and Cons of Using a Date Table for Power BI

Pros

  • Full support for DAX time functions.
  • Consistent date logic across visuals.
  • Supports fiscal or business calendars.
  • Uniform filters across reports.

Cons

  • Adds size to the model.
  • Needs updates if periods change.
  • Requires setup and a clear structure.

Best Practices of Power BI Date Table

  • Always mark the table as a Date Table.
  • Use a continuous date range without gaps.
  • Keep the date column unique.
  • Add fiscal year and period if needed.
  • Use calculated columns for performance where possible.

FAQs: Date Table for Power BI

How to set a date table in Power BI?

Right-click the table, choose Mark as Date Table, and pick the unique date column.

What is the date table function in Power BI?

Use CALENDAR() or CALENDARAUTO() in DAX to generate date tables based on your data range.

Wrap Up: Date Table for Power BI

A Date Table for Power BI isn’t just a list of dates. It’s a core tool for accurate, flexible, and consistent time-based analysis. It helps you run year-over-year comparisons, track seasonal trends, and use fiscal calendars with ease.

Whether you create it with DAX or Power Query, the benefits are clear — cleaner models, better filtering, and more powerful calculations. Add tools like ChartExpo to visualize your insights in more engaging ways, and your reports become both clearer and more actionable.

In Power BI, mastering your Date Table means mastering your timeline. It’s a skill that pays off in every report you build.

How much did you enjoy this article?

PBIAd1
Start Free Trial!
152957

Related articles

next previous
Power BI10 min read

Custom BI Development for Growing Businesses

Custom BI Development with Power BI creates tailored dashboards and visuals that turn complex data into clear, actionable insights.

Power BI8 min read

Apps for Power BI: From Data to Insights in a Few Clicks

This guide dives deep into what Apps for Power BI are, how to use them, and the types of Power BI Apps. You'll also discover the limitations of Power BI Apps.

Power BI7 min read

Power BI Features: Insights Made Easy with Power BI

This guide uncovers various Power BI features. It explains why they're important, lists the top 10 best features, and offers tips for using them.

Power BI14 min read

Power BI Data Visualizations: Building Charts That Inspire

Discover and navigate Power BI data visualizations. Enhance your data visualization capabilities. Choose the most appropriate tools for your use case.

Power BI8 min read

Power BI Incremental Refresh: A Complete Guide

This guide dives deep into what the Power BI incremental refresh is. It shows you why you should use it, and how to set up incremental refresh in Power BI.

ChartExpo logo

Turn Data into Visual
Stories

CHARTEXPO

  • Home
  • Gallery
  • Videos
  • Services
  • Pricing
  • Contact us
  • FAQs
  • Privacy policy
  • Terms of Service
  • Sitemap

TOOLS

  • ChartExpo for Google Sheets
  • ChartExpo for Microsoft Excel
  • Power BI Custom Visuals by ChartExpo
  • Word Cloud

CATEGORIES

  • Bar Charts
  • Circle Graphs
  • Column Charts
  • Combo Charts
  • Comparison Charts
  • Line Graphs
  • PPC Charts
  • Sentiment Analysis Charts
  • Survey Charts

TOP CHARTS

  • Sankey Diagram
  • Likert Scale Chart
  • Comparison Bar Chart
  • Pareto Chart
  • Funnel Chart
  • Gauge Chart
  • Radar Chart
  • Radial Bar Chart
  • Sunburst Chart
  • see more
  • Scatter Plot Chart
  • CSAT Survey Bar Chart
  • CSAT Survey Chart
  • Dot Plot Chart
  • Double Bar Graph
  • Matrix Chart
  • Multi Axis Line Chart
  • Overlapping Bar Chart
  • Control Chart
  • Slope Chart
  • Clustered Bar Chart
  • Clustered Column Chart
  • Box and Whisker Plot
  • Tornado Chart
  • Waterfall Chart
  • Word Cloud
  • see less

RESOURCES

  • Blog
  • Resources
  • YouTube
SIGN UP FOR UPDATES

We wouldn't dream of spamming you or selling your info.

© 2025 ChartExpo, all rights reserved.