• Home
  • Tools dropdown img
    • Spreadsheet Charts

      • ChartExpo for Google Sheets
      • ChartExpo for Microsoft Excel
    • Power BI Charts

      • Power BI Custom Visuals by ChartExpo
    • Word Cloud

  • Charts dropdown img
    • Chart Category

      • Bar Charts
      • Circle Graphs
      • Column Charts
      • Combo Charts
      • Comparison Charts
      • Line Graphs
      • PPC Charts
      • Sentiment Analysis Charts
      • Survey Charts
    • Chart Type

      • Box and Whisker Plot
      • Clustered Bar Chart
      • Clustered Column Chart
      • Comparison Bar Chart
      • Control Chart
      • CSAT Survey Bar Chart
      • CSAT Survey Chart
      • Dot Plot Chart
      • Double Bar Graph
      • Funnel Chart
      • Gauge Chart
      • Likert Scale Chart
      • Matrix Chart
      • Multi Axis Line Chart
      • Overlapping Bar Chart
      • Pareto Chart
      • Radar Chart
      • Radial Bar Chart
      • Sankey Diagram
      • Scatter Plot Chart
      • Slope Chart
      • Sunburst Chart
      • Tornado Chart
      • Waterfall Chart
      • Word Cloud
    • Google Sheets
      Microsoft Excel
  • Services
  • Pricing
  • Contact us
  • Blog
  • Support dropdown img
      • Gallery
      • Videos
      • Contact us
      • FAQs
      • Resources
    • Please feel free to contact us

      atsupport@chartexpo.com

Categories
All Data Visualizations Data Analytics Surveys
Add-ons/
  • Google Sheets
  • Microsoft Excel
  • Power BI
All Data Visualizations Data Analytics Surveys
Add-ons
  • Google Sheets
  • Microsoft Excel
  • Power BI

We use cookies

This website uses cookies to provide better user experience and user's session management.
By continuing visiting this website you consent the use of these cookies.

Ok

ChartExpo Survey


Home > Blog > Power BI

Power BI and AWS Integration for Better Data Insights

AWS products and services are known for efficiently storing data. They’re also cost-effective, secure, and reliable. That’s why business owners of all sizes use them to store their data.

Power BI and AWS

However, not everyone knows what Power BI and AWS entail. In this guide, you’ll discover all there is to know about Power BI and AWS, requirements for Power BI on AWS, and how to install and configure Microsoft Power BI to AWS data sources.

Table of Contents:

  1. What is Power BI AWS?
  2. What are the Requirements for Power BI on AWS?
  3. How to Install and Configure Microsoft Power BI to AWS Data Sources?
  4. How to Create Visualizations in Power BI?
  5. What are the Benefits of Power BI Integration with AWS?
  6. Wrap Up

First…

What is Power BI AWS?

Power BI AWS involves the integration of Microsoft Power BI with Amazon Web Services (AWS). The Microsoft Power BI is a business analytics service by Microsoft, while the Amazon Web Service is a comprehensive cloud computing platform offered by Amazon.

The integration helps users to take advantage of the powerful data visualization and reporting capabilities of Power BI, and also utilize the AWS infrastructure for data processing, management, and storage.

What are the Requirements for Power BI on AWS?

Power BI Requirements

  • Power BI Desktop: You need to install the tool on your Windows machine.
  • Power BI Service: You should have a Power BI Pro or Premium account to share and publish reports.
  • Gateway: The on-premises data gateway is needed for users who need to connect to on-premises data sources.

AWS Requirements

You’ll need an AWS account with access to the required services. These include:

  • Data Storage Services: Like the Amazon S3, Amazon RDS, and Amazon Redshift.
  • Data Processing Services (if necessary): Like the AWS Lambda, AWS Glue, and Amazon EMR.
  • Networking and Security: Like the VPC (Virtual Private Cloud), IAM (Identity and Access Management), Security Groups, and ACLs.

Configuration Steps

Set Up AWS Data Sources

  • Create and configure data storage solutions like RDS, Redshift, and Amazon S3.
  • Populate the data sources with the necessary data.

Networking and Security Configuration

  • Set up the IAM roles and policies. This will enable the Power BI to access AWS data sources.
  • Configure security groups, VPC, and network ACLs as required.

Power BI Configuration

  • With the built-in connectors, connect the Power BI Desktop to the AWS data sources like Amazon S3, Amazon RDS, and Amazon Redshift.
  • Transform and model the data using Power BI’s Power Query.
  • Create the necessary dashboards and reports.
  • Publish the reports to the Power BI Service for easy collaboration and sharing.

Best Practices

  • Security: Implement comprehensive security practices that include encryption of data at rest and in transit.
  • Cost Management: Manage and monitor AWS usage to control costs.
  • Scaling: Always plan for scalability, especially if you’re handling large datasets or a high number of users.

How to Install and Configure Microsoft Power BI to AWS Data Sources?

Install Microsoft Power BI

To download Power BI Desktop, navigate to the Power BI website, and download and install Power BI Desktop.

Installing the Power BI Desktop is simple. Follow the installation instructions you’ll see on the download page. After installation, launch the Power BI Desktop.

Configure AWS Data Sources

You can connect Power BI to multiple data sources like Amazon RDS, Amazon S3, Amazon Redshift, and Amazon Athena. Here is how to go about these configurations.

Amazon Redshift

To connect to Redshift:

  • Open the Power BI Desktop
  • Click “Get Data”
  • From the list of data sources, select Amazon Redshift
  • Input the server name (endpoint) and the database name
  • Click OK
  • Input your username and password
  • Click Connect.

Amazon Athena

To connect to Athena:

  • Open the Power BI Desktop
  • Click “Get Data”
  • Select Amazon Athena
  • Input your AWS region and S3 staging directory
  • Click Connect
  • Input your AWS Access Key ID and Secret Access Key.

Amazon RDS (e.g., MySQL, PostgreSQL)

  • Get RDS Endpoint and Credentials
  • Obtain the endpoint, database name, user name, and password for your RDS instance.
  • Connect to RDS
  • Open the Power BI Desktop
  • Click “Get Data.”
  • Select the appropriate database type (e.g PostgreSQL, MySQL)
  • Input the server name (endpoint) and database name
  • Click OK
  • Input the user name and password
  • Click Connect.

Amazon S3

  • You need the AWS credentials and the necessary permissions to access the S3 bucket
  • Connect to S3
  • Open the Power BI Desktop
  • Click “Get Data.”
  • Select Amazon S3
  • Input the bucket URL
  • Click Connect
  • Input the AWS Access Key ID and Secret Access Key.

Configure Data Refresh (Optional)

To set up data refresh, you’ll have to navigate to the Power BI Service, locate your dataset, and click on scheduled refresh. After that, you’ll have to input your AWS credentials and set up the refresh schedule.

How to Create Visualizations in Power BI?

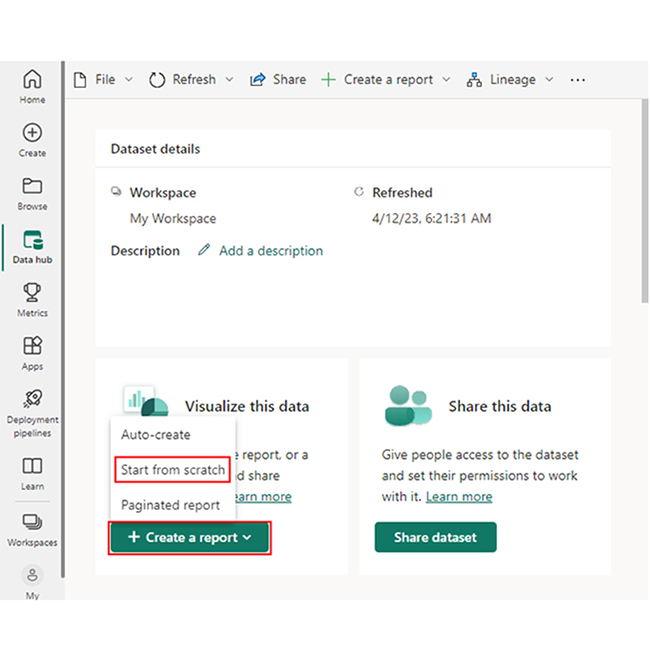
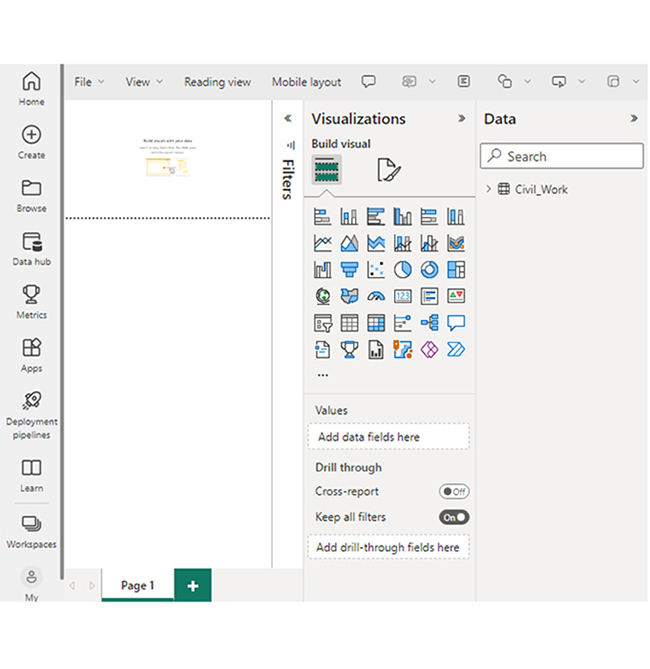
Stage 1: Logging in to Power BI
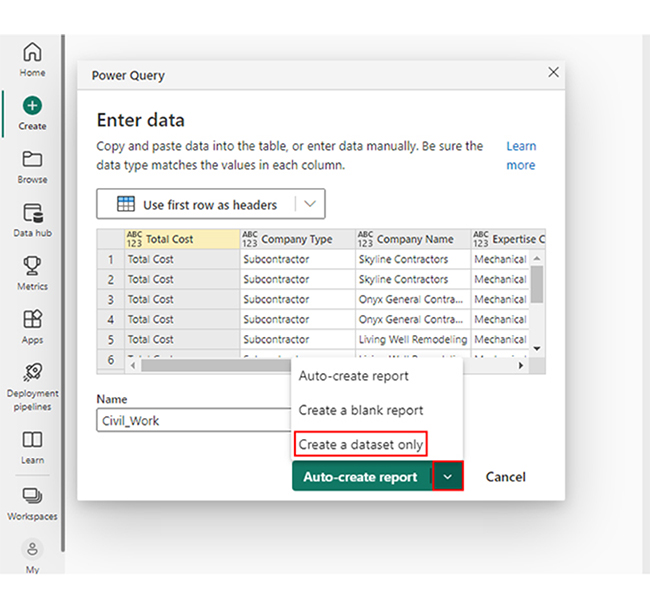
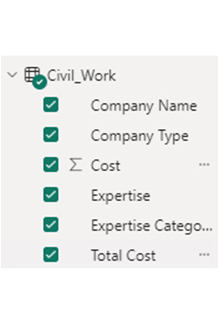
  • Log in to Power BI.
  • Enter your email address and click the “Submit” button.
Enter email to login to Power BI
  • You are redirected to your Microsoft account.
  • Enter your password and click “Sign in“.
Enter Password to login to Power BI
  • You can choose whether to stay signed in.
Click on stay signed in
  • Once done, the Power BI home screen will open.

Stage 2: Creating a Data Set and Selecting the Data Set to Use in Your Chart

  • Go to the left-side menu and click the “Create” button.
  • Select “Paste or manually enter data“.
select Paste or manually enter data in Power BI ce487
  • We’ll use the sample data below for this example.
Total Cost Company Type Company Name Expertise Categories Expertise Cost
Total Cost Subcontractor Skyline Contractors Mechanical Installation Plumbing & Heating 15456
Total Cost Subcontractor Skyline Contractors Mechanical Installation Mechanical Work 10159
Total Cost Subcontractor Onyx General Contractors Mechanical Installation Plumbing & Heating 18045
Total Cost Subcontractor Onyx General Contractors Mechanical Installation Mechanical Work 12695
Total Cost Subcontractor Living Well Remodeling Mechanical Installation Plumbing & Heating 14589
Total Cost Subcontractor Living Well Remodeling Mechanical Installation Welding 11456
Total Cost Supplier Power-up Builders Raw Material Cement 20561
Total Cost Supplier Power-up Builders Raw Material Steel 32456
Total Cost Supplier Five-star Construction Raw Material Bricks 10253
Total Cost Supplier Five-star Construction Raw Material Timber 9000
  • Paste the data table into the “Power Query” window. Next, choose the “Create a dataset only” option.
Click Create a Dataset Only After Connecting Power BI and AWS
  • Navigate to the left-side menu, and click the “Data Hub” option. Power BI will populate the data set list. If the data set has not been created, you’ll get an error message.
Click Data Hub After Connecting Power BI and AWS
  • Choose your preferred data set to be used for the Sankey diagram. After that, Power BI will populate the screen as shown below.
Choose Preferred Data Set After Connecting Power BI and AWS
  • Click on the “Create a report” dropdown, and select “Start from scratch.”
Click Create a Report After Connecting Power BI and AWS
  • The Report Canvas screen will appear as shown below:
See Report Canvas After Connecting Power BI and AWS

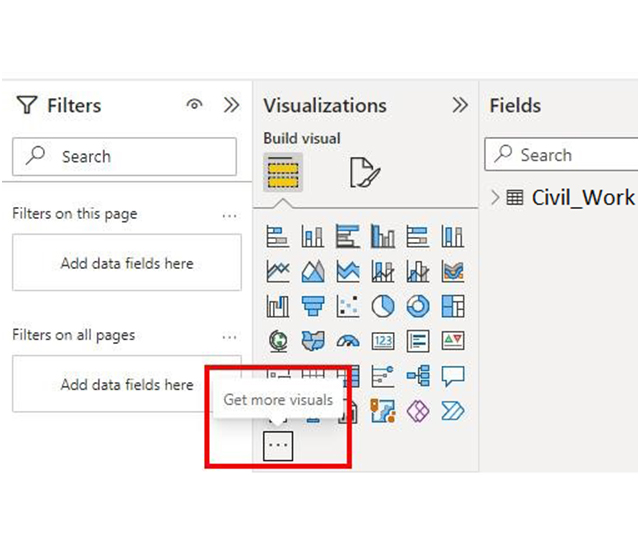
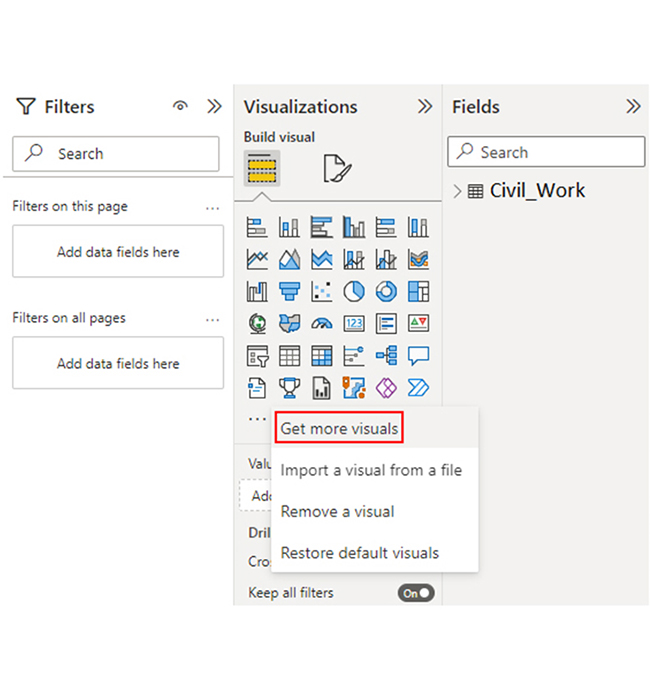
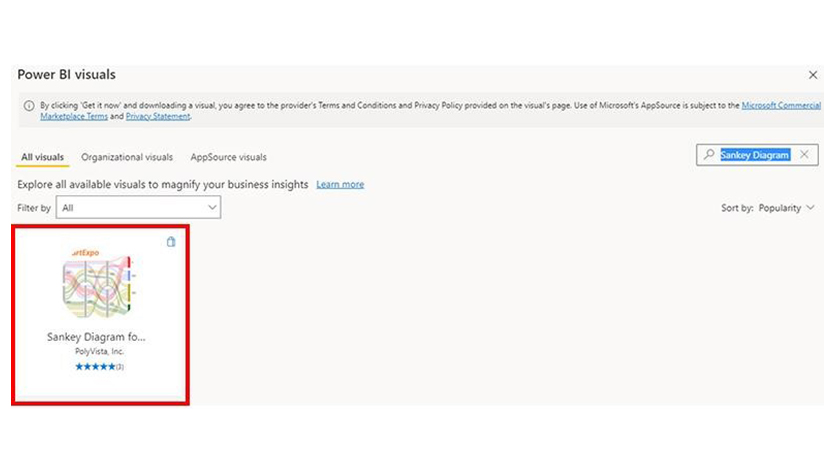
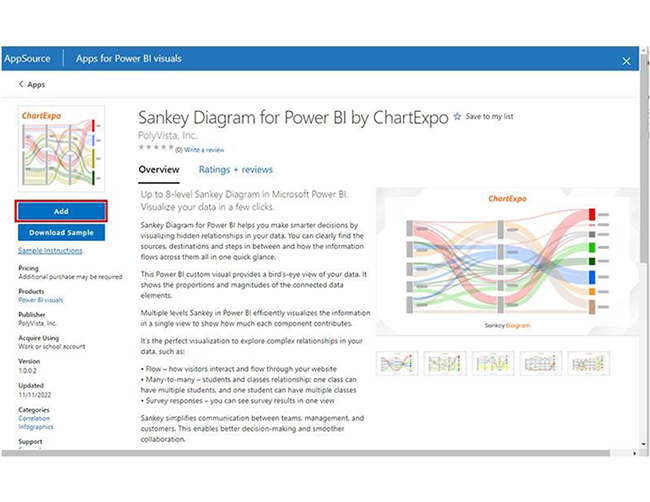
Stage 3: Add the Power BI Sankey Diagram Extension by ChartExpo

  • To create a Sankey Diagram, you’ll need an add-in or Power BI visual from AppSource. You’ll have to navigate to the right side of the Power BI dashboard and open the visualizations panel. To import the Power BI Sankey Diagram extension by ChartExpo, click the ellipsis symbol (…).
Click 3 Dots After Connecting Power BI and AWS
  • On the menu that opens, select the “Get more visuals” option.
Select Get More Visuals After Connecting Power BI and AWS
  • Input “Sankey Diagram for Power by ChartExpo” into the search box. After that, you’ll see the “Sankey Diagram for Power BI by ChartExpo.”
Search Sankey Diagram After Connecting Power BI and AWS
  • Click the “Add” button.
Click Add Button After Connecting Power BI and AWS
  • The “Sankey Diagram for Power BI by ChartExpo” icon will be added to the visualization panel.
See Sankey Diagram in Visualization Panel After Connecting Power BI and AWS

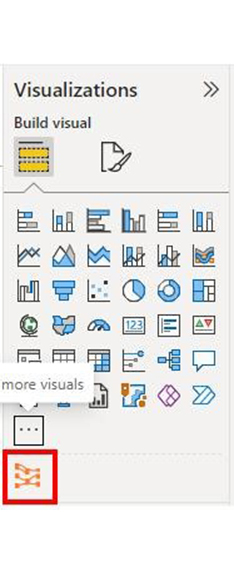
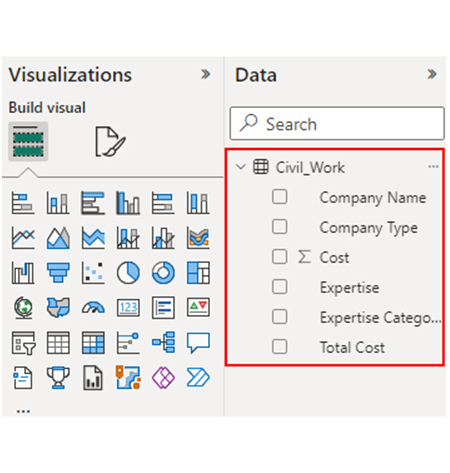
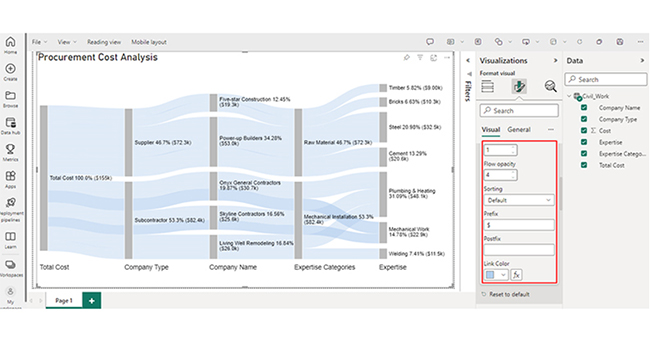
Stage 4: Draw a Sankey Diagram with ChartExpo’s Power BI extension

  • To do that, select the “Sankey Diagram for Power BI by ChartExpo” icon from the visualization panel. A window similar to the one below will open in the report section of your dashboard.
Select Sankey Diagram Icon From Visualization Panel After Connecting Power BI and AWS
  • You can resize the visual. Next, navigate to the right side of the Power BI dashboard. Look out for “Fields” found next to “Visualizations.”
Look Out Fields After Connecting Power BI and AWS
  • You have to select the fields in the following sequence:
    • Total Cost
    • Company Type
    • Company Name
    • Expertise Categories
    • Expertise
    • Cost
Select Fields After Connecting Power BI and AWS
  • You’ll have to provide your email address or ChartExpo license key.
Enter Email Address After Connecting Power BI and AWS

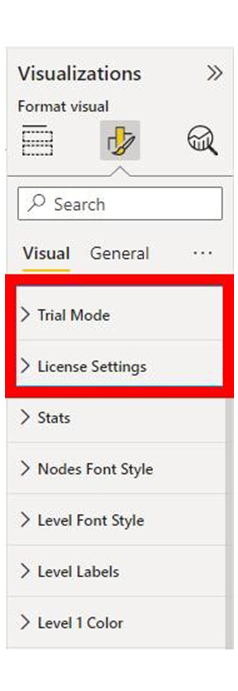
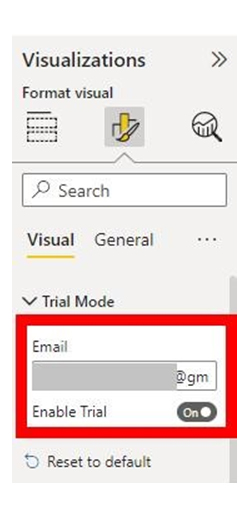
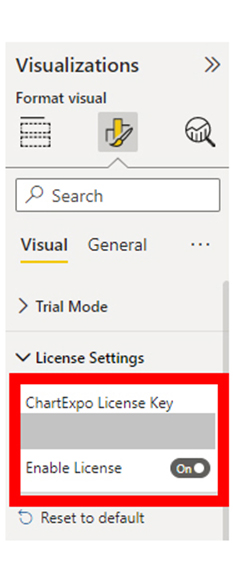
Stage 5: Activate the ChartExpo Trial or Apply a Subscription Key

  • Select the ChartExpo visual. After that, navigate to the visualizations panel and look out for the three icons below “Build Visual.”
Select Visual Look For Three Icon After Connecting Power BI and AWS
  • Choose the middle icon “Format visual.” Next, the visual properties will be populated as shown below.
Choose Format Visual After Connecting Power BI and AWS
  • As a new user, look out for the textbox under the “Trial Mode,” and input your email address. After that, toggle “Enable Trial’ to activate the 7-day trial.
Activate 7 Day Trial After Connecting Power BI and AWS
  • You’ll notice that the Sankey Diagram comes with the ChartExpo watermark.
Notice Sankey Diagram With Watermark After Connecting Power BI and AWS
  • If you have a license key, navigate to the “License Settings” section, and input it into the “ChartExpo License Key” textbox. After that, you’ll have to slide the toggle switch next to “Enable License” to “On.”
Enter License Key After Connecting Power BI and AWS
  • You’ll notice that the Sankey diagram doesn’t come with a watermark.
Notice Sankey Diagram WIthout Watermark After Connecting Power BI and AWS
  • To add a prefix (like the $ sign) with the numeric values in the chart, you’ll have to expand the “Stats” properties and include the prefix value.
Add Prefix in Chart After Connecting Power BI and AWS
  • To add colors to each node, expand the “Level Colors” properties and select the colors.
Add Colors to Each Node After Connecting Power BI and AWS
  • Changes will be saved automatically.
Final Power BI and AWS

Insights

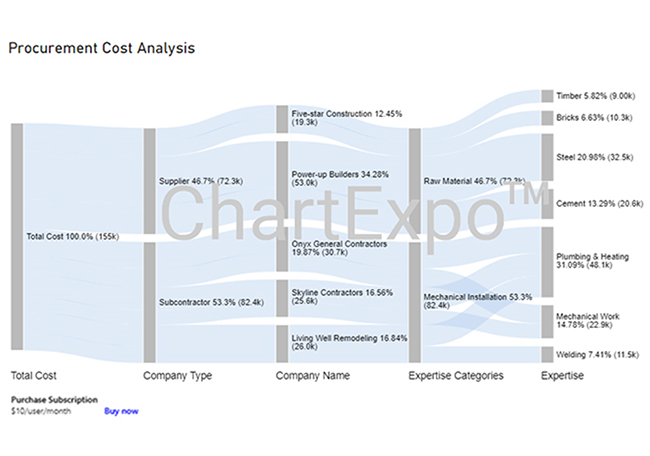
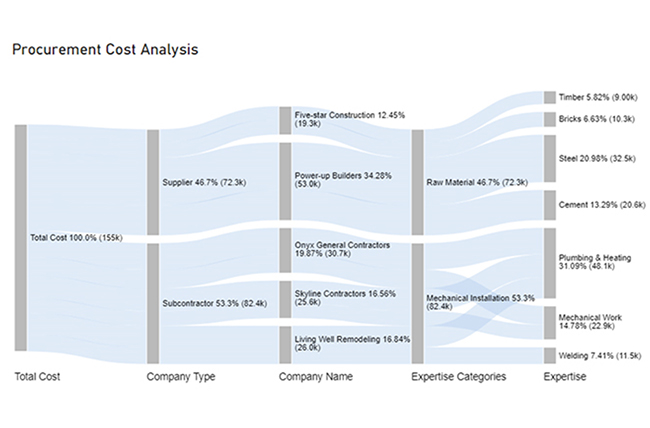
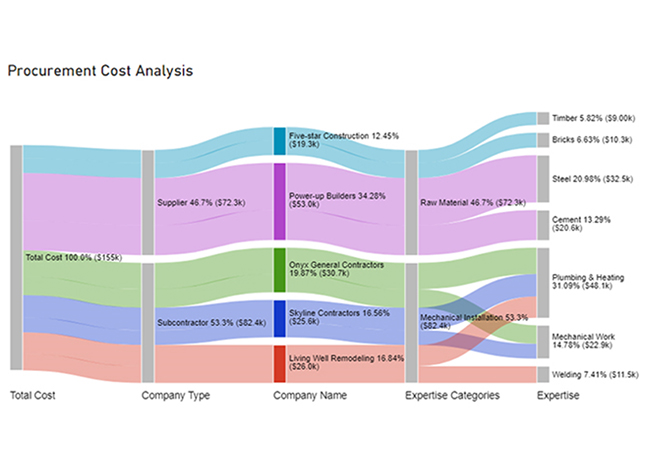
Here are three insights from the chart.

  • At Level 1 (Total Cost), the procurement cost is $155K.
  • At Level 2 (Company Type), out of the $155K cost, $82.4K (53.3%) was spent on subcontractors, while $72.3K (46.7%) was allocated to the supplier.
  • At Level 3 (Company Name), the $72.3K supplier cost was divided between two companies: Five-star Construction and Power-up Builder with charges of $19.3K and $53.0K, respectively.

Transform Data into Actionable Insights with Power BI:

Discover the power of combining Power BI and AWS in this hands-on tutorial. By integrating these two powerful platforms, you can visualize and analyze your AWS data with ease, leveraging Power BI’s advanced charting and graphing capabilities. Whether it’s analyzing cloud storage usage, monitoring performance metrics, or visualizing cost trends, this integration enables you to transform complex AWS data into clear, actionable insights. Mastering Power BI and AWS together empowers you to make data-driven decisions, optimize cloud resources, and enhance reporting accuracy. With rich visuals and dynamic graphs, you can unlock deeper insights, improve collaboration, and drive smarter business strategies.

What are the Benefits of Power BI Integration with AWS?

  • Scalability: You’ll take advantage of the AWS infrastructure to handle large datasets and complex analytics demands.
  • Data Accessibility: It helps the user access and integrate data from multiple AWS services like RDS, S3, Athena, and Amazon Redshift. This will enable comprehensive and unified data analysis.
  • Cost Efficiency: You can take advantage of AWS’s pay-as-you-go pricing model to optimize cost and avoid upfront infrastructure investments.
  • Security and Compliance: The AWS’s robust security features and compliance certifications meet regulatory requirements and ascertain data security.

FAQs

Can Power BI be used with AWS?

Yes. To use Power BI with AWS, you’ll have to connect to AWS data sources like RDS, S3, Athena, and Redshift. That will enable comprehensive data analysis and visualization.

Can we connect Power BI to AWSS3?

Yes, you can connect Power BI to AWS S3. To do that, you’ll have to use Amazon Athena as a bridge, and that helps stored data in S3 to be visualized and queried in Power BI.

What is similar to Power BI in AWS?

The AWS Quick Sight is similar to Power BI. It offers cloud-based business intelligence and data visualization tools. This will, in turn, allow users to create and share interactive dashboards and reports from multiple data sources.

Wrap Up

Power BI AWS involves the use of Power BI for data analytics and AWS services like S3, RDS, and Redshift. The major advantages of using Power BI AWS include enhanced data accessibility, scalability, and taking advantage of AWS’s infrastructure for cost efficiency and performance.

To get the most out of the Power BI AWS, you’ll have to ascertain that the data models are optimized for performance. Furthermore, you’ll have to manage and monitor AWS service usage to control costs. AWS offers flexibility in deploying and designing data solutions tailored to your business needs. This will, in turn, enhance innovation and agility in analytics projects.

Now you know what Power BI AWS is, why will you use it for your data visualization and analysis?

How much did you enjoy this article?

PBIAd2
Start Free Trial!
139731

Related articles

next previous
Power BI12 min read

How to Create a Dashboard in Power BI?

Uncover the secrets through the steps for how to create a dashboard in Power BI. Harness the power of Microsoft's business intelligence platform.

Power BI12 min read

Power BI Sales Dashboard for Actionable Insights

Boost your sales analysis with Power BI. Discover the benefits of a Power BI sales dashboard and learn how to create one with this step-by-step guide.

Power BI12 min read

Healthcare Dashboard Examples for Better Patient Insights

Immerse yourself in Healthcare Dashboard Examples, illustrating innovative ways to transform complex data into actionable insights for healthcare professionals.

Power BI12 min read

Power BI Group By Guide for Effective Data Insights

Learn how Power BI Group By helps you aggregate data, clarify trends, and create reports by grouping values to make large datasets manageable & insightful.

Power BI12 min read

How to Create Sankey Diagram in Microsoft Power BI?

Learn How to Create Sankey Diagram in Microsoft Power BI using Desktop & Web Service. What they are and how to use them effectively.

ChartExpo logo

Turn Data into Visual
Stories

CHARTEXPO

  • Home
  • Gallery
  • Videos
  • Services
  • Pricing
  • Contact us
  • FAQs
  • Privacy policy
  • Terms of Service
  • Sitemap

TOOLS

  • ChartExpo for Google Sheets
  • ChartExpo for Microsoft Excel
  • Power BI Custom Visuals by ChartExpo
  • Word Cloud

CATEGORIES

  • Bar Charts
  • Circle Graphs
  • Column Charts
  • Combo Charts
  • Comparison Charts
  • Line Graphs
  • PPC Charts
  • Sentiment Analysis Charts
  • Survey Charts

TOP CHARTS

  • Sankey Diagram
  • Likert Scale Chart
  • Comparison Bar Chart
  • Pareto Chart
  • Funnel Chart
  • Gauge Chart
  • Radar Chart
  • Radial Bar Chart
  • Sunburst Chart
  • see more
  • Scatter Plot Chart
  • CSAT Survey Bar Chart
  • CSAT Survey Chart
  • Dot Plot Chart
  • Double Bar Graph
  • Matrix Chart
  • Multi Axis Line Chart
  • Overlapping Bar Chart
  • Control Chart
  • Slope Chart
  • Clustered Bar Chart
  • Clustered Column Chart
  • Box and Whisker Plot
  • Tornado Chart
  • Waterfall Chart
  • Word Cloud
  • see less

RESOURCES

  • Blog
  • Resources
  • YouTube
SIGN UP FOR UPDATES

We wouldn't dream of spamming you or selling your info.

© 2025 ChartExpo, all rights reserved.