• Home
  • Tools dropdown img
    • Spreadsheet Charts

      • ChartExpo for Google Sheets
      • ChartExpo for Microsoft Excel
    • Power BI Charts

      • Power BI Custom Visuals by ChartExpo
    • Word Cloud

  • Charts dropdown img
    • Chart Category

      • Bar Charts
      • Circle Graphs
      • Column Charts
      • Combo Charts
      • Comparison Charts
      • Line Graphs
      • PPC Charts
      • Sentiment Analysis Charts
      • Survey Charts
    • Chart Type

      • Box and Whisker Plot
      • Clustered Bar Chart
      • Clustered Column Chart
      • Comparison Bar Chart
      • Control Chart
      • CSAT Survey Bar Chart
      • CSAT Survey Chart
      • Dot Plot Chart
      • Double Bar Graph
      • Funnel Chart
      • Gauge Chart
      • Likert Scale Chart
      • Matrix Chart
      • Multi Axis Line Chart
      • Overlapping Bar Chart
      • Pareto Chart
      • Radar Chart
      • Radial Bar Chart
      • Sankey Diagram
      • Scatter Plot Chart
      • Slope Chart
      • Sunburst Chart
      • Tornado Chart
      • Waterfall Chart
      • Word Cloud
    • Google Sheets
      Microsoft Excel
  • Services
  • Pricing
  • Contact us
  • Blog
  • Support dropdown img
      • Gallery
      • Videos
      • Contact us
      • FAQs
      • Resources
    • Please feel free to contact us

      atsupport@chartexpo.com

Categories
All Data Visualizations Data Analytics Surveys
Add-ons/
  • Google Sheets
  • Microsoft Excel
  • Power BI
All Data Visualizations Data Analytics Surveys
Add-ons
  • Google Sheets
  • Microsoft Excel
  • Power BI

We use cookies

This website uses cookies to provide better user experience and user's session management.
By continuing visiting this website you consent the use of these cookies.

Ok

ChartExpo Survey


Home > Blog > Power BI

Power BI Pro vs Premium: In-Depth Comparison & Analysis

Microsoft’s robust business intelligence tool, Power BI, offers two distinct versions: Power BI Pro vs Power BI Premium. Understanding their differences is essential for finding the right fit for your analytics needs.

Power BI Pro vs. Premium

So, what’s the difference between these two powerhouses?

Let me break it down for you in a way that even your grandma would understand. Power BI Pro is like your favorite pair of jeans – comfortable, reliable, and gets the job done. It offers all the essential features to create stunning visuals and share them with your team.

Conversely, Power BI Premium is like a luxury sports car – sleek, powerful, and built for speed. It has enhanced performance, dedicated capacity, and the ability to handle massive data. This takes your analytics game to a whole new level.

But don’t let the comparisons fool you. Both versions have unique strengths and cater to different user requirements. Therefore, it’s essential to understand the nuances and choose the right solution for your business.

Let me show you how.

Table of Content:

  1. Power BI Pro – What is it?
  2. Power BI Premium – What is it?
  3. Power BI Pro vs Premium Features
  4. Power BI Pro vs Premium Per User
  5. Power BI Pro vs Premium Cost
  6. Power BI Pro vs Power BI Premium Capacity
  7. Power BI Pro vs. Premium: Licensing 
  8. Power BI Pro vs. Premium: A Complete Guide to Creating Reports
  9. Power BI Pro vs Premium: Which One is Perfect For You
  10. Power BI Pro vs Premium – FAQs
  11. Wrap Up

Power BI Pro – What is it?

Definition: Power BI Pro is a cloud-based business analytics service by Microsoft that enables users to create, share, and collaborate on interactive reports and dashboards with real-time data connectivity and advanced visualization features.

Power BI Premium – What is it?

Definition: Power BI Premium is an enterprise-grade analytics solution by Microsoft that provides enhanced performance, larger data capacity, and advanced AI capabilities. It allows organizations to create, share, and manage reports at scale while offering dedicated cloud resources, paginated reports and on-premises reporting with Power BI Report Server.

Power BI Pro vs Premium Features

Feature Power BI Pro Power BI Premium
Pricing Per user subscription Per user & per capacity options
Collaboration & Sharing Share reports & dashboards with other Pro users Share with anyone in the organization (no Pro license required)
Data Capacity 1 GB per dataset Up to 400 GB per dataset (for P SKUs)
Refresh Rate 8 times per day 48 times per day
AI & Machine Learning Limited AI features Advanced AI capabilities (AutoML, Cognitive Services)
Paginated Reports Not available Available (for P SKUs)
On-Premises Reporting Not available Power BI Report Server included
Performance Shared cloud resources Dedicated cloud resources (for P SKUs)
Dataflows & Big Data Support Standard dataflows Enhanced support for large-scale data models

Power BI Pro vs Premium Per User

Power BI offers two main individual licensing options: Power BI Pro and Power BI Premium Per User (PPU). Here’s a breakdown of their key differences:

1. Pricing

  • Power BI Pro: ~$10 per user/month
  • Power BI Premium Per User (PPU): $20 per user/month

2. Data Storage & Refresh Rates

  • Power BI Pro: 1 GB per dataset, 8 scheduled refreshes per day
  • Power BI Premium Per User: 100 GB per dataset, 48 scheduled refreshes per day

3. Features & Performance

  • Power BI Pro: Standard features like dashboards, reports, collaboration, and sharing
  • Power BI Premium Per User: Everything in Pro + AI capabilities, paginated reports, deployment pipelines, and larger model sizes

4. Sharing & Collaboration

  • Power BI Pro: Required for all users to share and access shared content
  • Power BI Premium Per User: Can share reports with other Premium Per User license holders

5. Advanced Features

  • Power BI Pro: No access to advanced AI, paginated reports, or premium features
  • Power BI Premium Per User: Includes AI-powered insights, auto ML, and dataflows with enhanced capabilities

Power BI Pro vs Premium Cost

Power BI offers two primary licensing options: Power BI Pro and Power BI Premium, each tailored to different organizational needs and budgets.

Power BI Pro

  • Cost: Approximately $10 per user/month.
  • Features:
    • Enables individual users to create, share, and collaborate on reports and dashboards.
    • Provides up to 10 GB of storage per user.
    • Allows up to eight data refreshes per day.
    • Integrates seamlessly with other Microsoft products like Dynamics 365 and Microsoft 365.

Power BI Premium

Power BI Premium is available in two distinct licensing models:

Premium Per User (PPU)

  • Cost: Approximately $20 per user/month.
  • Features:
    • Includes all Pro features.
    • Offers advanced capabilities such as larger dataset storage (up to 100 GB per dataset), enhanced performance, and AI features.
    • Supports up to 48 data refreshes per day.

Premium Per Capacity

  • Cost: Starts at $4,995 per capacity/month.
  • Features:
    • Provides dedicated cloud-based capacity for your organization.
    • Supports larger data models (up to 400 GB per dataset) and increased storage (up to 100 TB).
    • Allows content consumers to review and interact with reports without requiring individual Pro licenses.

Power BI Pro vs Power BI Premium Capacity

Feature Power BI Pro Power BI Premium Capacity
Pricing Model Per User Per Capacity
Cost $10 per user/month Starts at $4,995/month
Storage 10 GB per user 100 TB total
Data Refreshes 8 times/day 48 times/day
Content Sharing Requires Pro license for all users Viewers don’t need a Pro license
Dedicated Resources No Yes
Large Dataset Support No Up to 400 GB
Advanced AI & Paginated Reports No Yes

Power BI Pro vs. Premium: Licensing

Power BI offers various licensing options to cater to the diverse needs of individuals, teams, and organizations. Each option serves different purposes and comes with a distinct pricing structure.

  • Power BI Pro

Power BI Pro is a user-based subscription allowing individuals to create, share, and collaborate on reports and dashboards. Users with a Pro license can share content with other Pro users or via Power BI Apps. It’s suitable for small teams and individuals.

  • Power BI Premium

Power BI Premium is a dedicated cloud-based capacity that provides enhanced performance, scalability, and governance. It caters to organizations with higher data processing demands, offering features like paginated reports and AI capabilities. It’s licensed based on capacity, not users.

Power BI Pro vs. Premium: A Complete Guide to Creating Reports

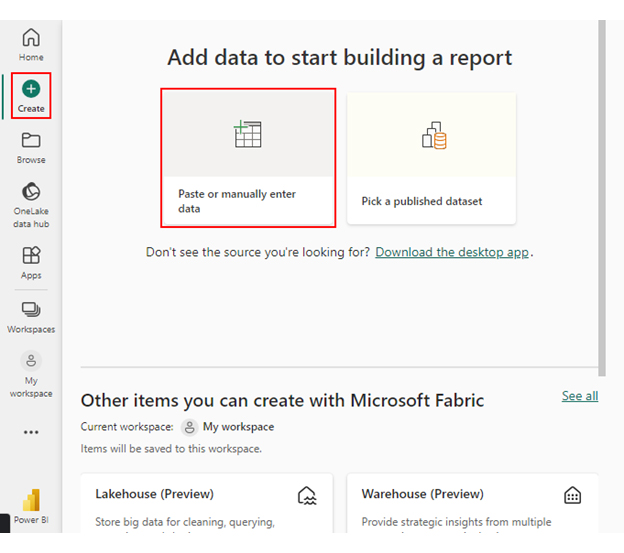
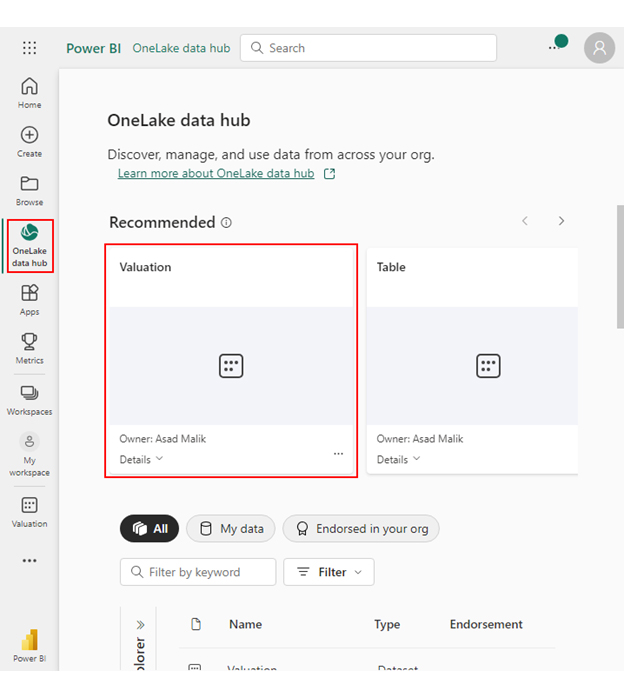
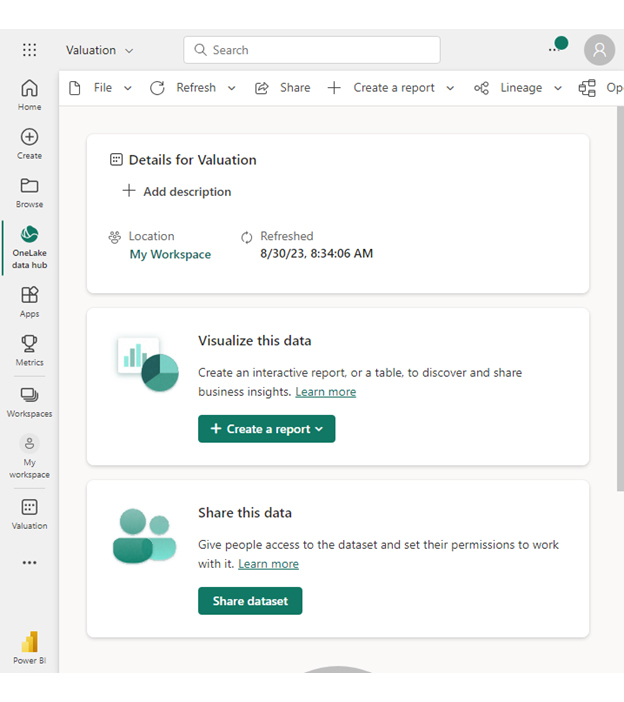
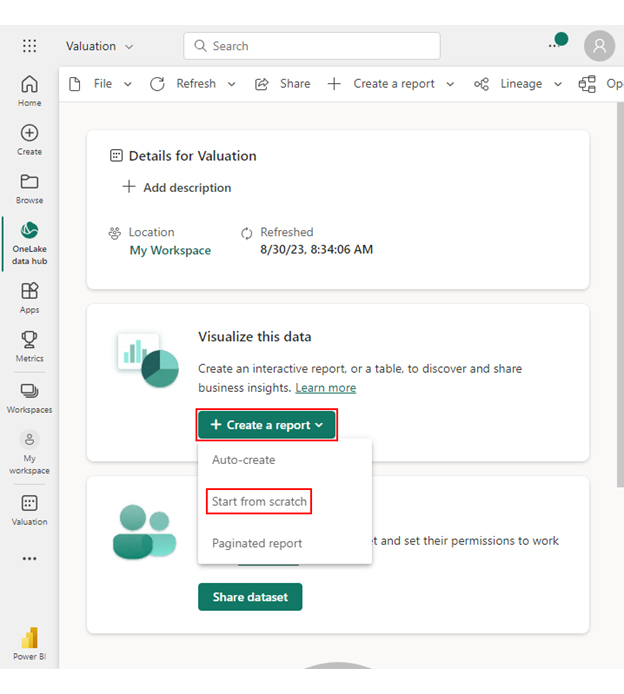
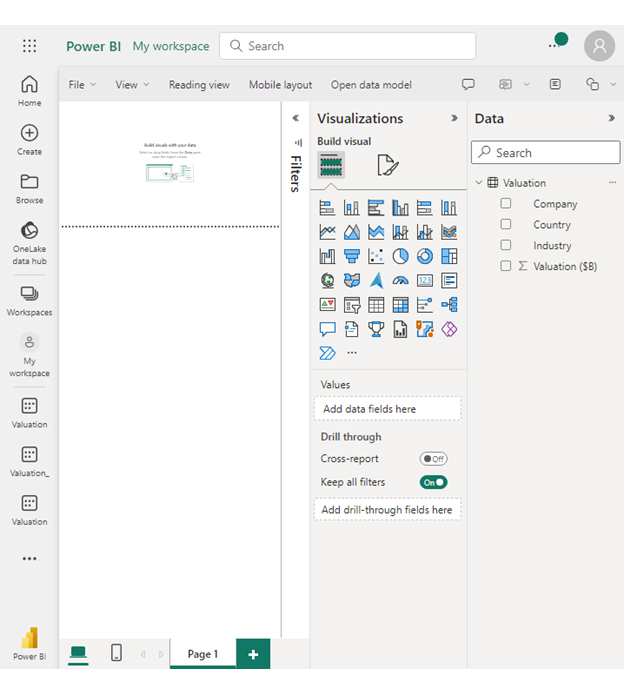
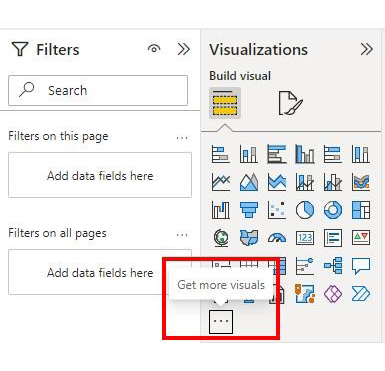
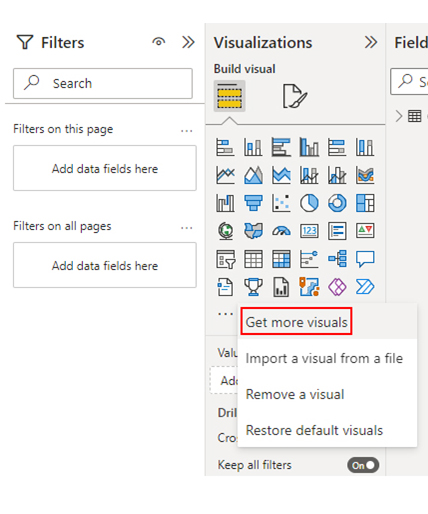
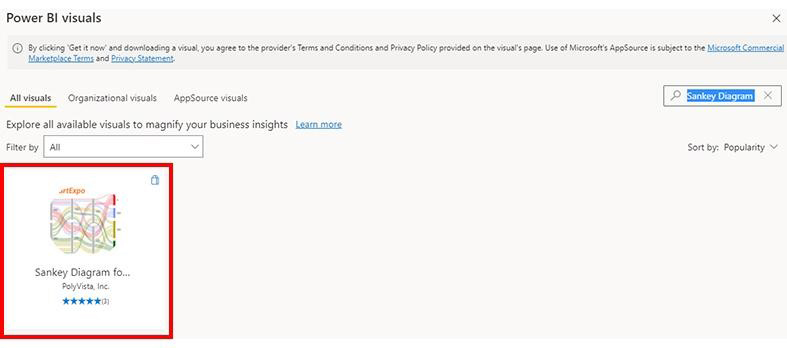
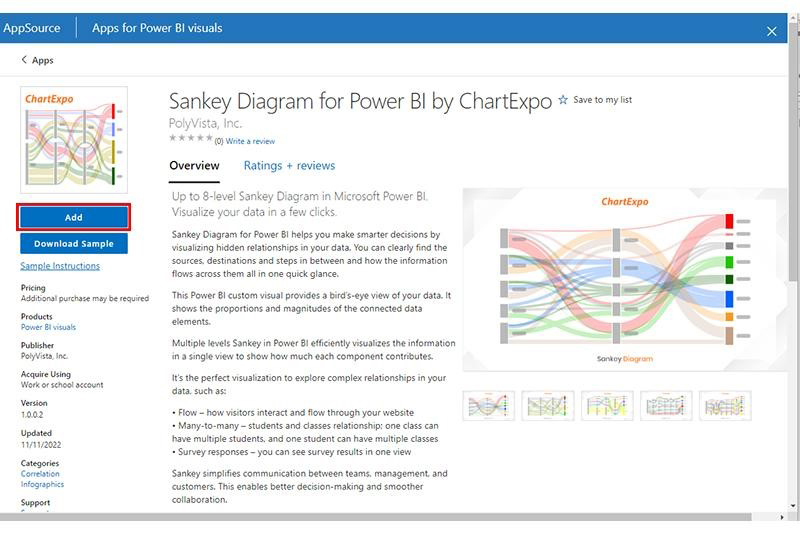
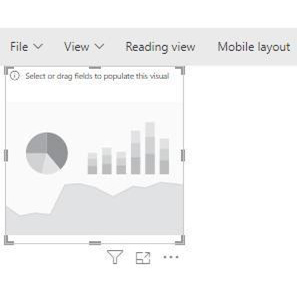
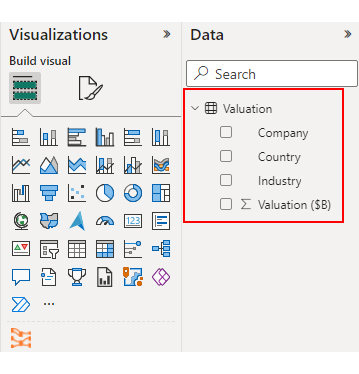
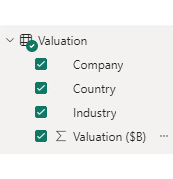
Follow the steps below to learn how to evaluate data in Power BI. We will divide the process into five stages.
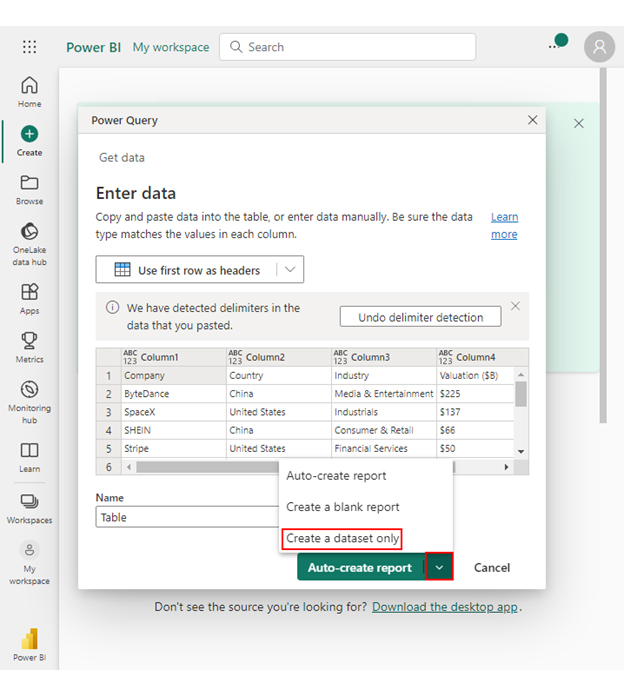
Stage 1: Logging in to Power BI

  • Log in to Power BI.
  • Enter your email. Click the “Submit” button.
Enter email to login to Power BI
  • You are redirected to your Microsoft account.
  • Enter your password and click “Sign in”.
Enter Password to login to Power BI
  • You can choose whether to stay signed in.
Click on stay signed in
  • Once done, the Power BI home screen will open.

Stage 2: Creating a Data Set and Selecting the Data Set to Use in Your Sankey Chart

  • Go to the left-side menu and click the “Create” button.
  • Select “Paste or manually enter data“.
select Paste or manually enter data in Power BI ce449
  • We’ll use the company valuation data below for this example.
Company Country Industry Valuation ($B)
ByteDance China Media & Entertainment $225
SpaceX United States Industrials $137
SHEIN China Consumer & Retail $66
Stripe United States Financial Services $50
Canva Australia Enterprise Tech $40
Revolut United Kingdom Financial Services $33
Epic Games United States Media & Entertainment $31.50
Databricks United States Enterprise Tech $31
Fanatics United States Consumer & Retail $31
OpenAI United States Enterprise Tech $29
Chime United States Financial Services $25
  • Paste the above data table in the Power Query Window.
  • Select the “Create a dataset only” option.
Create Dataset in Power BI ce449
  • On the left-side menu, click “Data Hub“.
  • Power BI populates the data set list. (If you have not created a data set, refer to the Error! Reference source not found section).
Click on Data Hub ce449
  • Choose a data set for the Sankey chart.
  • PBI populates the screen as shown below:
Workspace in Power BI ce449
  • Click on the “Create a report” dropdown.
  • Select “Start from scratch“.
Create Report and start from scratch ce449
  • A Report Canvas screen appears as below:
Report Canvas screen in Power BI ce449

Stage 3: Adding the Power BI Sankey Diagram Extension by ChartExpo

  • Creating the Sankey Diagram requires us to use an add-in or Power BI visual from AppSource.
  • Navigate to the right side of the Power BI dashboard.
  • Open the Power BI Visualizations panel.
  • Click the ellipsis symbol (…) as highlighted in the diagram below. This will import the Power BI Sankey Diagram extension by ChartExpo.
click on to get more visuals ce449
  • The following menu opens:
  • Select the “Get more visuals” option.
get more visuals in Power BI ce449
  • The following window opens.
  • Enter “Sankey Diagram for Power BI by ChartExpo” in the highlighted search box.
  • You should see the “Sankey Diagram for Power BI by ChartExpo”, as shown in the image below.
Sankey Diagram for Power BI by ChartExpo ce446
  • Click the highlighted “Add” button.
Click the Add button ce446
  • Power BI will add the “Sankey Diagram for Power BI by ChartExpo” icon in the visualization panel.
Click on Sankey Diagram Icon

Stage 4: Drawing a Sankey Diagram with ChartExpo’s Power BI extension

  • Select the “Sankey Diagram for Power BI by ChartExpo” icon in the visualization panel.
  • The following window opens in the report section of your dashboard:
Report Section in Dashboard ce449
  • You can resize the visual as needed.
  • Navigate to the right side of your Power BI dashboard.
  • You should see “Fields” next to “Visualizations“.
Fields next to visualizations ce449
  • You’ll select the fields to use in your Sankey chart here.
  • The ChartExpo visual needs to be selected, though. Select the field in the following sequence:
    • Company
    • Country
    • Industry
    • Valuation ($B)
Select fields for Sankey diagram ce449
  • You’ll be asked for a ChartExpo license key or email address.
enter email for ChartExpo license ce430

Stage 5: Activate your ChartExpo Trial or Apply a Subscription Key

  • Select the ChartExpo visual.
  • You should see three icons below “Build Visual” in the Visualizations panel.
Build visual panel in Power BI
  • Select the middle icon, “Format visual“. The visual properties will be populated as shown below.
visual properties in Power BI
  • To begin using ChartExpo as a new user;
    • Enter your email address in the textbox under the “Trial Mode” section. ChartExpo will send the License key to this email upon subscribing to the add-in.
    • Ensure you provide an accurate and up-to-date email address.
    • Toggle “Enable Trial” to activate your 7-day trial.
enter email id
  • You should receive a welcome email from ChartExpo.
  • If you do not find the email in your inbox, kindly check your spam folder.
  • The Sankey Diagram you create under the 7-day trial contains the ChartExpo watermark.
Power BI Pro vs. Premium 1
  • If you have obtained a license key:
    • Enter your license key in the “ChartExpo License Key” textbox in the “License Settings” section (see below).
    • Slide the toggle switch next to “Enable License” to “On“.
enter license key
  • Your Sankey Diagram will then appear without a watermark.
Power BI Pro vs. Premium 2
  • Let’s add colors to each node. Expand the “Level Colors” properties and select the colors.
Coloring Sankey Diagram ce449
  • Let’s add the Prefix (e.g., $ sign) and Postfix (e.g., B sign) with the numeric values in the chart.
  • Expand the “Stats” properties. Add the Prefix value (e.g., $ sign) and Postfix value (e.g., B sign).
Add Prefix Value in Chart ce449
  • Automatically, all changes will be saved.
Final Power BI Pro vs. Premium

Insights

  • Geographic Dominance

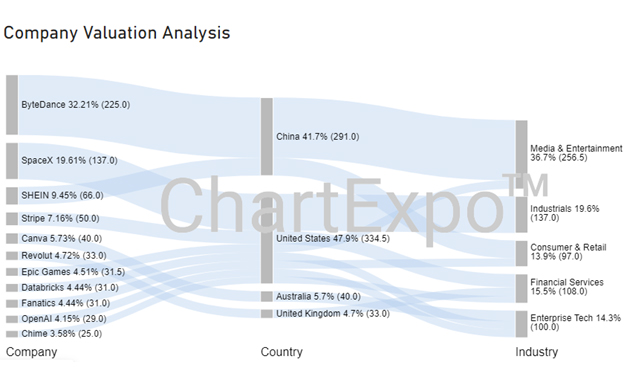
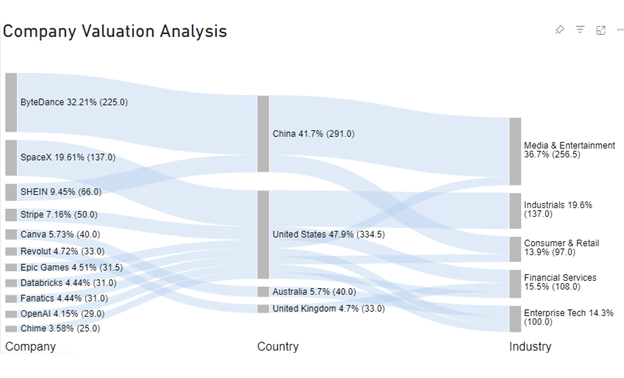
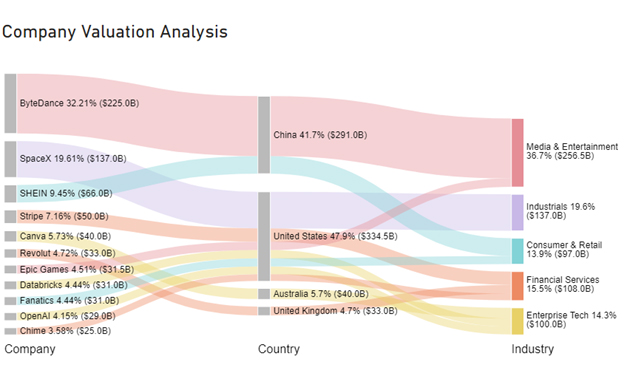
The presence of multiple companies from the United States on the list highlights the country’s strong dominance in the tech and innovation sectors.

  • China’s Rising Influence

ByteDance from China has emerged as a significant player in the Media and Entertainment industry. SHEIN, another Chinese company, has made notable progress in the Consumer and Retail sector. This demonstrates China’s increasing impact on the global market.

  • Tech and Finance

The list has many companies within the Enterprise Tech and Financial Services sectors. This highlights the crucial role of technology and finance in the contemporary business environment.

  • Valuation Variation

The list includes a variety of valuations, with ByteDance leading at $225 billion and OpenAI at $29 billion, highlighting the range of industries and business models.

  • Media & Entertainment

The Media and entertainment industry has witnessed significant valuations for companies like ByteDance and Epic Games. This highlights the lucrative nature and promising future of the sector.

  • Innovation Hubs

Companies such as SpaceX and OpenAI operating within the United States highlight that the U.S. remains a central hub for innovation, particularly in space exploration and artificial intelligence.

  • Retail and E–commerce

The continued growth of online retail and e-commerce businesses is evident through the presence of SHEIN and Fanatics.

  • Financial Technology

The fintech industry is witnessing the rise of prominent players like Stripe, Revolut, and Chime. This highlights the growing significance of digital financial solutions.

  • Unicorn Companies

The fact that these companies are valued in billions of dollars highlights the significant number of unicorn startups in today’s business environment.

  • Global Expansion

Many of these companies possess a global presence, signifying their capacity to expand and seize opportunities in international markets.

Power BI Pro vs Premium: Which One is Perfect For You

Choosing between Power BI Pro and Power BI Premium depends on your needs. Power BI Pro is ideal for individuals and small teams who need to create, share, and collaborate on reports.

In contrast, Power BI Premium is best for large organizations that require dedicated resources, enhanced performance, and broader sharing without per-user licensing. If scalability, AI-powered analytics, and large dataset support are priorities, Premium is the way to go.

Power BI Pro vs Premium – FAQs

What is the difference between Power BI Pro and Premium?

Power BI Pro offers user-based licensing for individuals and small teams with shared resources. Conversely, Power BI Premium uses capacity-based licensing, providing dedicated resources, enhanced performance, and support for large datasets. This makes Power BI Premium suitable for large organizations with advanced analytics needs.

What are the limitations of Power BI Pro?

  1. User-based licensing: Pro licenses are required for report sharing.
  2. Limited capacity: Shared resources may lead to performance issues.
  3. Not suitable for handling large datasets.
  4. Costs add up with increasing user count.
  5. No support for on-premises deployment.

Wrap Up

We’ve concluded the grand showdown of Power BI Pro vs. Power BI Premium. We’ve explored the critical distinctions that can shape your data-driven journey. With its user-based licensing, Power BI Pro caters to smaller teams and individuals, fostering collaboration within budgetary constraints. It’s like a trusty sedan, reliable and cost-effective.

Power BI Premium, the heavyweight champion, embraces capacity-based licensing, delivering unparalleled performance, scalability, and support for vast datasets. It’s your high-performance sports car, built for enterprises with intensive analytics demands and a thirst for power.

Both options uphold the spirit of collaboration, allowing the sharing of insights and collaboration on reports and dashboards. However, Premium takes the lead with enhanced performance and support for paginated reports and embedded analytics.

Choosing between Pro and Premium hinges on your organization’s size, data volume, and budget. Pro serves as the gateway to the world of Power BI. Conversely, Premium unlocks the full potential for data-driven decision-making, especially in large enterprises.

Power BI stands as a beacon in business intelligence, guiding you toward data-driven success. Whether Pro or Premium, the choice is yours, and it’s a journey worth embarking upon.

How much did you enjoy this article?

PBIAd2
Start Free Trial!
130030

Related articles

next previous
Power BI12 min read

Power BI Group By Guide for Effective Data Insights

Learn how Power BI Group By helps you aggregate data, clarify trends, and create reports by grouping values to make large datasets manageable & insightful.

Power BI12 min read

How to Create Sankey Diagram in Microsoft Power BI?

Learn How to Create Sankey Diagram in Microsoft Power BI using Desktop & Web Service. What they are and how to use them effectively.

Power BI8 min read

Power BI Artificial Intelligence: Insights Using Visuals

Discover all there is to know about the Power BI artificial intelligence. You'll also discover how AI is used in Power BI, and how to use it for analysis and more.

Power BI9 min read

Budgeting in Healthcare: Use Visuals to Spot Budget Gaps

This guide helps you discover what budgeting in healthcare is. You'll also discover the factors that affect hospital budgets and types of budgeting in healthcare.

Power BI9 min read

Predictive Analytics in Power BI for Making Insightful Visuals

This guide shows you everything you need to know about Predictive Analytics in Power BI. It also shows you how it works, and how to interpret the results.

ChartExpo logo

Turn Data into Visual
Stories

CHARTEXPO

  • Home
  • Gallery
  • Videos
  • Services
  • Pricing
  • Contact us
  • FAQs
  • Privacy policy
  • Terms of Service
  • Sitemap

TOOLS

  • ChartExpo for Google Sheets
  • ChartExpo for Microsoft Excel
  • Power BI Custom Visuals by ChartExpo
  • Word Cloud

CATEGORIES

  • Bar Charts
  • Circle Graphs
  • Column Charts
  • Combo Charts
  • Comparison Charts
  • Line Graphs
  • PPC Charts
  • Sentiment Analysis Charts
  • Survey Charts

TOP CHARTS

  • Sankey Diagram
  • Likert Scale Chart
  • Comparison Bar Chart
  • Pareto Chart
  • Funnel Chart
  • Gauge Chart
  • Radar Chart
  • Radial Bar Chart
  • Sunburst Chart
  • see more
  • Scatter Plot Chart
  • CSAT Survey Bar Chart
  • CSAT Survey Chart
  • Dot Plot Chart
  • Double Bar Graph
  • Matrix Chart
  • Multi Axis Line Chart
  • Overlapping Bar Chart
  • Control Chart
  • Slope Chart
  • Clustered Bar Chart
  • Clustered Column Chart
  • Box and Whisker Plot
  • Tornado Chart
  • Waterfall Chart
  • Word Cloud
  • see less

RESOURCES

  • Blog
  • Resources
  • YouTube
SIGN UP FOR UPDATES

We wouldn't dream of spamming you or selling your info.

© 2025 ChartExpo, all rights reserved.