• Home
  • Tools dropdown img
    • Spreadsheet Charts

      • ChartExpo for Google Sheets
      • ChartExpo for Microsoft Excel
    • Power BI Charts

      • Power BI Custom Visuals by ChartExpo
    • Word Cloud

  • Charts dropdown img
    • Chart Category

      • Bar Charts
      • Circle Graphs
      • Column Charts
      • Combo Charts
      • Comparison Charts
      • Line Graphs
      • PPC Charts
      • Sentiment Analysis Charts
      • Survey Charts
    • Chart Type

      • Box and Whisker Plot
      • Clustered Bar Chart
      • Clustered Column Chart
      • Comparison Bar Chart
      • Control Chart
      • CSAT Survey Bar Chart
      • CSAT Survey Chart
      • Dot Plot Chart
      • Double Bar Graph
      • Funnel Chart
      • Gauge Chart
      • Likert Scale Chart
      • Matrix Chart
      • Multi Axis Line Chart
      • Overlapping Bar Chart
      • Pareto Chart
      • Radar Chart
      • Radial Bar Chart
      • Sankey Diagram
      • Scatter Plot Chart
      • Slope Chart
      • Sunburst Chart
      • Tornado Chart
      • Waterfall Chart
      • Word Cloud
    • Google Sheets
      Microsoft Excel
  • Services
  • Pricing
  • Contact us
  • Blog
  • Support dropdown img
      • Gallery
      • Videos
      • Contact us
      • FAQs
      • Resources
    • Please feel free to contact us

      atsupport@chartexpo.com

Categories
All Data Visualizations Data Analytics Surveys
Add-ons/
  • Google Sheets
  • Microsoft Excel
  • Power BI
All Data Visualizations Data Analytics Surveys
Add-ons
  • Google Sheets
  • Microsoft Excel
  • Power BI

We use cookies

This website uses cookies to provide better user experience and user's session management.
By continuing visiting this website you consent the use of these cookies.

Ok

ChartExpo Survey


Home > Blog > Power BI

Power BI License Types: Key Differences Explained

Connecting to multiple data sources, and creating interactive reports is possible with Power BI.

Power Bi License Types

However, to get access to all the features that come with the tool, you’ll need to get a Power BI license. In this guide, you’ll discover the various Power BI license types, and why you need a Power BI license.

Table of Contents:

  1. What is a Power BI License?
  2. What are the Different Power BI License Types?
  3. Why do we Need a Power BI License?
  4. How to visualize your data using Power BI?
  5. What are the Considerations and Limitations of Microsoft Power BI License Types?
  6. Wrap Up

First…

What is a Power BI License?

Definition: Power BI licensing is the various plans available for users who desire to use Microsoft Power BI. Power BI is an analytic tool that helps users visualize data, and share insights from it. There are multiple licensing models for Power BI and they involve several tiers to cater to various users, and different levels of functionality.

What are the Different Power BI License Types?

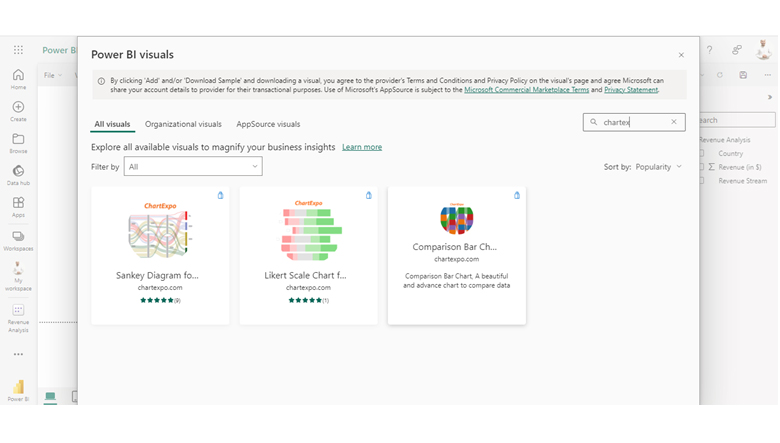
Here are the different Power BI license types.

  1. Power BI Desktop

Power BI Desktop is used for the creation of visualizations and reports. It’s free and doesn’t require a license.

  1. Power BI Pro

Power BI Pro offers access to advanced collaboration, publishing, and sharing features. You’ll need a license to access it and the key features are:

    • Sharing dashboards and reports with multiple users. It does not support external sharing.
  • Workspace collaboration that allows multiple users to work on a project.
  • Scheduled data refresh to keep reports updated.
  • Data capacity is higher than the free version.
  1. Power BI Premium

Power BI Premium is designed for organizations seeking enhanced performance and dedicated resources for their Power BI workloads. Major features are:

  • Premium capacity for scalability, improved performance, and reliability.
  • Designed to support higher refresh rates, frequent data updates, and larger datasets.
  • Good fit for enterprises with huge volumes of large datasets, complex reporting, and Power BI usage.
  1. Power BI Embedded

Power BI Embedded is used for integrating interactive dashboards and Power BI reports into a custom application. It’s a good fit for developers and Independent Software Vendors (ISVs) and it comes with a license.

  1. Power BI Free

Power BI Free comes with basic features and allows users to interact with dashboards and shared reports. Users using Power BI Free cannot share or create their content but they can view the content shared by other users.

Why do we Need a Power BI License?

Here are some reasons why you need a Power BI license.

  1. Access to Advanced Features

The Power BI Desktop (which is free), enables users to create visualizations and reports. However, if you’re looking for advanced features like collaboration with other users, report sharing, and access to premium data connectors, a Power BI Pro license is needed.

  1. Collaboration and Sharing

Power BI Pro helps users share their dashboards and reports with other users who are outside and within their organization. This helps stakeholders get access to insights from the data, and it also helps in making collaborative decisions.

  1. Scheduled Updates and Data Refresh

Users with a Power BI Pro license can schedule data refresh for their report. This will help ascertain that their visualizations are regularly updated. This feature helps in maintaining the relevance and accuracy of reports.

  1. Support and Compliance

Using the Power BI licensed version enables organizations to comply with Microsoft’s data protection regulations. It also helps you to benefit from the official updates and support of Microsoft.

  1. Security and Governance

Power BI license helps users to align with the security policies. Users with the Power BI license get to control access to the datasets and reports, and track activities and usage within Power BI.

How to Visualize Your Data Using Power BI?

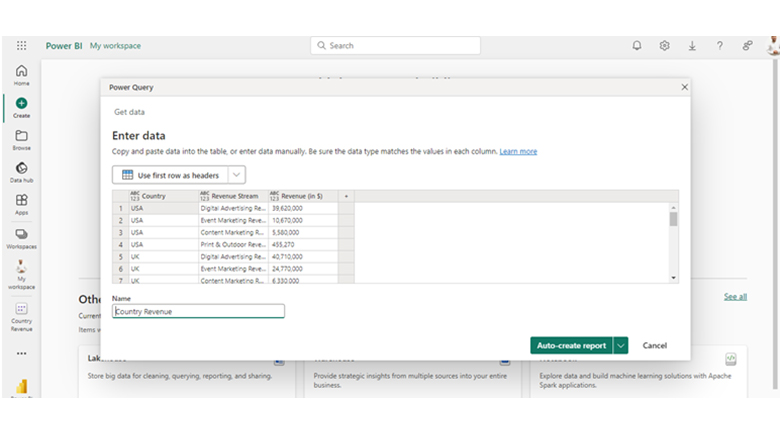
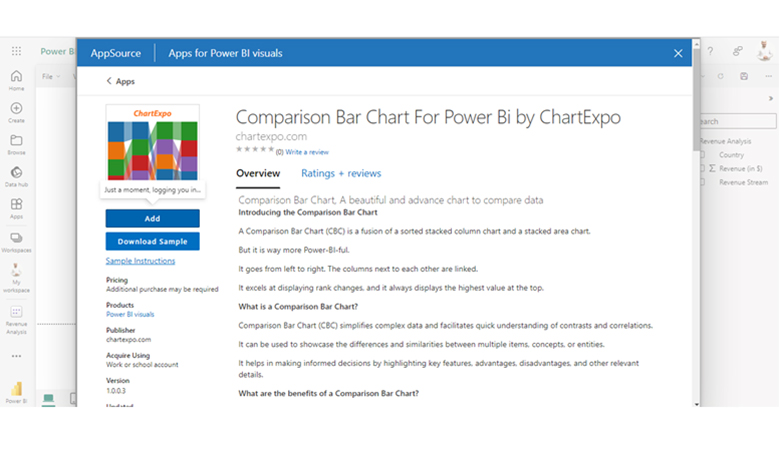
Stage 1: Logging in to Power BI

  • Log in to Power BI.
  • Enter your email address and click the “Submit” button.
Enter email to login to Power BI
  • You are redirected to your Microsoft account.
  • Enter your password and click “Sign in“.
Enter Password to login to Power BI
  • You can choose whether to stay signed in.
Click on stay signed in
  • Once done, the Power BI home screen will open.

Stage 2: Creating a Data Set and Selecting the Data Set to Use in Your Chart

  • Go to the left-side menu and click the “Create” button.
  • Select “Paste or manually enter data“.
select Paste or manually enter data in Power BI ce487
  • We’ll use the sample data below for this example.
Country Revenue Stream Revenue  (in $)
USA Digital Advertising Revenue           39,620,000
USA Event Marketing Revenue           10,670,000
USA Content Marketing Revenue             5,580,000
USA Print & Outdoor Revenue                 455,270
UK Digital Advertising Revenue           40,710,000
UK Event Marketing Revenue           24,770,000
UK Content Marketing Revenue             6,330,000
UK Print & Outdoor Revenue                 552,190
DNK Digital Advertising Revenue           47,040,000
DNK Event Marketing Revenue           29,070,000
DNK Content Marketing Revenue             7,740,000
DNK Print & Outdoor Revenue                 600,690
DNK Media Relations Revenue                 106,430
AUS Digital Advertising Revenue           53,790,000
AUS Event Marketing Revenue           38,530,000
AUS Content Marketing Revenue             6,590,000
AUS Print & Outdoor Revenue             9,040,000
AUS Media Relations Revenue             6,130,000
FR Digital Advertising Revenue           57,860,000
FR Event Marketing Revenue           50,450,000
FR Content Marketing Revenue             3,560,000
FR Print & Outdoor Revenue           18,790,000
FR Media Relations Revenue           15,460,000
IND Digital Advertising Revenue           60,470,000
IND Event Marketing Revenue           63,200,000
IND Content Marketing Revenue             2,080,000
IND Print & Outdoor Revenue           29,500,000
IND Media Relations Revenue           30,020,000
  • Paste the above data table in the Power Query Window.
  • Select the “Create a dataset only” option.
Click Create a Dataset Only After Getting Any Power Bi License Types
  • To see the chart metrics, click Expand All. The dimensions and metrics will be displayed for you.
Click Create Report After Getting Any Power Bi License Types
  • Click Get more visuals Using the search box, search ChartExpo and choose the Comparison Bar Chart.
Click Expand All After Getting Any Power Bi License Types
  • Click “Add.”
Comparison Bar Chart Page After Getting Any Power Bi License Types
  • The Comparison Bar Chart will be displayed in the visuals list.
Click Add Button After Getting Any Power Bi License Types
  • Click on the License Settings and add your key. After that, the comparison bar chart will be displayed on the screen.
Get Comparison Bar Chart Icon After Getting Any Power Bi License Types
  • Here’s what the Comparison Bar Chart in Power BI looks like.
Final Power Bi License Types

Insights

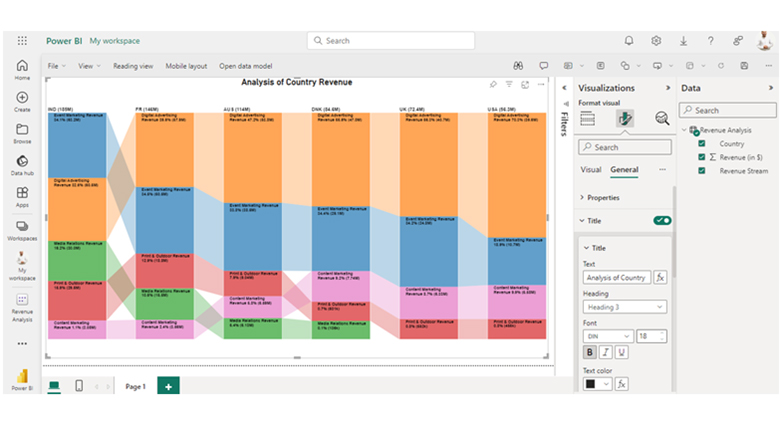
Here are some insights you can gain from the chart.

  • The country with the highest total revenue is India and they’re followed by France, Australia, and Denmark.
  • “Digital Advertising” is a major revenue contributor in most countries. However, “Event Marketing’ is leading in India.
  • There is no “Media Relations” revenue stream in the US and UK.

What are the Considerations and Limitations of Microsoft Power BI License Types?

Here are the major considerations and limitations that come with the various Power BI license types.

Power BI Pro:

Considerations:

  • Users can share their dashboards and reports with people within and outside the organization and that facilitates a collaborative decision-making process.
  • Built with advanced features like AI capabilities, and data connectivity options.

Limitations:

  • Users need a Pro license before they can access it.

Power BI Premium:

Considerations:

  • Supports the distribution of Power BI content across a broad range of audiences. The recipient doesn’t need a Pro license before accessing the Power BI content.
  • Offers dedicated resources for scalability, reliability, and performance of Power BI workload.

Limitations:

  • Pricing is dependent on the capacity tier and that may be somewhat expensive for small organizations.

Power BI Embedded:

Considerations:

  • Supports the integration of Power BI dashboards and reports into custom portals and applications.
  • The licensing is dependent on the usage metrics (like dataset refresh and render) and not on the individual user counts.

Limitations:

  • Skilled personnel and development resources are needed before you can embed the Power BI capabilities within the custom applications.

Advantages of Power BI Pro:

  • It supports the sharing of dashboards, reports, and datasets with stakeholders.
  • Comes with a high refresh rate, and an expanded storage capacity.
  • Enables analysts and users to create, share, and publish interactive dashboards and reports.
  • Provides access to a variety of advanced analytics capabilities and data connectors like natural language queries (Q&A), automated machine learning (AutoML), and artificial intelligence (AI).

Advantages of Power BI Premium:

  • Offers dedicated resources for scalability, and improved performance. This ensures consistent responsiveness during peak usage.
  • Supports the distribution of dashboards and reports to a broad audience who don’t have a Pro license.
  • Comes with Power BI Report Server for on-premises deployment and hosting. It’s a good fit for organizations with compliance or data security requirements.

Advantages of Power BI Embedded:

  • Allows developers to embed interactive dashboards and reports directly into custom portals and applications.
  • The licensing is dependent on the usage metrics, and users can optimize costs based on application scale and usage.
  • It scales with application demands and usage, and it also supports scalable and responsive analytics capabilities.

FAQs

What is the difference between Power BI Pro and Premium License?

Power BI Pro supports collaboration and sharing features. Power BI Premium comes with dedicated capacity, on-premises deployment, and content distribution, and it’s a good fit for large organizations.

What license is needed for Power BI?

A Power BI Pro license is needed for unlocking features collaboration, sharing, and other advanced features. Power BI Premium comes with dedicated resources and it’s a good fit for large-scale deployments.

Is Power BI included in an E3 license?

Yes, Power BI is included in the Microsoft 365 E3 licenses.

Wrap Up

Power BI license grants you access to one of the most powerful business analytics tools in the world. With the right Power BI license type, you’ll have access to collaboration, sharing, dedicated resources, and advanced features. The various Power BI license types are:

  • Power BI Pro (for individuals)
  • Power BI Premium (for organizations)
  • Power BI Embedded (for app integration).

The Power BI Pro enables you to share dashboards and reports with other stakeholders and it helps you to collaborate in the decision-making process. Power BI Premium supports content distribution, and it comes with dedicated resources.

Power BI Embedded is the best fit for developers, and it helps them embed interactive dashboards and reports directly into a custom portal and application.

By following the steps outlined in this guide, you’ll be able to create a compelling visualization in Power BI.

Now you know the various Power BI License types, which is your preferred choice, and why?

How much did you enjoy this article?

PBIAd1
Start Free Trial!
136489

Related articles

next previous
Power BI12 min read

Power BI Group By Guide for Effective Data Insights

Learn how Power BI Group By helps you aggregate data, clarify trends, and create reports by grouping values to make large datasets manageable & insightful.

Power BI12 min read

How to Create Sankey Diagram in Microsoft Power BI?

Learn How to Create Sankey Diagram in Microsoft Power BI using Desktop & Web Service. What they are and how to use them effectively.

Power BI8 min read

Power BI Artificial Intelligence: Insights Using Visuals

Discover all there is to know about the Power BI artificial intelligence. You'll also discover how AI is used in Power BI, and how to use it for analysis and more.

Power BI9 min read

Budgeting in Healthcare: Use Visuals to Spot Budget Gaps

This guide helps you discover what budgeting in healthcare is. You'll also discover the factors that affect hospital budgets and types of budgeting in healthcare.

Power BI9 min read

Predictive Analytics in Power BI for Making Insightful Visuals

This guide shows you everything you need to know about Predictive Analytics in Power BI. It also shows you how it works, and how to interpret the results.

ChartExpo logo

Turn Data into Visual
Stories

CHARTEXPO

  • Home
  • Gallery
  • Videos
  • Services
  • Pricing
  • Contact us
  • FAQs
  • Privacy policy
  • Terms of Service
  • Sitemap

TOOLS

  • ChartExpo for Google Sheets
  • ChartExpo for Microsoft Excel
  • Power BI Custom Visuals by ChartExpo
  • Word Cloud

CATEGORIES

  • Bar Charts
  • Circle Graphs
  • Column Charts
  • Combo Charts
  • Comparison Charts
  • Line Graphs
  • PPC Charts
  • Sentiment Analysis Charts
  • Survey Charts

TOP CHARTS

  • Sankey Diagram
  • Likert Scale Chart
  • Comparison Bar Chart
  • Pareto Chart
  • Funnel Chart
  • Gauge Chart
  • Radar Chart
  • Radial Bar Chart
  • Sunburst Chart
  • see more
  • Scatter Plot Chart
  • CSAT Survey Bar Chart
  • CSAT Survey Chart
  • Dot Plot Chart
  • Double Bar Graph
  • Matrix Chart
  • Multi Axis Line Chart
  • Overlapping Bar Chart
  • Control Chart
  • Slope Chart
  • Clustered Bar Chart
  • Clustered Column Chart
  • Box and Whisker Plot
  • Tornado Chart
  • Waterfall Chart
  • Word Cloud
  • see less

RESOURCES

  • Blog
  • Resources
  • YouTube
SIGN UP FOR UPDATES

We wouldn't dream of spamming you or selling your info.

© 2025 ChartExpo, all rights reserved.