• Home
  • Tools dropdown img
    • Spreadsheet Charts

      • ChartExpo for Google Sheets
      • ChartExpo for Microsoft Excel
    • Power BI Charts

      • Power BI Custom Visuals by ChartExpo
    • Word Cloud

  • Charts dropdown img
    • Chart Category

      • Bar Charts
      • Circle Graphs
      • Column Charts
      • Combo Charts
      • Comparison Charts
      • Line Graphs
      • PPC Charts
      • Sentiment Analysis Charts
      • Survey Charts
    • Chart Type

      • Box and Whisker Plot
      • Clustered Bar Chart
      • Clustered Column Chart
      • Comparison Bar Chart
      • Control Chart
      • CSAT Survey Bar Chart
      • CSAT Survey Chart
      • Dot Plot Chart
      • Double Bar Graph
      • Funnel Chart
      • Gauge Chart
      • Likert Scale Chart
      • Matrix Chart
      • Multi Axis Line Chart
      • Overlapping Bar Chart
      • Pareto Chart
      • Radar Chart
      • Radial Bar Chart
      • Sankey Diagram
      • Scatter Plot Chart
      • Slope Chart
      • Sunburst Chart
      • Tornado Chart
      • Waterfall Chart
      • Word Cloud
    • Google Sheets
      Microsoft Excel
  • Services
  • Pricing
  • Contact us
  • Blog
  • Support dropdown img
      • Gallery
      • Videos
      • Contact us
      • FAQs
      • Resources
    • Please feel free to contact us

      atsupport@chartexpo.com

Categories
All Data Visualizations Data Analytics Surveys
Add-ons/
  • Google Sheets
  • Microsoft Excel
  • Power BI
All Data Visualizations Data Analytics Surveys
Add-ons
  • Google Sheets
  • Microsoft Excel
  • Power BI

We use cookies

This website uses cookies to provide better user experience and user's session management.
By continuing visiting this website you consent the use of these cookies.

Ok

ChartExpo Survey


Home > Blog > Power BI

How and When to Use CONTAINS function (DAX)?

Have you ever heard of the CONTAINS DAX function?

It’s the sneaky little wizard hidden within Power BI that can work wonders with your data.

You might think it’s just another function, but oh, it’s so much more. The CONTAINS DAX function is like that secret spice that takes your data recipes from bland to grand.

contains DAX

So, why all the fuss about DAX CONTAINS?

The CONTAINS DAX function is a game-changer. It allows you to check for the presence of a substring within a string. For instance, you can use CONTAINS DAX to search for specific keywords within a text field. Moreover, you can use it to identify and categorize customer feedback, unlocking valuable customer sentiment insights.

This function opens up a world of possibilities for data manipulation and analysis. Its ability to handle complex filtering conditions makes it an indispensable asset for anyone working with large datasets.

In this blog post, we’ll uncover why CONTAINS DAX is the unsung hero of data analysis. We’ll explore its significance and how it revolutionizes data analysis in Power BI. By the end, you’ll wield the power of data like a seasoned pro, conjuring insights with a click.

Table of Content:

  1. Define Contains DAX Function
  2. What is the Purpose of Using the CONTAINS DAX Function?
  3. Why Power BI CONTAINS DAX Function is Important?
  4. Contains DAX Function: Step-by-Step Implantation for Data Evaluation
  5. Creating Engaging Data Narratives in Power BI
  6. Wrap Up

Define Contains DAX Function

Definition: The CONTAINS DAX function is a robust tool in Power BI tailored for data manipulation and analysis. It functions like a virtual detective, meticulously scanning text fields to pinpoint particular substrings or patterns. This function yields a Boolean result, signaling whether the designated substring is present within the text.

Here’s the basic syntax: CONTAINS( Table, Column, SearchValue )

Whether you’re hunting for keywords, exploring patterns, or conducting targeted searches, the CONTAINS DAX function stands as your analytical ally. In scenarios demanding a focused lens on data scrutiny, it proves invaluable, enabling efficient extraction of relevant information.

The precision and flexibility of CONTAINS DAX make it a key player in the data analyst’s toolkit, unlocking myriad possibilities for dissecting and interpreting textual information with finesse.

What is the Purpose of Using the CONTAINS DAX Function?

Let’s unravel the purpose behind wielding the CONTAINS DAX function. This function serves as a strategic instrument for navigating the labyrinth of data.

  1. Substring detection: The primary purpose of the CONTAINS DAX function is substring detection. It acts as a virtual Sherlock Holmes, scrutinizing text fields to ascertain the existence of specific substrings. This capability is invaluable when seeking elusive patterns, keywords, or unique identifiers within a sea of data.
  2. Filtering and matching: Think of CONTAINS DAX as a sophisticated filter, allowing you to sift through vast datasets with surgical precision. It enables the isolation of records that contain the desired substring. Consequently, it streamlines the analytical process and facilitates targeted exploration of relevant information.
  3. Precision in data analysis: Precision is the cornerstone of effective data visualization. You can extract what you need using CONTAINS DAX, avoiding the noise and zeroing in on the crucial details. This function enhances the accuracy of insights, ensuring decisions are based on a refined understanding of data in Power BI For Mac.
  4. Conditional logic: CONTAINS DAX introduces a layer of conditional logic into the analytical toolkit. Its ability to return true or false values based on substring presence allows for creating dynamic, logic-driven analyses. This conditional power adds flexibility to data exploration and supports the development of nuanced business intelligence solutions.

Why Power BI CONTAINS DAX Function is Important?

Here are the reasons why the Power BI CONTAINS DAX function is a linchpin in business intelligence.

  • Flexible filtering: The CONTAINS DAX function and Format Dax in Power BI empowers you with flexible filtering capabilities. It acts as a dynamic gatekeeper, allowing you to extract specific data points containing the desired substring. This flexibility enhances precision in analysis, ensuring that only relevant information is brought to the forefront.
  • Substring matching: At its core, CONTAINS DAX specializes in substring matching. It transforms the search for specific patterns or keywords within text fields into a streamlined process. This capability is invaluable for analysts seeking to unravel intricate details within expansive datasets.
  • Advanced conditional logic: CONTAINS DAX in Power BI advanced conditional logic into the analytical toolkit. It facilitates the creation of intricate logic-driven analyses by providing a true or false output based on substring presence. This nuanced approach supports complex decision-making processes.
  • Improved data visualization: Effective data visualization hinges on accurate and relevant information. The CONTAINS DAX function contributes to this by allowing you to filter and visualize data precisely. It enhances the clarity of visual representations, making reports and dashboards more insightful and actionable.
  • Enhanced data exploration: When navigating vast datasets, the CONTAINS DAX function acts as a compass, guiding you to the information you seek. This enables you to delve deeper into specific aspects without getting lost in the data wilderness.
  • Efficient data manipulation: Efficiency is paramount in data manipulation, and CONTAINS DAX is a time-saving ally. Whether extracting specific subsets of data or conducting targeted analyses, this function streamlines the process. Consequently, it allows for more efficient data manipulation and extraction of meaningful insights.

Contains DAX Function: Step-by-Step Implantation for Data Evaluation

Here is the CONTAINS DAX function syntax breakdown:

CONTAINS(<table>, <column>, <value>)

  • <table>: Refers to the table or table expression you want to search.
  • <column>: Denotes the column within the specified table where you want to search for the specified value.
  • <value>: Represents the value you are searching for within the specified column.

The function yields a TRUE result when the specified value is located in the designated column of the table. Otherwise, it returns FALSE.

Example:

The following dataset contains two columns: category and sub-category.

contains DAX 1

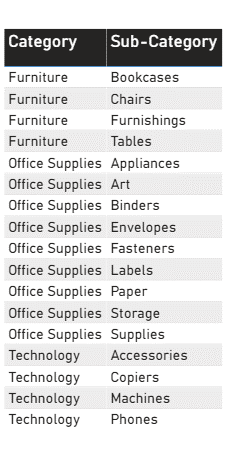
Suppose you want to check if the value “Office Supplies” exists in the Category column:

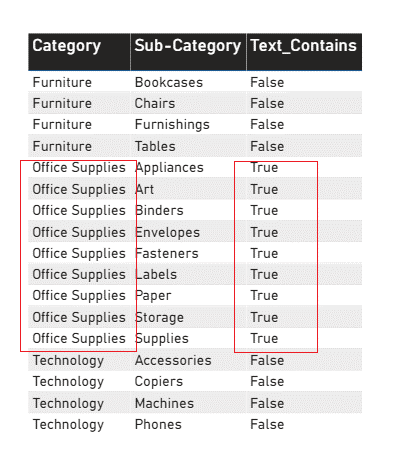
Text_Contains =CONTAINS (‘Global-Superstore’,’Global-Superstore'[Category], “Office Supplies”)

After committing the DAX, let’s drag the measure into the table visual next to the Sub-category column.

As you can see, the CONTAINS function evaluates values in each category row. It returns True if the category contains “Office Supplies.” And if the category lacks the value, it returns False.

contains DAX 2

Creating Engaging Data Narratives in Power BI

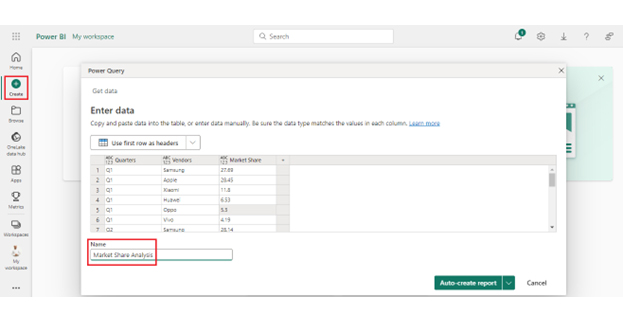
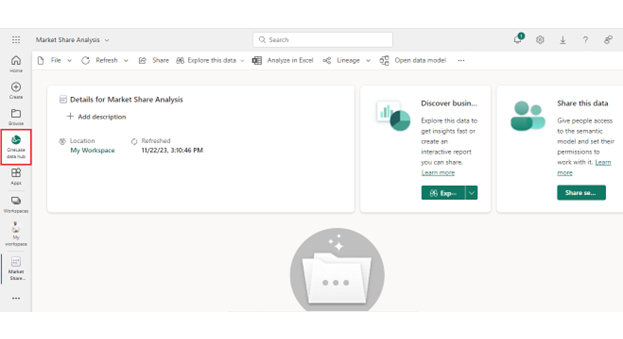
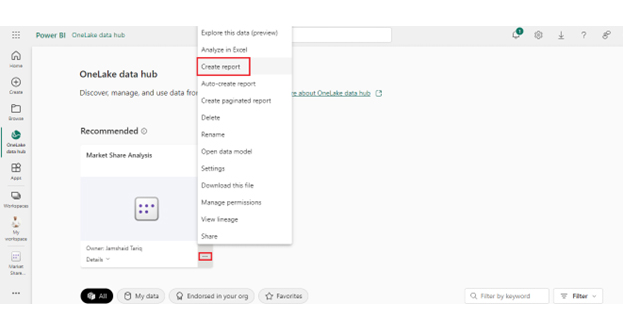
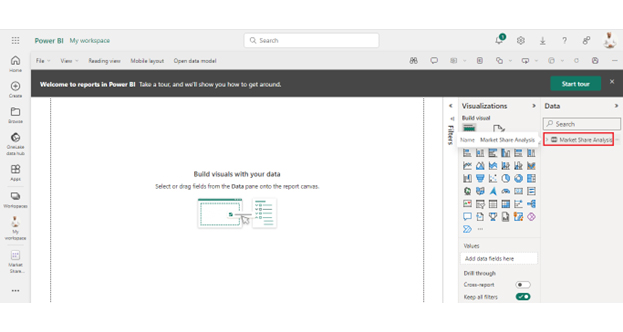
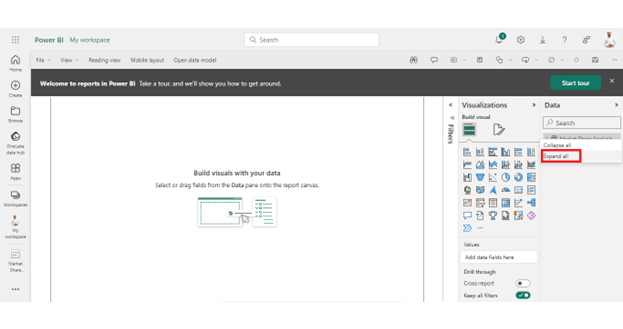
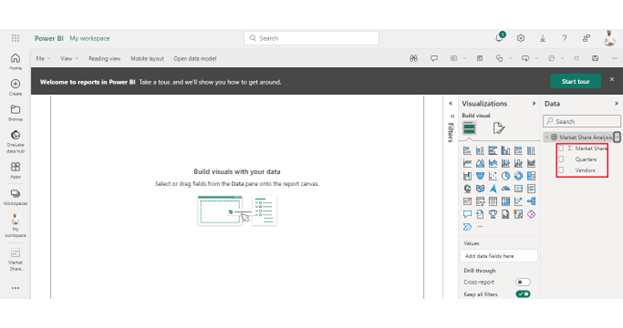
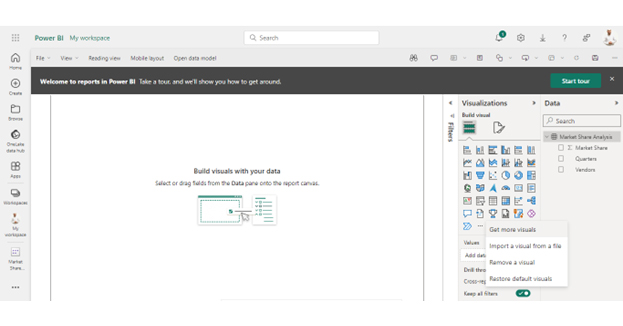
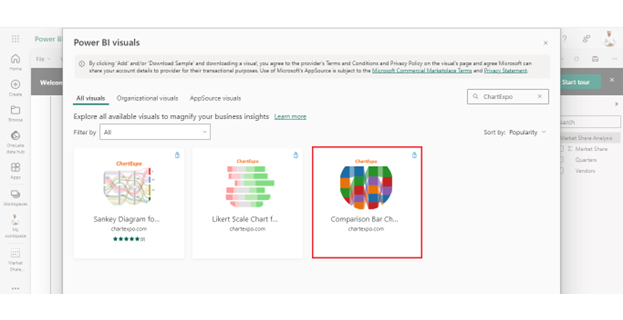
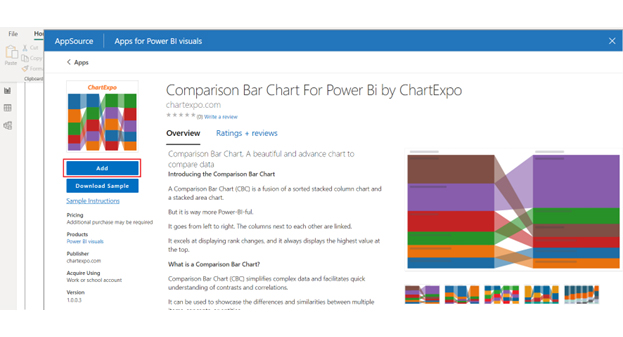
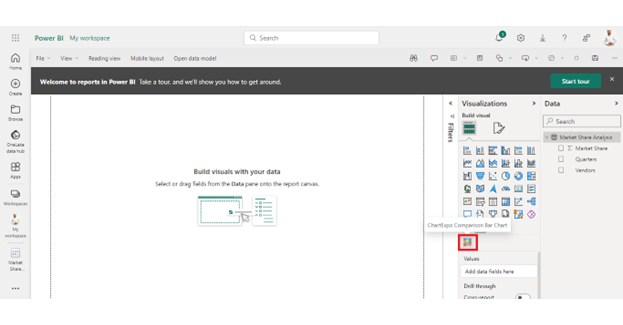
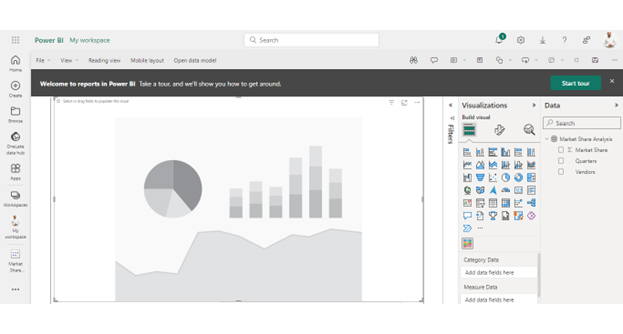
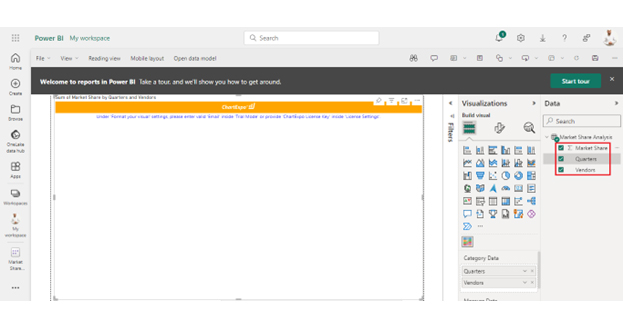
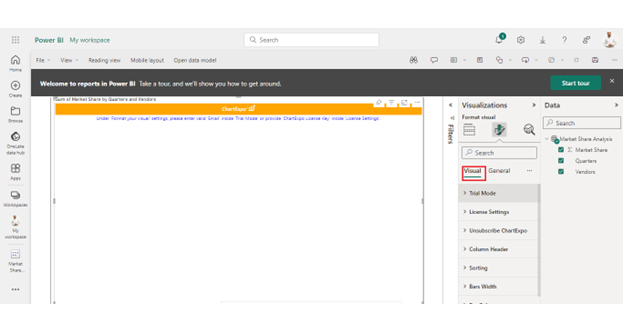
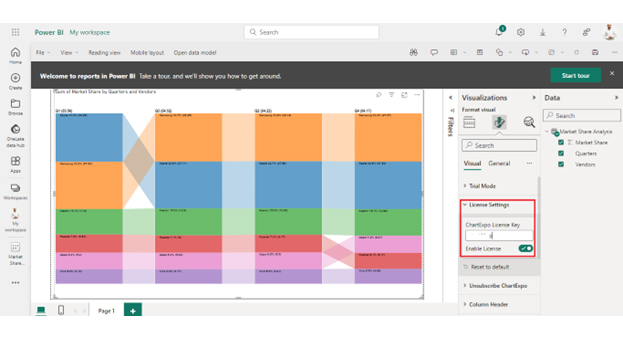
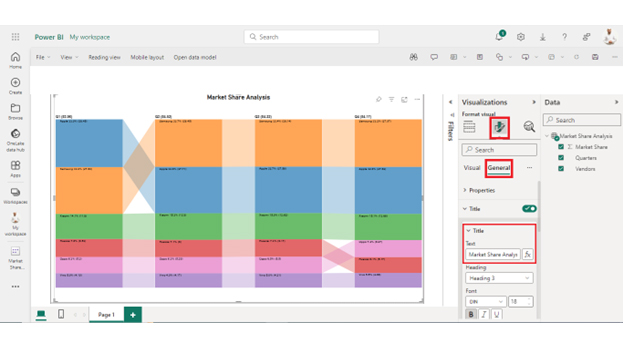
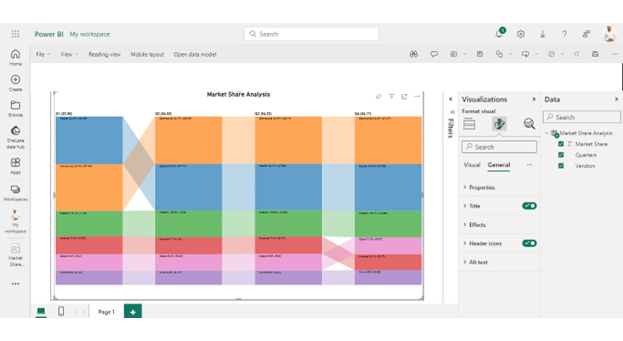
We’ve learned how to use CONTAINS in Power BI. Follow these steps to harness the robust features of Power BI with Sankey Diagram for effective data visualization.

Stage 1: Logging in to Power BI

  1. Log in to Power BI.
  2. Enter your email address and click the “Submit” button.
Enter email to login to Power BI
  • You are redirected to your Microsoft account.
  • Enter your password and click “Sign in“.
Enter Password to login to Power BI
  • You can choose whether to stay signed in.
Click on stay signed in
  • Once done, the Power BI home screen will open.

Stage 2: Creating a Data Set and Selecting the Data Set to Use in Your Chart

  • Go to the left-side menu and click the “Create” button.
  • Select “Paste or manually enter data“.
select Paste or manually enter data in Power BI ce487
  • We’ll use the sample data below for this example.
Quarters Vendors Market Share
Q1 Samsung 27.69
Q1 Apple 28.45
Q1 Xiaomi 11.8
Q1 Huawei 6.53
Q1 Oppo 5.3
Q1 Vivo 4.19
Q2 Samsung 28.14
Q2 Apple 27.58
Q2 Xiaomi 12.62
Q2 Huawei 6.17
Q2 Oppo 5.5
Q2 Vivo 4.21
Q3 Samsung 28.45
Q3 Apple 27.71
Q3 Xiaomi 12.9
Q3 Huawei 6
Q3 Oppo 5.29
Q3 Vivo 4.17
Q4 Samsung 27.97
Q4 Apple 27.62
Q4 Xiaomi 12.68
Q4 Huawei 5.17
Q4 Oppo 6.07
Q4 Vivo 4.66
  • Paste the above data table in the Power Query Window.
  • Select the “Create a dataset only” option.
Create a dataset ce508
  • On the left-side menu, click “Data Hub“.
  • Power BI populates the data set list. (If you have not created a data set, refer to the Error! Reference source not found section).
Click on Data Hub ce508
  • Click on the “Create a report” dropdown.
Create a report ce508
  • Click on Market Share Analysis:
Click on Market Share Analysis ce508
  • Click the “Expand All” button.
Click Expand All ce508
  • You can see your chart metrics:
chart metrics ce508
  • Click on “Get more visuals“.
click on to get more visuals ce508
  • Search for ChartExpo and select the Comparison Bar Chart:
Comparison Bar CHart for Power BI by ChartExpo ce487
  • Click the “Add” button.
Click the Add button ce518
  • You can now see the Comparison Bar Chart in the visualizations list.
Chart in the visualizations list ce508
  • Expand your chart space.
Expand your chart space ce508
  • Select the metrics of your data:
Select the metrics ce508
  • Click the second icon of Format Visuals and click on Visual:
click on Visual ce508
  • In Visual, click License Settings, add the key, and enable the license.
  • After adding the key, you can see the comparison bar chart.
click License Settings ce508
  • Click the General tab to add the header text.
add the header text ce508
  • The final Comparison Bar Chart in Power BI will appear as below.
Final DAX COUNTIF

Insights

  • Samsung leads in market share, securing the top spot, while Apple follows closely in second place.
  • Xiaomi is on the rise, capturing more market share, while Huawei is experiencing a decline.
  • Oppo and Vivo have maintained a steady market share.
  • Notably, there has been a shift between Huawei and Oppo in the last quarter.

FAQs

Is there a CONTAINS function in DAX?

Yes, there is a CONTAINS function in DAX. It is used for substring detection in text fields. The function returns true if a specified substring is found within a given text and false otherwise. It is a valuable tool for data analysis in Power BI and other DAX-supported platforms.

What is the CONTAINS condition in DAX?

In DAX, the CONTAINS condition is used for substring detection in text fields. It checks if a specified substring is present within a given text. If the substring is found, the condition evaluates to true; otherwise, it evaluates to false.

Why is the CONTAINS function important?

The CONTAINS function is crucial for data analysis in DAX. It enables substring detection, allowing precise filtering and matching. This function is pivotal in enhancing data exploration, improving visualization, and implementing advanced conditional logic. This makes it indispensable for extracting meaningful insights from complex datasets.

Wrap Up

The significance of the Power BI CONTAINS DAX function in data analysis is unmistakably paramount. It stands as a linchpin, orchestrating a symphony of precision and efficiency in the analytical realm. This function’s importance extends beyond its seemingly straightforward syntax, transcending into the core of data manipulation and interpretation.

First, the CONTAINS DAX function bestows upon analysts the power of flexible filtering. It allows the extraction of specific data points containing desired substrings. This transforms data exploration into a targeted and streamlined process.

Furthermore, its prowess in substring matching cannot be overstated. It is a digital detective, meticulously searching for patterns and keywords within text fields. Consequently, it unveils critical information that might otherwise remain concealed.

The introduction of advanced conditional logic is another feather in the CONTAINS DAX function’s cap. It can return true or false values based on substring presence. This facilitates the creation of dynamic analyses, adding a layer of sophistication to decision-making processes.

Additionally, the function enhances data exploration by efficiently guiding you to the information you seek. This allows for a deeper understanding of specific aspects without getting lost in the vast sea of data.

Lastly, CONTAINS DAX contributes to efficient data manipulation, saving time and effort in extracting meaningful insights. Whether isolating data subsets or conducting targeted analyses, the function streamlines the process. This allows you to focus on deriving actionable intelligence.

How much did you enjoy this article?

PBIAd2
Start Free Trial!
133963

Related articles

next previous
Power BI13 min read

Date Hierarchy in Power BI: Ultimate Guide for Users

Enhance your analysis with Date Hierarchy in Power BI. Discover the steps to create, customize, & utilize hierarchies effectively for more insight and reporting.

Power BI12 min read

How to Create a Dashboard in Power BI?

Uncover the secrets through the steps for how to create a dashboard in Power BI. Harness the power of Microsoft's business intelligence platform.

Power BI12 min read

Power BI Sales Dashboard for Actionable Insights

Boost your sales analysis with Power BI. Discover the benefits of a Power BI sales dashboard and learn how to create one with this step-by-step guide.

Power BI12 min read

Healthcare Dashboard Examples for Better Patient Insights

Immerse yourself in Healthcare Dashboard Examples, illustrating innovative ways to transform complex data into actionable insights for healthcare professionals.

Power BI12 min read

Power BI Group By Guide for Effective Data Insights

Learn how Power BI Group By helps you aggregate data, clarify trends, and create reports by grouping values to make large datasets manageable & insightful.

ChartExpo logo

Turn Data into Visual
Stories

CHARTEXPO

  • Home
  • Gallery
  • Videos
  • Services
  • Pricing
  • Contact us
  • FAQs
  • Privacy policy
  • Terms of Service
  • Sitemap

TOOLS

  • ChartExpo for Google Sheets
  • ChartExpo for Microsoft Excel
  • Power BI Custom Visuals by ChartExpo
  • Word Cloud

CATEGORIES

  • Bar Charts
  • Circle Graphs
  • Column Charts
  • Combo Charts
  • Comparison Charts
  • Line Graphs
  • PPC Charts
  • Sentiment Analysis Charts
  • Survey Charts

TOP CHARTS

  • Sankey Diagram
  • Likert Scale Chart
  • Comparison Bar Chart
  • Pareto Chart
  • Funnel Chart
  • Gauge Chart
  • Radar Chart
  • Radial Bar Chart
  • Sunburst Chart
  • see more
  • Scatter Plot Chart
  • CSAT Survey Bar Chart
  • CSAT Survey Chart
  • Dot Plot Chart
  • Double Bar Graph
  • Matrix Chart
  • Multi Axis Line Chart
  • Overlapping Bar Chart
  • Control Chart
  • Slope Chart
  • Clustered Bar Chart
  • Clustered Column Chart
  • Box and Whisker Plot
  • Tornado Chart
  • Waterfall Chart
  • Word Cloud
  • see less

RESOURCES

  • Blog
  • Resources
  • YouTube
SIGN UP FOR UPDATES

We wouldn't dream of spamming you or selling your info.

© 2025 ChartExpo, all rights reserved.