• Home
  • Tools dropdown img
    • Spreadsheet Charts

      • ChartExpo for Google Sheets
      • ChartExpo for Microsoft Excel
    • Power BI Charts

      • Power BI Custom Visuals by ChartExpo
    • Word Cloud

  • Charts dropdown img
    • Chart Category

      • Bar Charts
      • Circle Graphs
      • Column Charts
      • Combo Charts
      • Comparison Charts
      • Line Graphs
      • PPC Charts
      • Sentiment Analysis Charts
      • Survey Charts
    • Chart Type

      • Box and Whisker Plot
      • Clustered Bar Chart
      • Clustered Column Chart
      • Comparison Bar Chart
      • Control Chart
      • CSAT Survey Bar Chart
      • CSAT Survey Chart
      • Dot Plot Chart
      • Double Bar Graph
      • Funnel Chart
      • Gauge Chart
      • Likert Scale Chart
      • Matrix Chart
      • Multi Axis Line Chart
      • Overlapping Bar Chart
      • Pareto Chart
      • Radar Chart
      • Radial Bar Chart
      • Sankey Diagram
      • Scatter Plot Chart
      • Slope Chart
      • Sunburst Chart
      • Tornado Chart
      • Waterfall Chart
      • Word Cloud
    • Google Sheets
      Microsoft Excel
  • Services
  • Pricing
  • Contact us
  • Blog
  • Support dropdown img
      • Gallery
      • Videos
      • Contact us
      • FAQs
      • Resources
    • Please feel free to contact us

      atsupport@chartexpo.com

Categories
All Data Visualizations Data Analytics Surveys
Add-ons/
  • Google Sheets
  • Microsoft Excel
  • Power BI
All Data Visualizations Data Analytics Surveys
Add-ons
  • Google Sheets
  • Microsoft Excel
  • Power BI

We use cookies

This website uses cookies to provide better user experience and user's session management.
By continuing visiting this website you consent the use of these cookies.

Ok

ChartExpo Survey


Home > Blog > Microsoft Excel

15 Financial Charts Every Business Should Use

Financial data is essential for decision-making, but raw numbers alone can be difficult to interpret. When data is buried in spreadsheets, spotting trends, tracking performance, and identifying opportunities becomes time-consuming.

financial charts in excel

Financial charts solve this problem by turning complex data into clear, visual insights. They help businesses quickly understand performance, compare results, and make smarter, data-driven decisions.

Table of Content:

  1. What are Financial Charts?
  2. Why Are Finance Charts Important for Businesses?
  3. When Should You Use Financial Charts?
  4. Key Components of Financial Diagrams Explained
  5. 15 Powerful Financial Charts Examples (With Use Cases)
  6. How Financial Graphs Help Businesses Make Better Decisions
  7. Step-by-Step: How to Create Financial Charts in Excel
  8. Best Practices for Creating Effective Financial Charts
  9. How to Choose the Right Financial Charts?
  10. FAQs
  11. Wrap Up

What are Financial Charts?

Definition: Financial charts are visual representations of financial data, including revenue, expenses, profits, investments, and overall financial performance.

They help businesses quickly analyze trends, compare values, and track financial movement over time.

By converting raw numbers into clear visuals, financial insights make reporting easier and highlight patterns and relationships that might be missed in spreadsheets.

They are widely used for:

  • Financial analysis
  • Budget planning
  • Profit and loss reporting
  • Forecasting and projections
  • Executive dashboards
  • Investment evaluation

With financial visuals, analysts can understand performance at a glance, identify trends, and make data-driven decisions without manually scanning rows of numbers.

Why Are Finance Charts Important for Businesses?

  • Improved Decision-Making

Charts allow executives and analysts to visualize performance, spot opportunities, and detect risks quickly. By highlighting growth trends, cost impacts, and profitability patterns, finance charts help make faster, data-driven decisions.

  • Identify Trends and Patterns

Organizations can track:

  • Seasonal revenue shifts
  • Expense fluctuations
  • Periods of growth or decline

Visualizing these trends uncovers patterns that remain hidden in raw spreadsheets, enabling proactive planning.

  • Enhanced Communication

Financial data often needs to be shared with non-finance stakeholders. Charts convert complex figures into clear, easy-to-understand visuals, making reports, data presentations, and meetings more effective.

  • Strategic Planning

Visual charts support forecasting, scenario analysis, and evaluating market behavior. They also help detect unusual spending or anomalies early, allowing timely corrective actions.

  • Goal Tracking and Monitoring

Businesses and individuals use finance charts to track budgets, savings targets, and operational performance. Clear visual monitoring enhances accountability and encourages proactive management.

When Should You Use Financial Charts?

You should use financial charts whenever your data becomes difficult to understand in tables, and you need quick, clear insights.

  • Track trends over time, such as revenue, expenses, or profit growth
  • Compare performance across products, departments, or regions
  • Simplify complex financial data for faster understanding
  • Present insights clearly to stakeholders or non-technical audiences
  • Identify issues like rising costs or declining profits early
  • Analyze past performance to plan future strategies

Key Components of Financial Diagrams Explained

Understanding the key components of a financial diagram is essential for creating visuals that clearly communicate insights. Each element plays a critical role in helping viewers interpret financial data accurately.

  • Data Series

These are the financial values being analyzed, such as revenue, expenses, profits, or operating costs. Properly organized data series allow for meaningful comparisons and trend analysis.

  • Axes

The horizontal axis usually represents time periods (days, months, quarters, or years) or categories, while the vertical axis shows financial values. Clear axes make trends and patterns easy to spot.

  • Labels and Titles

Chart titles, axis labels, and data labels provide context, ensuring viewers immediately understand what the chart represents. Descriptive titles improve readability and help with SEO.

  • Legends

Legends distinguish multiple datasets, making it easier to differentiate revenue, costs, or profit margins within the same chart.

  • Gridlines

Gridlines improve visual accuracy, helping readers compare values across periods or categories without confusion.

15 Powerful Financial Charts Examples (With Use Cases)

Different financial scenarios require different types of charts. Below are some of the most effective financial charts used in business analysis, along with practical use cases.

  • Stacked Waterfall Chart

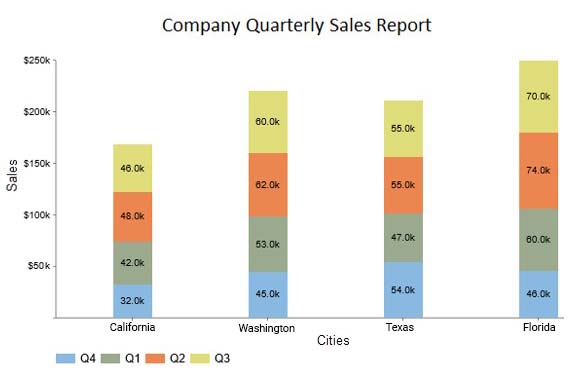
Shows how values change across multiple categories while highlighting cumulative impact. It’s useful for understanding how different components contribute to a final result.

Use Cases:

  • Break down revenue into cost and profit components
  • Analyze the contribution of multiple business units
  • Track cumulative financial performance over time
Financial Chart 1
  • Scatter Plot

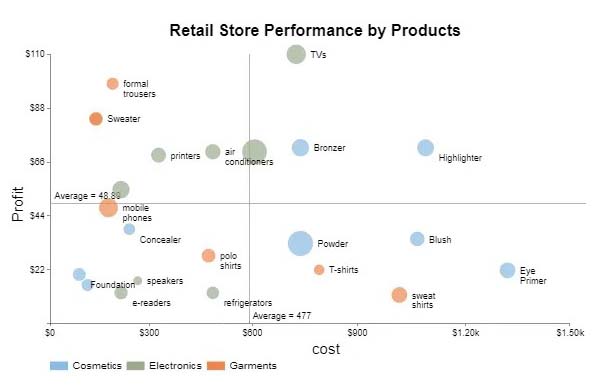
Displays relationships between two variables, helping identify correlation matrix in Excel, patterns, or anomalies in financial data.

Use Cases:

  • Analyze the relationship between marketing spend and revenue
  • Detect performance outliers
  • Identify positive or negative financial trends
Financial Chart 2
  • Dual Axis Bar and Line Graph

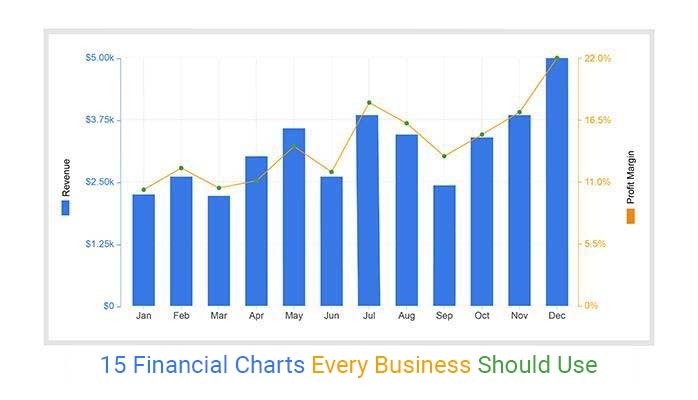
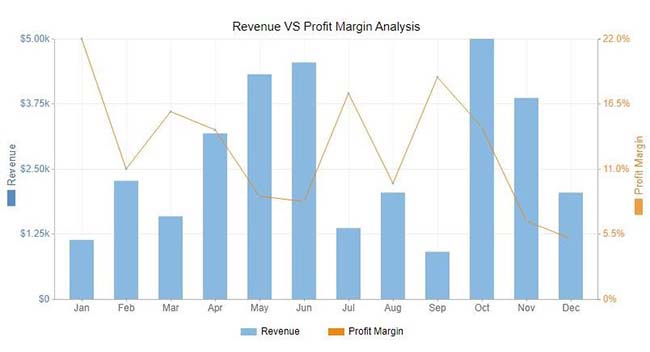
Combines two different metrics in one view, making it easier to compare trends and relationships.

Use Cases:

  • Compare revenue and expenses simultaneously
  • Track performance against targets
  • Present multiple KPIs in a single chart
Financial Chart 3
  • Stacked Bar Chart

Represents part-to-whole relationships while allowing comparisons across categories or time periods.

Use Cases:

  • Analyze expense distribution across departments
  • Compare sales contribution by product
  • Track changes in category performance over time
Financial Chart 4
  • Progress Bar Chart

Highlights progress toward financial goals using simple visual indicators.

Use Cases:

  • Monitor budget utilization
  • Track savings or investment goals
  • Measure project financial performance
Financial Chart 5
  • Multi Axis Line Chart

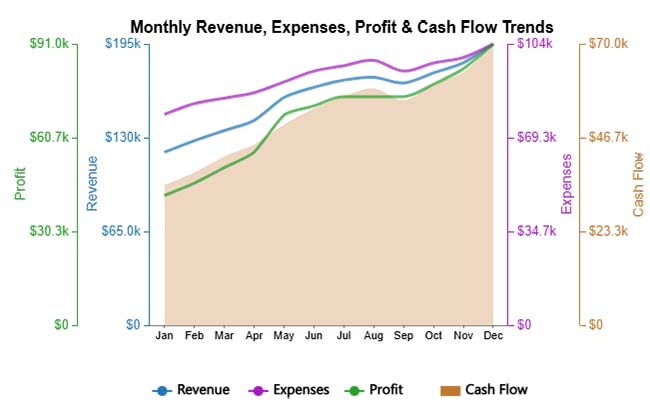
Displays multiple financial metrics with different scales, making trend comparison easier.

Use Cases:

  • Compare revenue, profit, and cash flow trends
  • Monitor multiple KPIs over time
  • Identify relationships between financial indicators
Financial Chart 6
  • Funnel Chart

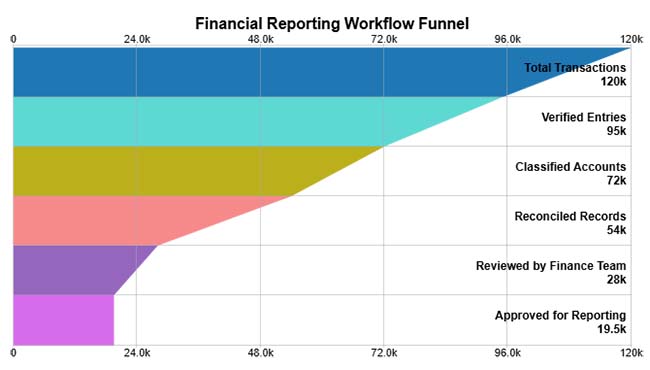
Shows how data moves through stages, helping identify drop-offs or inefficiencies.

Use Cases:

  • Analyze revenue pipeline stages
  • Track financial approval processes
  • Identify leakage points in transactions
Financial Chart 7
  • Sunburst Chart

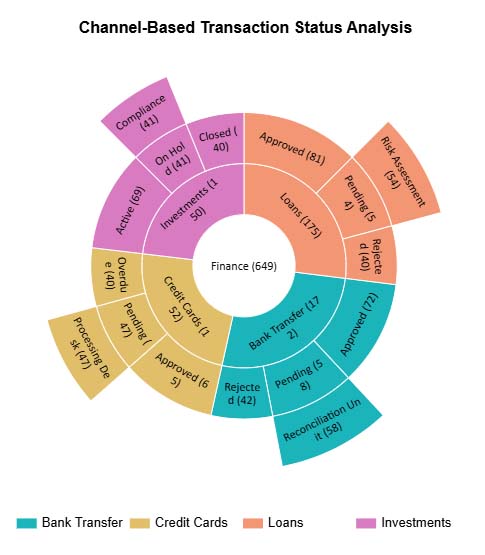
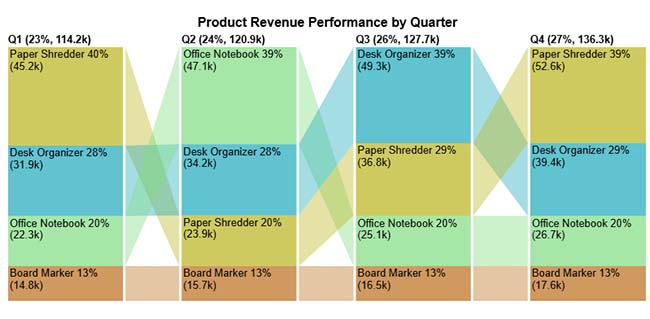
Visualizes hierarchical data in layers, showing how each segment contributes to the total.

Use Cases:

  • Break down revenue by region and product
  • Analyze cost structures
  • Explore multi-level financial data
Financial Chart 8
  • Sankey Chart

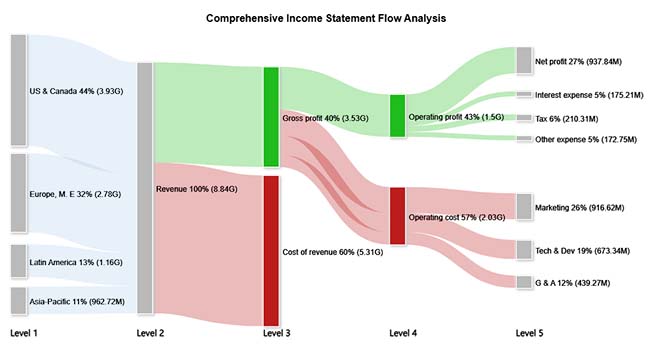
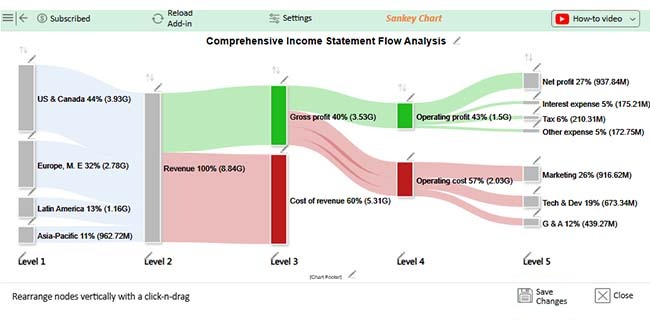
Represents the flow of values between categories, making it easy to track the movement of money.

Use Cases:

  • Visualize revenue distribution
  • Track cost allocation across departments
  • Understand profit flow and loss areas
Financial Chart 9
  • Waterfall Chart

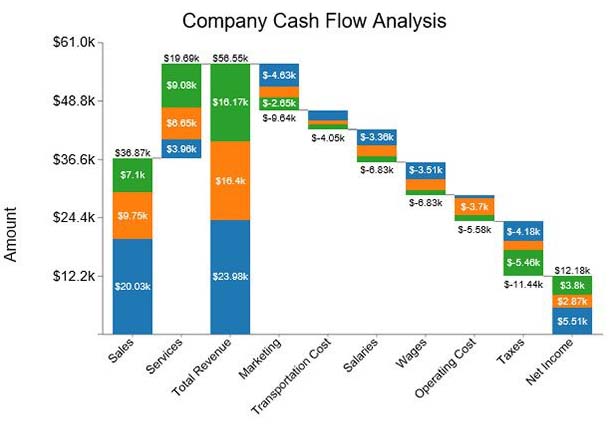
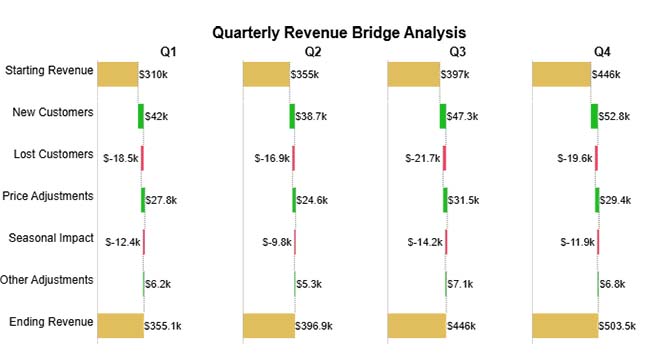
Shows step-by-step changes in values, highlighting gains and losses that lead to a final result.

Use Cases:

  • Analyze profit and loss statements
  • Track budget changes
  • Understand financial performance drivers
Financial Chart 10
  • Tornado Chart

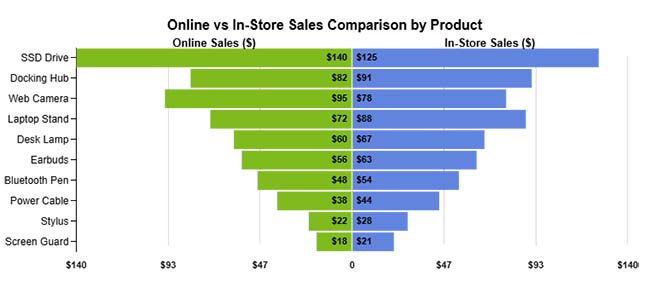
Compares the impact of multiple variables, helping identify the most influential factors.

Use Cases:

  • Perform sensitivity analysis
  • Identify major cost drivers
  • Support risk assessment
Financial Chart 11
  • Comparison Bar Chart

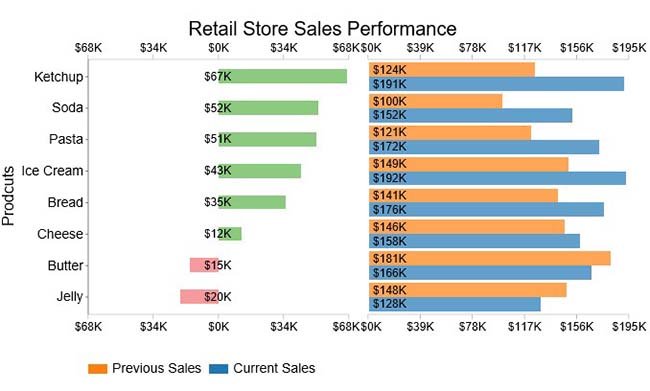
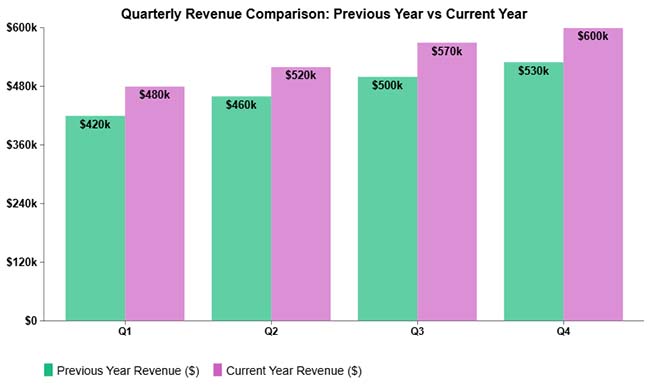
Displays values side by side for easy comparison across categories or time periods.

Use Cases:

  • Compare financial performance across regions
  • Analyze product profitability
  • Track changes over time
Financial Chart 12
  • Clustered Column Chart

Group multiple data series within categories for clear comparison.

Use Cases:

  • Compare quarterly financial performance
  • Analyze multi-product revenue
  • Track regional financial trends
Financial Chart 13
  • Tree Diagram

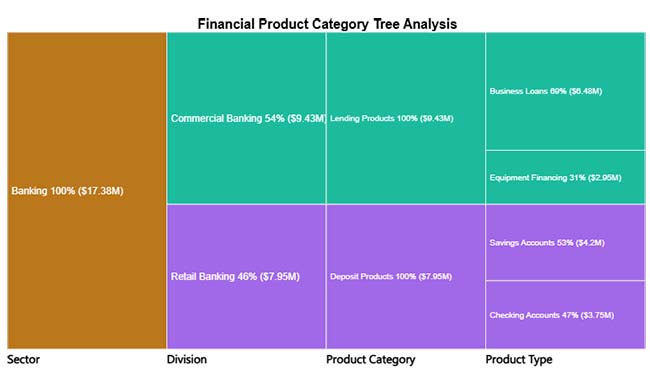
Breaks down financial data into hierarchical structures for a better understanding of relationships.

Use Cases:

  • Analyze revenue sources
  • Understand cost distribution
  • Explore organizational financial structure
Financial Chart 14
  • Multi Axis Spider Chart

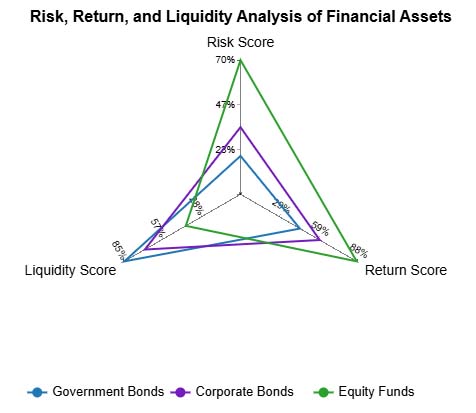
Displays multiple metrics in a single view, making it easy to compare performance across dimensions.

Use Cases:

  • Evaluate investment portfolios
  • Compare business units
  • Analyze strengths and weaknesses across KPIs
Financial Chart 15

How Financial Graphs Help Businesses Make Better Decisions

Financial graphs turn complex numbers into actionable insights, helping businesses make faster, smarter decisions. They provide clarity across operations, performance, and strategy. Key benefits include:

  • Quick performance insights: Instantly identify high-performing areas
  • Early issue detection: Spot cost spikes or revenue drops quickly
  • Better KPI tracking: Monitor budgets and profitability visually
  • Improved efficiency: Simplify reporting and reduce manual analysis
  • Stronger planning: Support forecasting and strategic decisions

Step-by-Step: How to Create Financial Charts in Excel

Creating clear financial charts in Excel helps you visualize trends, track performance, and make data-driven decisions. Follow these steps:

Step 1: Prepare Your Data

  • Organize your financial data in a clean table with headers like Revenue, Expenses, Profit, or Budget. Ensure all dates and categories are consistent.

Step 2: Select Your Data

  • Highlight the rows and columns you want to visualize, including both labels and values for clarity.

Step 3: Insert a Chart

  • Go to the Insert tab in Excel and choose a chart type suitable for your analysis, such as a line, bar, or Sankey chart.

Step 4: Customize Your Chart

  • Add titles, axis labels, legends, and adjust colors or formatting to make trends and comparisons clear.

Step 5: Add Context

  • Include annotations or data labels to highlight key insights, such as top-performing regions or budget variances.

Step 6: Enhance with Advanced Tools

  • Use ChartExpo for professional, interactive financial charts in Excel that go beyond Excel’s default options.

Step 7: Review and Share

  • Check your chart for accuracy and clarity, then share it with stakeholders or embed it in reports and dashboards for better decision-making.
Financial Chart 24

Key Insights

  • Revenue is highly concentrated, with the US & Canada contributing the largest share, followed by Europe, while Latin America and Asia-Pacific represent smaller portions.
  • Gross profit is significantly lower than total revenue, indicating that the cost of revenue consumes around 60% of the income stream.
  • Operating profit is reduced further by marketing, tech & development, and G&A expenses, resulting in a net profit margin of roughly 27%, showing healthy but heavily cost-influenced profitability.

Best Practices for Creating Effective Financial Charts

  • Keep It Clear and Simple: Focus on key metrics and trends. Avoid clutter so your audience can quickly grasp the insights.
  • Choose the Right Chart Type: Align the chart with your data. Use line charts for trends, bar charts for comparisons, and Waterfall charts for cash flow analysis.
  • Label Everything Clearly: Always include titles, axis labels, legends, and data points to make your charts easy to interpret.
  • Maintain Consistent Formatting: Use uniform colors, fonts, and scales to ensure charts look professional and are easy to read.

How to Choose the Right Financial Charts?

Choosing the right financial chart depends on what you want to analyze, whether it’s trends, comparisons, or financial flow.

  • Identify Your Objective: Determine whether you want to highlight trends, comparisons, proportions, or cash flow.
  • Match Chart Type to Data: Use line charts for trends over time, bar or column charts for comparing categories, pie charts for proportions, and waterfall charts for cash flow analysis.
  • Consider Your Audience: Make charts understandable for both finance professionals and non-technical stakeholders.
  • Emphasize Key Insights: Focus on critical metrics and avoid clutter to make your charts more impactful.

FAQs

How do you read a financial graph?

Reading a financial graph starts with understanding the axes, labels, and units. Look for trends over time, patterns in revenue, expenses, or profits, and key peaks or dips.

Focus on the story the data tells—such as growth periods, seasonal fluctuations, or areas where costs spike—so you can make informed business decisions quickly.

What makes a good financial chart?

A good financial chart is clear, accurate, and easy to understand. It highlights key insights, uses the right chart type for the data, and avoids unnecessary clutter so viewers can quickly interpret the information.

What are the different types of financial graphs?

Many graphs come in many forms, each serving a unique purpose:

  1. Line Charts: Track trends over time, such as revenue growth or expense changes.
  2. Bar/Column Charts: Compare different categories, like departments, products, or regions.
  3. Pie Charts: Show proportions or contributions of parts to the whole.
  4. Waterfall Charts: Illustrate how income, expenses, and costs flow into net profit.
  5. Area Charts and Combo Charts: Combine metrics to see relationships and cumulative effects.

When should you use financial charts instead of tables?

Use financial charts when you need to quickly understand trends, compare data, or present insights clearly. Charts are more effective than tables when dealing with large datasets or when communicating with stakeholders.

Wrap Up

Financial insights are essential for modern organizations to stay competitive. Raw numbers alone rarely reveal trends or performance patterns. Financial charts transform complex data into clear, actionable visuals, helping businesses make informed decisions quickly.

With the right charts, you can:

  • Identify trends and growth opportunities
  • Evaluate profitability and cost drivers
  • Communicate performance effectively to stakeholders
  • Plan strategically for the future

While spreadsheet tools provide a solid foundation, advanced charting solutions can simplify complex analyses and enhance decision-making. Choosing the right financial diagrams ensures your data tells a clear story and supports confident, data-driven business decisions.

How much did you enjoy this article?

ExcelAd2
Start Free Trial!
120091

Related articles

next previous
Microsoft Excel10 min read

Confidence Interval Graph and How to Interpret It?

Learn what a confidence interval graph is, how to create it in Excel, and how to interpret results to make more reliable, data-driven decisions.

Microsoft Excel9 min read

Correlation Matrix in Excel for Meaningful Insights

A correlation matrix in Excel helps identify relationships between variables. Learn how to create, read, and use it for effective data analysis.

Microsoft Excel10 min read

How to Create a Clustered Column Chart in Excel?

Learn how to create a clustered column chart in Excel with real use cases, step-by-step guide, tips, and common mistakes.

Microsoft Excel11 min read

How to Make Cool Excel Charts & Graphs?

Discover 11 cool Excel charts and graphs and learn how to turn raw data into clear insights for better analysis, reporting, and decisions.

Microsoft Excel11 min read

How to Create Control Chart in Excel?

Learn how to create a Control chart in Excel to track process stability, detect unusual variation early, and improve data-driven decision-making.

ChartExpo logo

Turn Data into Visual
Stories

CHARTEXPO

  • Home
  • Gallery
  • Videos
  • Services
  • Pricing
  • Contact us
  • FAQs
  • Privacy policy
  • Terms of Service
  • Sitemap

TOOLS

  • ChartExpo for Google Sheets
  • ChartExpo for Microsoft Excel
  • Power BI Custom Visuals by ChartExpo
  • Word Cloud

CATEGORIES

  • Bar Charts
  • Circle Graphs
  • Column Charts
  • Combo Charts
  • Comparison Charts
  • Line Graphs
  • PPC Charts
  • Sentiment Analysis Charts
  • Survey Charts

TOP CHARTS

  • Sankey Diagram
  • Likert Scale Chart
  • Comparison Bar Chart
  • Pareto Chart
  • Funnel Chart
  • Gauge Chart
  • Radar Chart
  • Radial Bar Chart
  • Sunburst Chart
  • see more
  • Scatter Plot Chart
  • CSAT Survey Bar Chart
  • CSAT Survey Chart
  • Dot Plot Chart
  • Double Bar Graph
  • Matrix Chart
  • Multi Axis Line Chart
  • Overlapping Bar Chart
  • Control Chart
  • Slope Chart
  • Clustered Bar Chart
  • Clustered Column Chart
  • Box and Whisker Plot
  • Tornado Chart
  • Waterfall Chart
  • Word Cloud
  • see less

RESOURCES

  • Blog
  • Resources
  • YouTube
SIGN UP FOR UPDATES

We wouldn't dream of spamming you or selling your info.

© 2026 ChartExpo, all rights reserved.