Categories
By ChartExpo Content Team
Waterfall charts are more than visuals—they tell a story of change. They break down complex data, showing gains, losses, and trends step by step. Businesses rely on them to track revenue, optimize pricing, control costs, and forecast growth.


Businesses across industries rely on Waterfall charts to make better decisions. From finance to marketing, supply chains to SaaS, the ability to visualize sequential data changes gives teams the clarity they need to act with confidence.
Numbers tell a story. Waterfall charts make sure you don’t miss the plot.
Imagine a chart that breaks down your project’s budget or sales data into a clear, step-by-step visual story. That’s a Waterfall Chart. It starts with your initial value, adds your gains, subtracts your losses, and lands on a final value.
It’s like watching your financial story unfold before your eyes. This chart is unique because it connects consecutive data points with vertical lines, forming a cascading effect. These charts are perfect for seeing how a starting value is impacted by a series of intermediate values, either positive or negative.
Businesses need tools that provide quick, clear insights. Waterfall charts offer just that by showing how initial figures evolve into final results through various changes. They are pivotal in understanding the cumulative effect of sequentially introduced positive or negative values.
For instance, they can show how revenue has been shaped by different market forces over a period. This visual breakdown helps companies pinpoint what drives gains or losses, aiding in smarter strategic decisions.
The Waterfall Chart is often linked with consulting giant McKinsey & Company, which popularized this visual tool. Initially used in financial reporting and strategic presentations, its clarity and effectiveness in showing the step-by-step progression of value have led to its widespread adoption across many sectors.
Over time, the chart has evolved with technology, becoming more flexible and easier to create with tools like ChartExpo and various business intelligence software.
Choosing the right chart depends on what story you need to tell with your data. Use a Waterfall Chart when you need to understand or explain sequential financial changes.
They are ideal when detailing the gradual accumulation of value, as in monthly earnings or spending over a fiscal year. Unlike bar or pie charts, which are great for comparisons or portions, Waterfall Charts excel in visualizing start-to-finish stories or the stepwise path of a value.
The Starting Value Bar marks the beginning of your Waterfall Chart. Think of it as your financial starting line. This bar shows where the data begins before any increases or decreases are applied. It’s crucial because it sets the context for all changes that follow.
You’ll see this as the leftmost bar, standing as the foundation from which all other values either rise or drop.
Floating bars in a Waterfall Chart are what make it so unique. These bars visually represent increases and decreases, floating between the start and end points. They are not anchored to the baseline, which helps in quickly spotting the gains and losses at a glance.
Each bar rises or falls from the endpoint of the previous bar, which makes the flow of data easy to track. These bars are the storytellers in your chart, narrating the journey of your data from start to finish.
At the far right, the Final Value Bar awaits to show you where all the additions and subtractions have led. This bar is your outcome visualized, the culmination of all previous data points.
It offers a clear and direct reflection of the total impact of the gains and losses recorded across the chart. Understanding this bar lets you measure success or evaluate needs for adjustment.
Color coding is not just about aesthetics in a Waterfall Chart; it’s a functional feature that enhances readability. By assigning different colors to gains, losses, and totals, you immediately distinguish between positive and negative movements.
This method transforms a simple chart into a highly intuitive visual tool. Colors like green for gains and red for losses can turn complex data into an understandable story, making your Waterfall Chart not just smart, but also incredibly insightful.
In the corporate finance, CFOs rely on financial bridge charts, also known as waterfall charts, to clarify the step-by-step changes between initial budget projections and the final outcomes. These visual tools break down the complex process of budgeting and forecasting into understandable segments, showing both positive and negative shifts.
They offer a clear visualization of how starting balances evolve based on various business activities, leading to a final financial state. This clarity aids CFOs in communicating financial results and planning future financial strategies effectively.
Retail and e-commerce sectors utilize waterfall charts to optimize their pricing and revenue strategies. By detailing the incremental impact of price changes, promotions, or seasonality on initial sales figures, these charts help in pinpointing specific factors that drive revenue fluctuations.
This visibility enables managers to make informed decisions on pricing adjustments or to design effective promotional campaigns that maximize revenue. The methodical breakdown provided by waterfall charts ensures that each factor’s impact on sales is clearly understood and accounted for in strategy planning.
In supply chain and logistics, managing costs effectively is crucial. Stacked waterfall charts are pivotal in this industry, offering a multi-layered view of cost analysis.
These charts detail how starting logistics costs accumulate or reduce through various stages of supply chain operations, from manufacturing to delivery. They help managers identify key areas where costs are ballooning and where reductions are feasible.
By providing a clear picture of cost dynamics, stacked waterfall charts are instrumental in driving strategic decisions to tighten cost control measures across the supply chain.
Tech and SaaS companies often grapple with metrics like customer churn and growth. Waterfall diagrams serve as essential tools for these companies by sequentially showing customer gains and losses over a period.
This visual representation helps companies spot trends in customer behavior, such as the effectiveness of customer retention strategies or the impact of new product releases on customer growth.
Insights derived from these diagrams enable businesses to refine their customer engagement approaches and boost overall growth metrics effectively.
Select data that shows incremental changes, such as monthly revenue growth or expense details over a year. The data should start with an initial value, followed by increases or decreases, ending with a final value.
This selection ensures your waterfall chart effectively illustrates the step-by-step progression of values.
Develop a template by setting standard colors, labels, and formats in your chosen software. This template can be reused, ensuring consistency across reports. It saves time and maintains uniformity, especially useful when sharing your charts with team members or stakeholders who benefit from a standardized format.
A typical error is misaligning the data categories, which disrupts the flow of information. Double-check data alignment before finalizing the chart. Another mistake is overlooking the inclusion of intermediate subtotals, which are critical for understanding the step changes. Include these to enhance the chart’s informational value.
Use contrasting colors to differentiate between increases and decreases, making the chart easier to interpret at a glance. Label each data point clearly, and consider adding a brief description if the data points are not self-explanatory.
This practice turns your waterfall chart into a clear and insightful visual tool, ready to aid in decision-making processes.
The following video will help you to create a Waterfall Chart in Microsoft Excel.
The following video will help you to create a Waterfall Chart in Google Sheets.
Retail and e-commerce sectors thrive on understanding market trends. Waterfall diagrams play a pivotal role here. They visually break down cumulative data changes over time. This allows retailers to pinpoint specific events impacting sales.
For example, a sudden dip or spike during a promotional campaign becomes easily identifiable. Thus, businesses adjust strategies swiftly, staying aligned with market demands.
In financial planning, bridge charts (a type of waterfall chart) are indispensable. They detail the step-by-step progression of financial forecasts, showcasing initial figures leading up to the final financial outcome. By doing so, they highlight deviations and unexpected results.
Analysts utilize these insights to refine risk assessments and forecast accuracy. This proactive approach aids in maintaining financial health and preparedness.
Operational efficiency is about maximizing output while minimizing costs. Waterfall graphs excel in pinpointing where costs accrue within business operations. Each step of the operational process is analyzed, showing cost additions or reductions.
Businesses can see where costs balloon and implement strategies to streamline operations, thus cutting down unnecessary expenses effectively.
For SaaS companies, growth planning is about predicting revenue streams effectively. Stacked waterfall charts offer a layered view of revenue forecasts, segmenting them by product lines or subscription tiers. This segmentation helps in understanding which areas are driving growth and which are not. Such detailed analysis supports strategic adjustments to boost overall revenue.
Waterfall charts excel in displaying the sequential impact of components. They’re ideal when you want to show the step-by-step progression of a value.
Line charts are better for trends over time, showing continuous data points linked together. Bar charts compare different items at a single time point. So, if your story is about change and accumulation, go for a waterfall chart. If it’s about trends or comparisons, think line or bar charts.
Though similar, bridge and waterfall charts have distinct uses. A bridge chart typically focuses on reconciling between two data points, ideal for financial statements. It highlights adjustments or reconciliations. In contrast, waterfall charts provide a detailed view of how starting points lead to final outcomes through various positives and negatives.
They are perfect for visualizing profit and loss accounts or budget changes.
Templates can be tempting for their ease of use but aren’t always the right choice. If your data involves more than sequential elements—like categories or complex interactions—a different visualization might work better.
Consider using stacked bar charts for categories within each stage or a flow chart for processes with multiple paths or outcomes.
Cascade charts are a subset of waterfall charts that focus on a singular flow, often used in project management to show phases or tasks. Use these when your data is linear without reverts or loops.
On the other hand, bar charts are best for comparing quantities across different categories. If your visualization goal is comparison rather than storytelling through data, a bar chart might serve better.
Waterfall chart templates offer a ready-to-use framework that can save time and effort. They’re ideal if your data tracking needs are straightforward or if you’re working within a tight budget. However, they might lack flexibility for more complex data or unique business requirements.
On the other hand, custom reports allow for complete customization. They cater specifically to your business’s unique needs. Although more costly and time-consuming to develop, they provide tailored insights that templates simply can’t match.
Free templates are a budget-friendly option that can be sufficient for small businesses or those just starting with waterfall charts. They are easy to use but often come with limited features and support.
Paid templates, while requiring an upfront cost, typically offer more advanced features and customization options. They often include customer support and regular updates, making them a worthwhile investment for businesses needing more robust data analysis tools.
For beginners, a basic waterfall chart template that handles standard data sets with minimal setup is ideal. These charts help in understanding the basics without overwhelming new users with too many options.
Experts might find basic templates limiting. They often require advanced charts that offer detailed customization to manipulate and present complex data effectively. For seasoned professionals, investing in advanced software or custom solutions can provide the flexibility needed for in-depth data analysis.
Start by evaluating your business’s data analysis needs. Consider the complexity of the data and who will be using the charts. Budget constraints and the necessity for support should also influence your decision.
For businesses with evolving needs, consider starting with a scalable paid template that offers basic functionality with options to add more complex features as needed. This approach provides flexibility and cost-effectiveness without sacrificing capability as your business grows.
By carefully considering these factors, you can select a waterfall chart solution that not only meets your current data presentation needs but also adapts to future demands.
Imagine a Waterfall Graph as a visual story. Each bar has a role to play.
Labels and colors aren’t just decorative; they guide the viewer through the narrative. Labels clearly mark the start, end, and each interim value, helping pinpoint where shifts occur in the data.
Colors differentiate between increases, decreases, and total values, providing a quick understanding of positive and negative trends. This clarity transforms a simple chart into a powerful tool for decision-making.
Accuracy in a Waterfall Chart hinges on correct scaling. If the scale’s too broad, small yet critical changes get lost. Too narrow, and the chart might exaggerate minor variations. Start by determining the range of your data.
Ensure that the maximum and minimum values are well-represented without compressing the chart unduly. This balance helps maintain the integrity of the data, allowing for precise analysis and better strategic decisions.
Effective Waterfall Reports are all about readability. Bold headings and distinct color contrasts between consecutive bars make the data pop. Align your numbers right and maintain a uniform font size to avoid visual confusion.
Utilize grid lines sparingly; they should aid in data measurement without cluttering the view. Remember, the goal is to make your Waterfall Chart not just presentable but instantly insightful.
Floating bars often cause confusion in waterfall charts. They represent adjustments rather than starting or ending values. Here’s how to clear up any misinterpretation:
First, always double-check the data source for each bar to confirm its role in the chart.
Secondly, use distinct colors or patterns for floating bars to differentiate them from the rest.
Lastly, include a legend or a brief explanatory note right on the chart to guide viewers through the interpretation process.
Incorrect axis scaling can drastically misrepresent data in waterfall charts, leading to poor decision-making. To prevent this, always set the axis scale manually instead of relying on automatic settings.
Ensure that the scale reflects the range of your data accurately. If using templates, adjust the default scaling settings to suit your specific data set. Regularly review the scale as you update the chart with new data to maintain accuracy.
Clear labeling is critical in conveying the correct information on waterfall charts. Errors in labeling can lead to misinterpretation of the data. To avoid this, label each bar clearly and check that the labels correspond directly to the data they represent.
Use straightforward, concise language for labels to improve readability. Consider positioning labels both inside and outside the bars to enhance clarity, depending on the complexity and length of the text.
Develop a troubleshooting flowchart specifically for common issues in waterfall charts. This tool should guide users through a series of questions and answers leading to solutions for typical problems like misaligned data, incorrect calculations, or unclear labels.
Start the flowchart by verifying the data source and move through steps like checking the chart settings, reviewing scale accuracy, and ensuring all labels are correct and clear. This approach promotes quick and efficient problem resolution, enhancing the utility of the waterfall chart.
Waterfall charts are fantastic tools for visualizing sequential data. However, template adjustments are often necessary for accuracy. Start by checking data ranges within the template. Make sure each segment reflects the correct data point.
Next, verify the calculations on incremental increases or decreases. Errors here can skew the entire visualization. Finally, assess the axis labels for clarity. This ensures that viewers understand the data’s progression at a glance.
Formatting errors can disrupt the readability of waterfall charts. First, align all labels to avoid confusion. Misaligned labels can mislead viewers about data values. Secondly, ensure consistent color coding. This helps in distinguishing between different data types, like gains and losses.
Lastly, adjust spacing between bars. Too much or too little space can make the chart hard to interpret.
Automation streamlines creating waterfall charts, but errors can occur. First, check the data linkage. Errors often stem from incorrect data paths. Next, review the automation rules. Ensure they apply correctly across the data set.
Lastly, test the template with sample data. This identifies any operational glitches before applying real data.
Accuracy in waterfall reports is crucial. First, double-check all data inputs. Errors here can cascade through the entire report. Second, review the computational logic. This includes ensuring that summations and subtractions are correctly applied. Third, solicit feedback on the report’s clarity.
Sometimes, what makes sense to one does not to another. This feedback loop is invaluable for maintaining accuracy and usability in your reports.
Industries vary, and so do their data visualization needs. Customizing waterfall charts to meet specific industry requirements ensures relevance and clarity.
For instance, retail businesses benefit from charts that highlight seasonal sales increases and inventory costs. Adjusting the chart’s scale and categories to reflect relevant financial metrics makes the data more actionable for decision-makers.
Interactive dashboards with stacked waterfall charts provide an in-depth view of data layers. These dashboards allow users to click on chart elements to drill down into more detailed data views.
For example, in a stacked waterfall chart of company revenue, clicking on a segment could display underlying income sources, offering immediate insights without toggling between views.
Waterfall reports are invaluable for predictive forecasting by sequentially revealing data trends and impacts. They can predict future financial outcomes by analyzing the incremental effects of different business activities. This method allows companies to adjust strategies proactively, based on projected data trends shown in the waterfall format.
AI and machine learning dramatically reshape how waterfall reports are generated and interpreted. AI algorithms can analyze vast datasets to identify patterns and anomalies that might not be visible to human analysts. This capability allows for more accurate forecasts and smarter business strategies based on data-driven insights.
Automation in creating financial bridge charts enhances efficiency and accuracy. Automated systems pull data directly from financial software, reducing human error and time spent on data entry.
These systems can update charts in real-time as new data becomes available, ensuring that financial reports always reflect the most current information.
AI-powered waterfall charts represent the future of predictive analytics. These tools use advanced algorithms to forecast future trends based on historical data.
For example, they might predict next quarter’s revenue by analyzing previous patterns of customer behavior and market conditions, providing businesses with a powerful tool for strategic planning.
Color coding in waterfall charts isn’t just about aesthetics; it’s about communication. Use distinct colors to differentiate between increases, decreases, and totals. Typically, green shows growth, red indicates reductions, and blue represents total values. This visual distinction helps viewers quickly grasp the financial story you’re presenting, enhancing comprehension and decision-making.
Accuracy in labels and scaling is paramount in waterfall charts. Ensure that each segment is clearly labeled with its corresponding value to avoid confusion. Scaling should reflect the data adequately, making sure all increments and decrements are visible and proportional. This precision aids stakeholders in understanding the nuances of financial changes.
One typical error in waterfall charts is not maintaining consistent scales and formats across similar reports, which can mislead interpretation. Another pitfall is overcrowding the chart with too much data, complicating the visual flow. Focus on key data points to maintain clarity and impact.
This checklist offers a quick guide to keep your waterfall charts sharp and effective, ensuring they serve their purpose of elucidating financial stories with clarity and impact.
Industry leaders from various sectors have embraced Waterfall Charts for their clarity and strategic value. CEOs and CFOs alike find these charts indispensable for presenting the sequential impact of financial elements clearly. They allow viewers to grasp complex data at a glance, making strategic discussions more efficient.
Financial strategists often highlight the chart’s ability to show the step-by-step progression of revenue or profit figures. This visualization aids in pinpointing specific areas that drive changes, whether positive or negative. As a result, discussions aren’t just about numbers; they focus on strategic decisions impacting those numbers.
Tech giants, particularly, appreciate how these charts facilitate communication across departments. They break down silos by providing a common understanding of financial outcomes. This shared perspective is crucial for aligning various departmental strategies with overall corporate goals.
Financial analysts prefer Financial Bridge Charts, commonly known as Waterfall Charts, for their transparency in displaying data transitions. These charts excel in showing the cumulative effect of sequentially introduced positive or negative values. They provide a clear path from the beginning balance to the ending balance, which is invaluable in financial reporting.
One key advantage is their ability to detail the incremental impact of multiple factors on a final value. This makes them perfect for earnings analysis, where it’s crucial to understand different revenue and expense contributions. By breaking down these components, analysts can offer more detailed, actionable insights.
Moreover, these charts prevent the oversight of smaller yet significant items that might be overlooked in traditional bar or line charts. Their structured breakdown assists analysts in identifying underlying trends that could inform future financial strategies or decisions.
Data scientists leverage Waterfall Graph Templates to enhance business forecasting models. These templates provide a foundational structure that can be customized to reflect specific business variables and outcomes. By using these visual tools, data scientists can forecast future business scenarios by clearly illustrating how sequential actions might lead to different financial outcomes.
In predictive analytics, for example, Waterfall Charts help in visualizing the step-wise progression of inventory levels, sales forecasts, or customer growth. This visual representation allows businesses to see potential future states based on current data trends, making strategic planning more informed and data-driven.
Additionally, these charts are instrumental in scenario analysis. Data scientists can create multiple forecasts showing different outcomes based on varying actions. This ability to visually compare different future states side by side helps executives make better-informed decisions.
Executives find Waterfall Reports essential for their straightforward portrayal of how sequential decisions impact financial stability and growth. These reports provide a narrative that’s easy to follow, showing the financial journey across a fiscal period. This clarity is crucial during executive meetings where time is limited, and decisions need to be made quickly.
The visual format of Waterfall Reports allows for immediate recognition of positive and negative influences throughout the reporting period. This helps leaders identify trends and anomalies without sifting through dense numeric tables. As a result, decision-making becomes faster and more responsive to the company’s financial health.
Moreover, these reports foster transparency in financial communication, which builds trust among stakeholders. They show not just where the company is, but how it got there, which is critical for investor relations and internal audits.
Research indicates a strong correlation between the use of Waterfall Diagrams and business success, particularly in project management and financial forecasting. Studies show that companies that employ these diagrams in their reporting and planning processes experience clearer communication and better strategic alignment.
These diagrams are particularly valued for their ability to display the flow of value across a process or project. This visual tracking helps teams stay on top of project budgets, timelines, and resource allocation, reducing the risk of project overruns and ensuring better outcomes.
Academic research also supports the use of Waterfall Diagrams for risk assessment. By visually mapping out potential risks along with their financial impacts, companies can better prepare and mitigate these risks proactively. This proactive approach not only saves resources but also shields the company from potential setbacks, fostering a stable environment for growth and innovation.
A Waterfall Chart isn’t just a visualization—it’s a tool for clarity. It breaks down financial shifts, showing gains and losses in a way that anyone can grasp. Whether tracking revenue, budgeting, or analyzing costs, this chart turns raw numbers into clear insights.
Its step-by-step approach makes it essential for finance, marketing, supply chain, and SaaS. It helps businesses pinpoint trends, assess performance, and make smarter decisions without sifting through endless spreadsheets.
To get the most out of a Waterfall Chart, focus on accurate scaling, clear labels, and distinct color coding. Avoid common mistakes like misaligned data and incorrect axis settings. Choose the right software for your needs.
Numbers tell a story—this chart helps you visualize it.
How much did you enjoy this article?


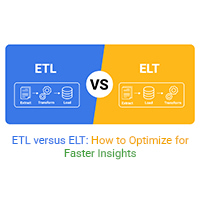
This guide dives deep into the ETL versus ELT debate. It helps you discover the differences and similarities. It also helps you discover which is better.
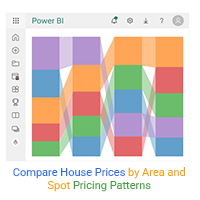
This guide dives deep into how to compare house prices by area. Guide also helps you discover how to analyze home price comparisons by city in Power BI.
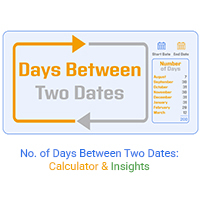
Explore how to calculate the no of days between two dates in Power BI with DAX DATEDIFF. Improve analysis skills with this detailed tutorial and practical tips.