• Home
  • Tools dropdown img
    • Spreadsheet Charts

      • ChartExpo for Google Sheets
      • ChartExpo for Microsoft Excel
    • Power BI Charts

      • Power BI Custom Visuals by ChartExpo
    • Word Cloud

  • Charts dropdown img
    • Chart Category

      • Bar Charts
      • Circle Graphs
      • Column Charts
      • Combo Charts
      • Comparison Charts
      • Line Graphs
      • PPC Charts
      • Sentiment Analysis Charts
      • Survey Charts
    • Chart Type

      • Box and Whisker Plot
      • Clustered Bar Chart
      • Clustered Column Chart
      • Comparison Bar Chart
      • Control Chart
      • CSAT Survey Bar Chart
      • CSAT Survey Chart
      • Dot Plot Chart
      • Double Bar Graph
      • Funnel Chart
      • Gauge Chart
      • Likert Scale Chart
      • Matrix Chart
      • Multi Axis Line Chart
      • Overlapping Bar Chart
      • Pareto Chart
      • Radar Chart
      • Radial Bar Chart
      • Sankey Diagram
      • Scatter Plot Chart
      • Slope Chart
      • Sunburst Chart
      • Tornado Chart
      • Waterfall Chart
      • Word Cloud
    • Google Sheets
      Microsoft Excel
  • Services
  • Pricing
  • Contact us
  • Blog
  • Support dropdown img
      • Gallery
      • Videos
      • Contact us
      • FAQs
      • Resources
    • Please feel free to contact us

      atsupport@chartexpo.com

Categories
All Data Visualizations Data Analytics Surveys
Add-ons/
  • Google Sheets
  • Microsoft Excel
  • Power BI
All Data Visualizations Data Analytics Surveys
Add-ons
  • Google Sheets
  • Microsoft Excel
  • Power BI

We use cookies

This website uses cookies to provide better user experience and user's session management.
By continuing visiting this website you consent the use of these cookies.

Ok

ChartExpo Survey


Home > Blog > Microsoft Excel

Time Series Analysis: What is it, Types and Best Practices

Fine-tune the model’s parameters to improve its predictive performance, often using techniques like grid search, cross-tabulation, or cross-validation.

What is time series data?

Imagine you’re a stock market analyst tracking daily stock prices. Each price point recorded over time creates a time series. Simple.

But time series data isn’t limited to finance. It’s everywhere. Weather predictions, pulse trackers, and market data all depend on it.

What is Times Series Data

Global sales of time series databases surpassed $300 million in 2019. That is massive! Businesses utilize this data to forecast upcoming trends. Precise forecasts have the potential to result in substantial competitive benefits.

Imagine being a retailer who dissects sales data monthly. You observe increases in sales during holidays and decreases in off-seasons. This pattern demonstrates the application of time series data. Understanding these patterns can enhance inventory and marketing plans. This is not a theoretical scenario. Corporations such as Walmart and Amazon utilize time series data to predict demand and oversee supply chains.

However, time series data is not solely utilized by businesses. Healthcare uses it, too. Monitoring patient vital signs over time helps in early disease detection. For example, a consistent rise in blood pressure readings can signal potential health issues. This proactive approach can save lives.

One fascinating aspect of time series data is seasonality. Think of electricity usage. It peaks in summer due to air conditioning and dips in fall. Recognizing these patterns helps utility companies manage resources efficiently.

So, what is time series data? It’s a powerful tool for analyzing trends over time.

Ready to dive deeper? Let’s explore how time series data can transform your data analysis and decision-making processes.

Table of Contents:

  1. What is Times Series?
  2. What is Times Series Data?
  3. What is Time Series Analysis Used For?
  4. Types of Time Series Analysis
  5. What is Time-Series Analysis vs. Time-Series Forecasting?
  6. What are Time Series Forecasting Methods?
  7. How to Visualize Time Series Data in Excel?
  8. Advantages of Time Series Analysis
  9. What are the Challenges of Time Series Analysis?
  10. What are Time Series Analysis Best Practices?
  11. Wrap Up

First…

What is Times Series?

Definition: A time series is a sequence of data points recorded at specific time intervals. These intervals can be hourly, daily, weekly, monthly, or yearly.

Time series data tracks changes over time. It’s commonly used in various fields, such as finance, economics, and meteorology.

Time series analysis involves examining data points to identify trends, patterns, and seasonal variations, which are crucial aspects of trend analysis. This analysis helps forecast future values based on historical data. Techniques like moving averages and exponential smoothing are often applied to enhance the accuracy of trend analysis.

Visualizing time series data through different types of charts and graphs makes it easier to understand trends. Line graphs are frequently used for this purpose. Time series data can reveal cyclical patterns, such as stock market fluctuations or temperature changes.

Understanding time series is crucial for making informed decisions. It helps predict future events and plan accordingly. Whether for business or scientific research, time series analysis provides valuable insights.

What is Times Series Data?

Time series data consists of observations recorded at specific and equally spaced time intervals. This type of data captures how a variable changes over time. This makes it crucial to identify trends, patterns, and cyclical behaviors. It is widely used in various fields, such as finance, economics, weather forecasting, and many others.

Components of Time Series:

  1. Temporal ordering: Temporal ordering is the sequential arrangement of data points in the order they were collected over time. This chronological sequence is fundamental to time series analysis. Why? It helps to identify patterns and trends.
  2. Frequency: The interval at which data points are recorded, such as hourly, daily, weekly, or monthly. The choice of frequency depends on the nature of the data and the insights sought.
  3. Trend: A trend indicates the long-term movement or direction in the data over some time. Trends can be upward, downward, or stable, showing the general direction in which the data is moving.
  4. Seasonality: Regular and predictable patterns that repeat over a specific period, such as daily, monthly, or yearly. Examples include increased retail sales during the holiday season or higher electricity consumption in summer.
  5. Cyclic patterns: Fluctuations that occur at irregular intervals, influenced by external factors such as economic cycles. Unlike seasonality, these cycles are not fixed and can vary in length and intensity.
  6. Randomness: The unpredictable and irregular variations in the data that cannot be attributed to trends, seasonality, or cycles. This component is also known as “noise” and can obscure the underlying patterns.

What is Time Series Analysis Used For?

Time series analysis is a versatile tool used across various fields to make sense of data collected over time. Here are the diverse applications of time series analysis:

  • Forecasting: Time series analysis is essential for forecasting future values based on historical data. This is crucial for budgeting, stock market predictions, and resource planning.
  • Trend analysis: It helps identify long-term trends in data. Businesses use trend analysis and customer behavior analytics to understand market movements and customer behavior over time, aiding in strategic planning.
  • Seasonal adjustment: Time series analysis adjusts for seasonality to reveal the underlying trends. This is particularly useful in retail and agriculture, where sales and production fluctuate seasonally.
  • Anomaly detection: Time series analysis can spot unusual patterns, helping to prevent fraud, detect faults, and ensure system reliability.
  • Cyclical analysis: It helps analyze cyclical patterns that occur over longer periods. Understanding these cycles is vital for economic planning and policy-making.
  • Correlation and causality analysis: Time series analysis examines the relationships between different variables over time. This helps identify causality and correlation, which is crucial for making informed decisions.
  • Modeling and simulation: It aids in creating models to simulate various scenarios. This is useful in finance, engineering, and environmental studies to predict outcomes under different conditions.
  • Quality control: In manufacturing, time series analysis, including the use of control charts, monitors production processes to ensure quality control. It helps identify and correct deviations promptly.
  • Environmental studies: It is used to track and predict environmental changes, such as climate patterns and pollution levels, contributing to sustainable development.
  • Health and medicine: Time series analysis monitors patient data and tracks the spread of diseases. This assists in timely intervention and healthcare planning.
  • Marketing: Businesses use time series analysis to evaluate marketing campaigns’ effectiveness over time. This helps optimize marketing strategies and improve customer engagement.

Types of Time Series Analysis

Time series analysis is a rich field with various methods to uncover insights from temporal data. Here are the different types of time series analysis that help make sense of data collected over time:

  • Descriptive Analysis

Descriptive analysis summarizes the main features of time series data. It involves calculating statistical measures like mean, median, and standard deviation to provide a clear overview of the data’s characteristics.

  • Exploratory Analysis

Exploratory data analysis delves deeper into the data to identify patterns, anomalies, and relationships. This type of analysis uses visual tools like plots and graphs to uncover hidden structures and guide further investigation.

  • Trend Analysis

Trend analysis focuses on identifying the long-term movement in data. It helps in understanding whether the data shows an upward, downward, or stable trend over time. This is crucial for strategic planning.

  • Seasonal Analysis

Seasonal analysis examines recurring patterns or cycles within specific periods, such as months or quarters. This analysis is vital for businesses that experience seasonal variations in sales or production.

  • Explanatory Analysis

Explanatory analysis seeks to understand the cause-and-effect relationships in time series data. It looks at how different factors influence the observed data, providing insights into underlying mechanisms.

  • Forecasting

Forecasting uses historical data to predict future values. Techniques like ARIMA, exponential smoothing, and machine learning models are employed to make accurate forecasts, aiding in planning and decision-making.

  • Intervention Analysis

Intervention analysis assesses the impact of an event or intervention on a time series. It helps determine whether a specific action, such as a policy change, has had a significant effect on the data.

  • Residual Analysis

Residual analysis involves examining the residuals or errors in time series models. This type of analysis helps assess the model’s accuracy and identify any patterns the model failed to capture.

  • Spectral Analysis

Spectral analysis breaks down time series data into its frequency components. It is used to identify periodic cycles and understand the data’s underlying structure, often applied in fields like engineering.

What is Time-Series Analysis vs. Time-Series Forecasting?

Have you ever wondered how experts predict stock prices or weather patterns? They use sophisticated methods to analyze and forecast time-dependent data, often utilizing tools like the Multi-Axis graph in Excel for more nuanced insights. Let’s break down the differences between time-series analysis and time-series forecasting.

Aspect Time-Series Analysis Time-Series Forecasting
Purpose To understand and explore past data trends and patterns. To predict future values based on historical data.
Components Trend, Seasonality, Cyclic Patterns, Noise. Historical data, Model selection, Future prediction.
Techniques Decomposition, Autocorrelation, Spectral analysis. ARIMA, Exponential smoothing, Machine learning models.
Output Insights on past data behavior. Forecasted future data points.
Use Cases Identifying sales patterns and Understanding temperature changes. Stock price prediction, Demand forecasting.


What are Time Series Forecasting Methods?

Have you ever wondered how weather forecasts, stock market predictions, or sales projections are made? It all comes down to time series forecasting, a fascinating process that uses historical data to predict future trends. Let’s walk through the key steps involved in this method.

  1. Data collection: Gather historical data relevant to the variable you want to forecast, such as temperature readings, stock prices, or sales figures.
  2. Data preprocessing: Clean the data by handling missing values, removing outliers, and transforming data formats to ensure accuracy and consistency.
  3. Exploratory Data Analysis (EDA): Visualize data using plots and graphs to understand trends, seasonality, and patterns over time.
  4. Stationarity check: Determine if the data’s statistical properties are constant over time. If not, apply transformations like differencing to achieve stationarity.
  5. Model selection: Choose an appropriate forecasting model, such as ARIMA, exponential smoothing, or machine learning models, based on the data characteristics.
  6. Model training: Train the selected model using historical data to learn the underlying patterns and relationships.
  7. Model evaluation: To ensure accuracy, assess the model’s performance using metrics like Mean Absolute Error (MAE), Root Mean Squared Error (RMSE), etc.
  8. Hyperparameter tuning: Fine-tune the model’s parameters to improve its predictive performance, often using techniques like grid search, cross-tabulation, or cross-validation.
  9. Forecasting: Generate future data points based on the trained model to predict upcoming trends and values.
  10. Model deployment and monitoring: Deploy the forecasting model into a production environment and continuously monitor its performance to make adjustments as needed.

How to Visualize Time Series Data in Excel?

Data visualization is key to understanding trends over time. But have you ever tried to visualize time series data in Excel and felt like you were deciphering hieroglyphics?

Excel often leaves us wanting more. Its basic charts can feel as thrilling as watching grass grow.

Enter ChartExpo, the knight in shining armor for your data woes. This add-on takes your Excel charts from drab to fab, transforming your time series data into captivating visuals that enhance your visual storytelling.

Ready to upgrade your data game?

Let’s dive in!

Let’s learn how to install ChartExpo in Excel.

  1. Open your Excel application.
  2. Open the worksheet and click the “Insert” menu.
  3. You’ll see the “My Apps” option.
  4. In the Office Add-ins window, click “Store” and search for ChartExpo on my Apps Store.
  5. Click the “Add” button to install ChartExpo in your Excel.

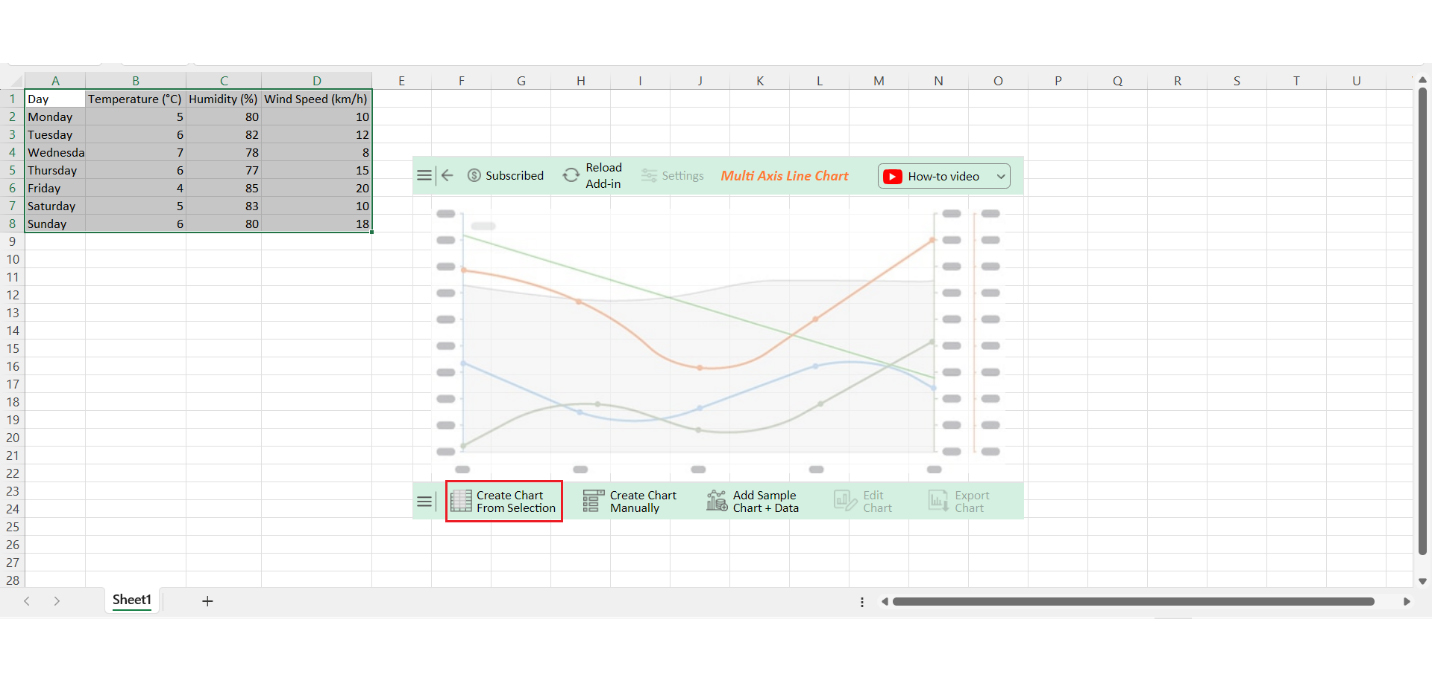
ChartExpo charts are available both in Google Sheets and Microsoft Excel. Please use the following CTAs to install the tool of your choice and create beautiful data visualizations with a few clicks in your favorite tool.

Example

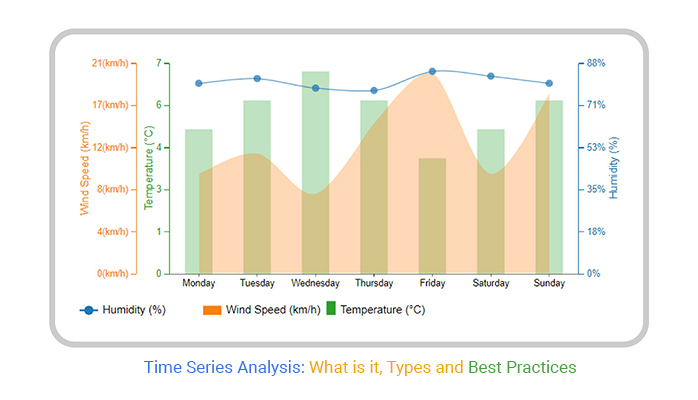
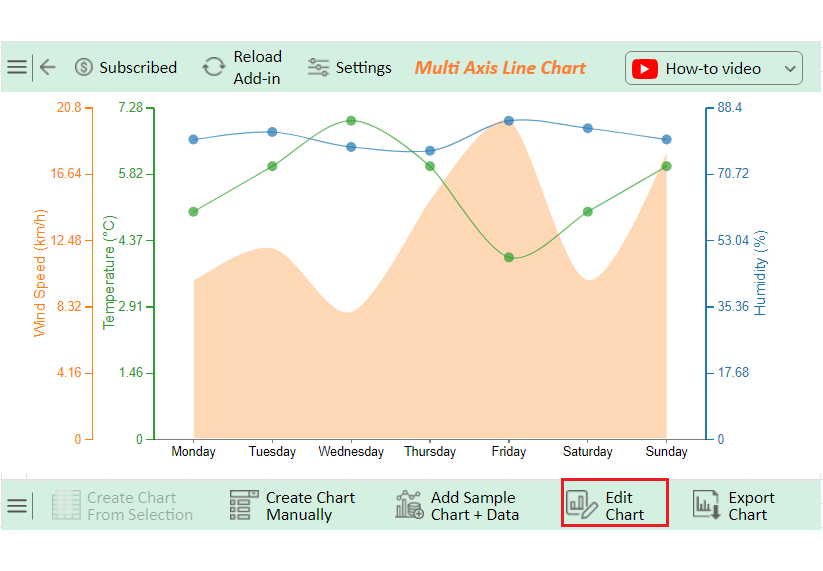
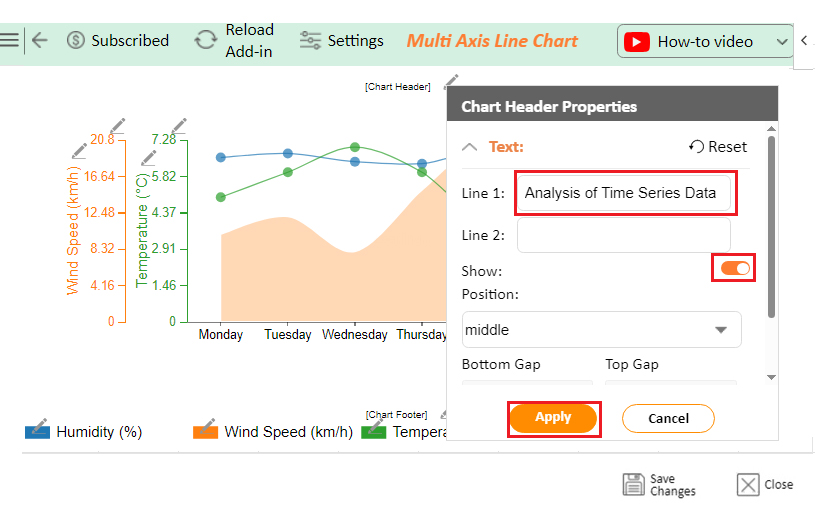
Let’s analyze the examples of time series data sets below using ChartExpo.

Day Temperature (°C) Humidity (%) Wind Speed (km/h)
Monday 5 80 10
Tuesday 6 82 12
Wednesday 7 78 8
Thursday 6 77 15
Friday 4 85 20
Saturday 5 83 10
Sunday 6 80 18
  • To get started with ChartExpo, install ChartExpo in Excel.
  • Now Click on My Apps from the INSERT menu.
insert chartexpo in excel
  • Choose ChartExpo from My Apps, then click Insert.
open chartexpo in excel
  • Once it loads, scroll through the charts list to locate and choose the “Multi-Axis Line Chart”.
search multi axis line chart in excel
  • Click the “Create Chart From Selection” button after selecting the data from the sheet, as shown.
Click Create Chart From Selection After Learning What is Times Series Data
  • ChartExpo will generate the visualization below for you.
Initial Visual After After Learning What is Times Series Data
  • If you want to add anything to the chart, click the Edit Chart button:
  • Click the pencil icon next to the Chart Header to change the title.
  • It will open the properties dialog. Under the Text section, you can add a heading in Line 1 and enable Show.
  • Give the appropriate title of your chart and click the Apply button.
Add Chart Header After Learning What is Times Series Data
  • Change the precision value of the Humidity value to zero and add the percentage sign:
Change Precision Value of Humidity Value After Learning What is Times Series Data
  • Change the precision value of Temperature to zero:
Change Precision Value of Temperature Value After Learning What is Times Series Data
  • Change the precision value of Wind Speed to zero and add the (km/h) sign:
Change Precision Value of Wind Speed Value After Learning What is Times Series Data
  • Change the Legend shapes into a Line and Circle, and click the “Apply” button.
Change Legend Shapes of Humidity After Learning What is Times Series Data
  • Change the Legend shapes to Column and click the “Apply” button.
Change Legend Shapes of Temperature After Learning What is Times Series Data
  • Click on Settings and change the “Data Representation” as follows.
Change Data Representation After Learning What is Times Series Data
  • Click the “Save Changes” button to persist the changes made to the chart.
Click Save Changes After Learning What is Times Series Data
  • Your final Multi Axis Line Chart will look like the one below.
Final What is Times Series Data

Insights

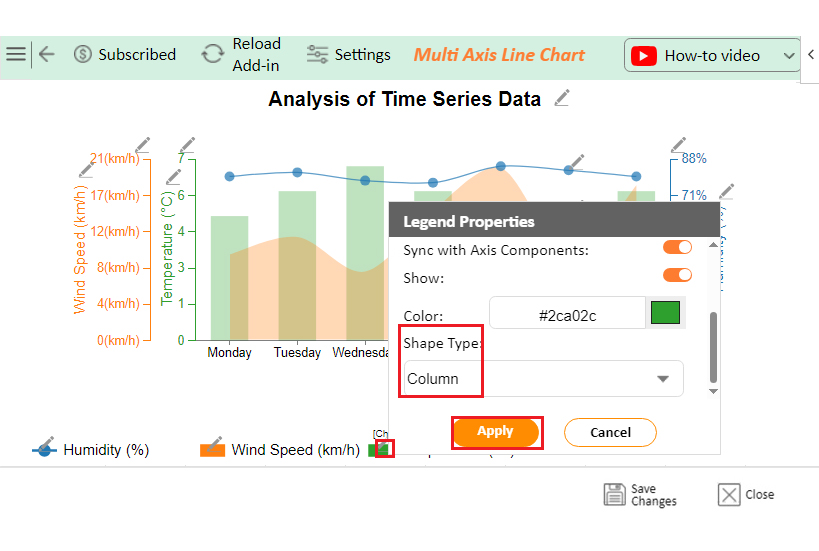
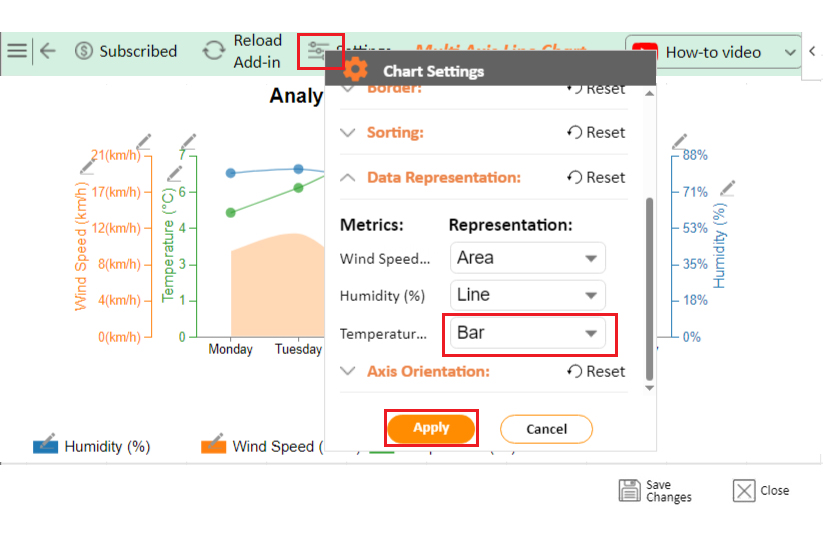
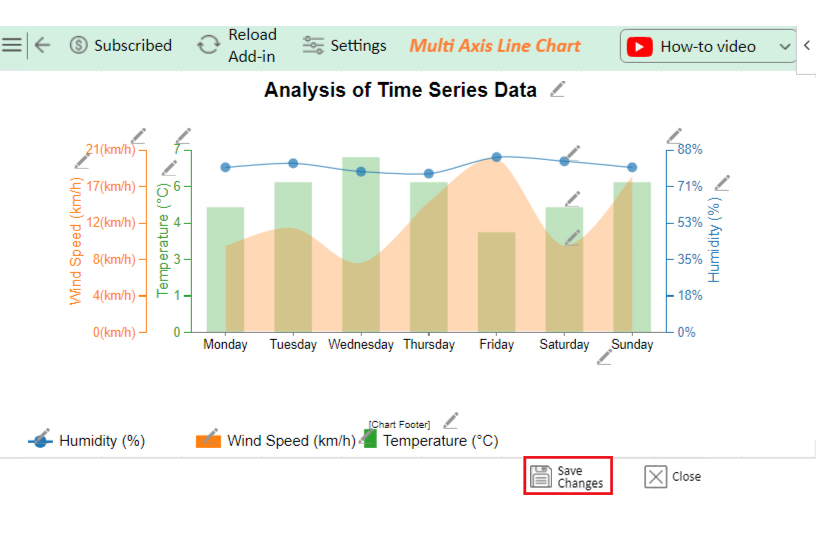
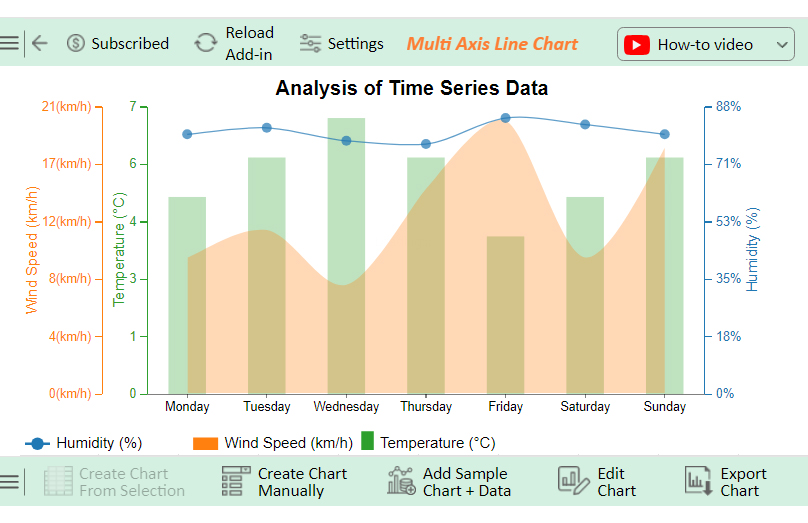
The data indicates fluctuations in temperature, humidity, and wind speed across a span of seven days.

  • The temperature fluctuates between 4°C and 7°C.
  • The humidity varies from 77% to 85%.
  • The wind speed ranges from 8 km/h to 20 km/h, reaching its highest point on Friday and Sunday.

Transform Your Trend Forecasting with Mastery of Time Series Data in Microsoft Excel:

This video will explain what time series data is, a fundamental concept for analyzing and forecasting trends over time. Incorporate this understanding into your data analysis to enhance your ability to interpret and predict patterns effectively.

Advantages of Time Series Analysis

Time series analysis is a powerful tool that can transform raw data into actionable insights. Let’s explore the key advantages of using time series analysis:

  • Pattern recognition: Time series analysis helps identify patterns and trends in data. Recognizing these patterns helps to understand seasonal effects, cyclical behaviors, and long-term trends. This knowledge is invaluable for strategic planning.
  • Forecasting: Using historical data, time series analysis can predict future values. This is essential for budgeting, inventory management, and market predictions.
  • Data-driven decision-making: Time series analysis enables data-driven decision-making. Analyzing past data informs evidence-based decisions, reducing reliance on intuition and guesswork.
  • Anomaly detection: It’s excellent for detecting anomalies or outliers. Identifying unusual patterns early can help prevent potential issues, such as fraud detection in finance. Or fault detection in manufacturing.
  • Understanding relationships: Time series analysis can uncover relationships between different variables over time. For example, it can show how sales are affected by marketing campaigns or seasonal changes, helping to optimize strategies.
  • Optimization: It aids in optimizing processes and operations. Analyzing time series data helps to identify inefficiencies and areas for improvement, leading to cost savings and increased productivity.

What are the Challenges of Time Series Analysis?

Time series analysis is a powerful tool, but it comes with its own set of challenges. Let’s explore some common hurdles and how they impact your analysis:

  • Non-stationarity: Time series data often exhibits trends and seasonality, making it non-stationary. Non-stationary data can skew results, making it hard to model accurately.
  • Missing data: Missing data points are common in time series. They can disrupt the continuity of the data, leading to inaccurate analysis.
  • Seasonality and cycles: It is challenging to identify and account for seasonality and cyclic patterns. These patterns can mask underlying trends and complicate forecasting.
  • High dimensionality: Time series data can have multiple variables, leading to high dimensionality. Managing and analyzing such complex data requires sophisticated techniques and can be computationally intensive.
  • Outliers: Outliers can distort the results of time series analysis. Detecting and handling these anomalies is crucial to ensure accurate modeling.
  • Noise and irregularities: Noise and irregularities in data can obscure meaningful patterns.
  • Data volume: Processing and analyzing large volumes of time series data can be overwhelming. Efficient storage, processing, and analysis techniques are essential to handling big data.
  • Model selection: Choosing the right model for time series analysis is critical. With numerous models available, selecting the one that best fits your data can be challenging. Model comparison and validation are key steps in this process.
  • Overfitting: Overfitting occurs when a model is too complex and captures noise instead of the underlying pattern. Regularization techniques and cross-validation help prevent overfitting.
  • Real-time analysis: Real-time analysis of time series data requires fast and efficient processing. Implementing real-time systems involves challenges in data handling and computational power.

What are Time Series Analysis Best Practices?

To overcome the complexities of time series analysis effectively, it’s important to follow best practices. Here are some tips to ensure your analysis is robust and accurate:

  • Ensure data quality: Clean your data by addressing missing values, outliers, and noise. High-quality data forms the foundation of accurate analysis.
  • Understand the data: Familiarize yourself with the data’s characteristics. Plot the data and look for trends, seasonality, and patterns. Understanding the data helps you select the appropriate analytical methods.
  • Check for stationarity: Check if your data is stationary, and if not, use techniques like differencing or transformation to stabilize it.
  • Feature engineering: Create relevant features that can enhance your model’s predictive power. Lag features, rolling statistics, and date-related features can provide valuable insights.
  • Model selection: Based on your data and objectives, choose the right model. Compare different models using criteria like AIC, BIC, and cross-validation scores. The right model fits the data well without overfitting.
  • Data splitting: Split your data into training and testing sets. This helps in evaluating the model’s performance on unseen data and prevents overfitting.
  • Cross-validation: Use cross-validation techniques to assess model performance. Cross-validation provides a more reliable estimate of model accuracy by averaging performance across multiple subsets of data.

FAQs

What is meant by time series data?

Time series data consists of observations recorded sequentially over time. It captures how a variable changes at different time points. For instance, daily stock prices, monthly sales figures, or yearly temperature readings. Each data point is time-stamped.

What is a time series data set example?

An example of a time series data set is daily stock prices. Each entry includes the date and corresponding stock price. This data set helps analyze trends, patterns, and seasonal effects in the stock market over time.

How do we deal with time series data?

To deal with time series data:

  1. Collect and preprocess data, handling missing values.
  2. Visualize data for trends and patterns.
  3. Ensure stationarity.
  4. Choose and train an appropriate model.
  5. Evaluate and tune the model.

Wrap Up

Time series data is a collection of observations recorded sequentially over time. These data points are spaced at consistent intervals, such as daily, monthly, or yearly. Time series data is crucial for identifying trends, patterns, and cycles in various fields.

The unique aspect of time series data is its temporal ordering. This chronological arrangement allows analysts to understand how variables change over time. It also aids in predicting future values based on historical trends.

Trend analysis is a key use of time series data. By examining long-term movements, businesses and researchers can make informed decisions. Trends can be upward, downward, or stable, providing valuable insights into future behaviors.

Seasonality is another important component. It refers to regular, repeating patterns within specific periods. Understanding seasonality helps in planning for predictable fluctuations, such as higher retail sales during holidays.

Time series data is also used for anomaly detection. Identifying unusual patterns or outliers can prevent potential issues. For example, it can detect fraud in financial transactions or faults in manufacturing processes.

In summary, time series data is essential for various applications. Its temporal nature allows for trend analysis, seasonality detection, and anomaly identification. By leveraging time series data, organizations can make data-driven decisions and plan effectively for the future. Whether in finance, retail, or research, understanding and analyzing time series data provides a significant advantage.

How much did you enjoy this article?

ExcelAd2
Start Free Trial!
137956

Related articles

next previous
Microsoft Excel8 min read

Excel Task Tracker Template for Smarter Task Insights

Task tracker template in Excel organizes tasks, tracks deadlines, and boosts efficiency. Learn its benefits, and explore expert tips to simplify task management.

Microsoft Excel10 min read

Invoice Tracker Template in Excel for Better Insights

An invoice tracker Excel template helps track invoices, due dates, and payments. Learn how to use this template for better financial management.

Microsoft Excel12 min read

Key Performance Indicators in Healthcare for Better Insights

Key Performance Indicators in healthcare track patient care and efficiency. Learn about these KPIs, top examples, and how to use them to improve outcomes.

Microsoft Excel10 min read

BMI Calculation Formula in Excel for Better Fitness Insights

The BMI calculation formula in Excel helps track and analyze body mass index. Explore step-by-step instructions and tips to simplify BMI tracking in Excel.

Microsoft Excel29 min read

How to Create a Tornado Chart in Excel? A Complete Guide

Click to learn how to plot a Tornado Chart in Excel using easy-to-follow steps. Also, we’ll address the following question: what is a Tornado Diagram?

ChartExpo logo

Turn Data into Visual
Stories

CHARTEXPO

  • Home
  • Gallery
  • Videos
  • Services
  • Pricing
  • Contact us
  • FAQs
  • Privacy policy
  • Terms of Service
  • Sitemap

TOOLS

  • ChartExpo for Google Sheets
  • ChartExpo for Microsoft Excel
  • Power BI Custom Visuals by ChartExpo
  • Word Cloud

CATEGORIES

  • Bar Charts
  • Circle Graphs
  • Column Charts
  • Combo Charts
  • Comparison Charts
  • Line Graphs
  • PPC Charts
  • Sentiment Analysis Charts
  • Survey Charts

TOP CHARTS

  • Sankey Diagram
  • Likert Scale Chart
  • Comparison Bar Chart
  • Pareto Chart
  • Funnel Chart
  • Gauge Chart
  • Radar Chart
  • Radial Bar Chart
  • Sunburst Chart
  • see more
  • Scatter Plot Chart
  • CSAT Survey Bar Chart
  • CSAT Survey Chart
  • Dot Plot Chart
  • Double Bar Graph
  • Matrix Chart
  • Multi Axis Line Chart
  • Overlapping Bar Chart
  • Control Chart
  • Slope Chart
  • Clustered Bar Chart
  • Clustered Column Chart
  • Box and Whisker Plot
  • Tornado Chart
  • Waterfall Chart
  • Word Cloud
  • see less

RESOURCES

  • Blog
  • Resources
  • YouTube
SIGN UP FOR UPDATES

We wouldn't dream of spamming you or selling your info.

© 2025 ChartExpo, all rights reserved.