Categories
By ChartExpo Content Team
Let’s talk about something that can seriously change how you approach your team’s productivity: the velocity chart. If you’ve ever struggled with managing team sprints or predicting project timelines, this chart could be the tool you’ve been missing.
It’s not just numbers on a graph—it’s your go-to guide for seeing how much work your team is completing over time. With the right approach, a velocity chart can help you plan smarter and keep your projects on track.
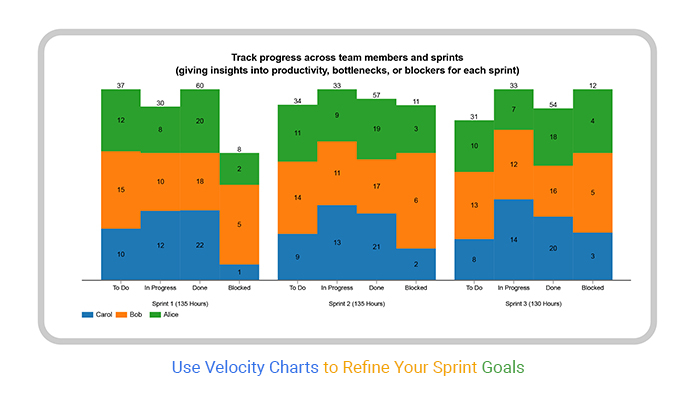


A velocity chart shows you how much work your team finishes in each sprint, often measured in story points or hours. It tracks completed tasks across sprints, giving you a clear picture of your team’s capacity. This allows you to predict future performance based on past data, helping you make informed decisions when planning upcoming sprints.
The key to making a velocity chart work for you is understanding what it’s telling you—and what it’s not. It’s not about speed for speed’s sake; it’s about steady progress. Fluctuations happen, but by tracking trends over time, you can use the velocity chart to improve planning and keep your team moving in the right direction.
First…
A velocity chart measures how much work a team completes in a sprint. It shows the amount of work in story points or hours across several sprints. This helps teams predict future performance by looking at past sprints.
A velocity chart is a visual tool used in Agile project management. It helps teams track how quickly they are completing work in each sprint. The chart displays the total work units finished in each sprint, allowing teams to do trend analysis and adjust their planning.
Velocity charts offer a clear picture of team productivity over time. By visualizing sprint outcomes, teams can spot productivity patterns and make informed decisions to improve efficiency.
Velocity charts do more than track numbers; they provide insights into team dynamics and workload management. They help teams understand their capacity and set realistic goals for future sprints.
Teams use velocity charts to plan future sprints more effectively. By understanding their average velocity, teams can better estimate how much work they can handle in upcoming sprints, leading to more accurate and achievable sprint goals.
Velocity and capacity are both critical in sprint planning, but they serve different purposes. Velocity is about the speed of completing work, while capacity measures the total amount of work a team can handle. Knowing both helps teams plan more effectively and avoid overcommitment.
Each column on a velocity chart represents a sprint from your project. The height of each column shows how much work was completed in that sprint. Tall columns are great—they mean you did a lot of work!
Short columns? They tell you that maybe things didn’t go as planned. It’s super helpful to compare these columns to see if your team’s performance is stable or if there are any wild swings you should talk about in your next team meeting.
Fluctuations in your velocity chart are totally normal, but it’s smart to understand why they happen. Maybe one sprint had a big, tough task that took longer than expected, or perhaps your team was smaller because someone was on vacation.
Sometimes, a drop in velocity might even be due to a public holiday. Recognizing these patterns helps you plan better and keeps everyone from panicking over normal ups and downs.
When you look at a velocity chart, don’t get too hung up on the short-term data. It’s the long-term trends that give you the real scoop. A slow but steady increase in the height of the bars over several sprints? That’s a good sign your team is becoming more efficient.
On the flip side, if the bars trend downward for several sprints, it might be time to dig deeper and find out how to get back on track. Use these insights to steer your team towards smoother sailing in future projects.
Velocity should guide future sprints, not judge past performance. It measures the pace at which teams complete tasks, which varies. Various factors like project complexity, team changes, or technical issues can alter velocity.
Using it as a performance indicator can mislead stakeholders about the team’s effectiveness and create unrealistic expectations. It’s important to view velocity as a flexible planning tool that helps adjust estimates and resources rather than a rigid performance measure.
Explaining velocity charts to non-technical team members is crucial for effective communication and project success.
Start with the basics: what a velocity chart is and what it represents. Emphasize that it shows the work completed in a sprint, not the quality or value of the work. Use simple analogies, like comparing it to tracking daily steps, to help stakeholders relate to the concept.
Ensuring everyone understands this tool fosters data-driven decision-making and aligns expectations.
Velocity data naturally fluctuates. Communicating these changes effectively is key to managing expectations. Always provide context when presenting velocity data. Explain why fluctuations happen—be it due to a tough problem in the sprint or a team member’s absence.
Regular updates and clear explanations prevent stakeholders from drawing false conclusions from the data.
Also, emphasize that some variability in velocity is normal and doesn’t necessarily signal a problem. This approach helps maintain trust and keeps everyone informed and realistic about project timelines and outcomes.
Ever seen a car zoom past only to break down later?
That’s what happens in projects too. Pushing too hard and too fast can lead to burnout and mistakes. The quality drops, and nobody wants that. It’s better to go steady and make sure everything’s right than to rush and trip up.
It’s not all about ticking boxes. What really matters is the value you bring to the table. Instead of just gathering story points like they’re badges, focus on making a real impact. Think about what your work does for others. That’s the real win!
Retrospectives aren’t just meetings; they’re your pit stops.
Use them to look back and see what worked and what didn’t. It’s your chance to fix things before you speed off again. Balancing speed and quality means knowing when to hit the gas and when to brake. Make those retrospectives count!
Scope creep, ah, the sneaky villain of project management! It slips in when additional features or tasks are added to a project without proper review. Utilizing a project status reports template can help manage these changes, providing a clear snapshot of progress and helping the team maintain focus on the original scope.
When your project scope expands unexpectedly, your velocity chart—your progress tracker—can look pretty sad. What to do? First, pause and evaluate. Understand the new requirements. Adjust timelines and resources. Communication is key here; make sure everyone’s on the same page.
Sometimes, you might need to push back a little. Remember, it’s okay to say no if it means saving the quality and timeliness of your project.
Interruptions happen. Maybe it’s a quick fix a client needs yesterday, or a software bug that pops up out of nowhere. These unplanned tasks can divert your team from their current sprint tasks. Document these interruptions meticulously. Who did what, for how long, and how did it impact the sprint?
Categorize these interruptions—technical debt, bugs, or ad-hoc requests—and plan how to tackle them in future sprints. By analyzing and interpreting data on these interruptions, you can better understand their impact and be prepared, not scared, as you address them in upcoming sprints.
Your velocity chart is your project’s heartbeat, showing the rhythm of your team’s work. When interruptions occur, it’s tempting to let these affect your velocity data. Don’t let them! Keep your velocity chart clean.
Record interruptions separately and discuss them in your sprint retrospectives. This keeps your data true and provides clear insights into your team’s actual capacity and speed. Remember, accurate data leads to better decision-making. So, keep those charts pure!
To fix inconsistent story point estimations, many teams use Planning Poker or T-shirt sizing. These methods help standardize how story points are assigned.
In Planning Poker, each team member uses cards to vote on story points, promoting discussion and leading to a consensus.
T-shirt sizing uses sizes like XS, S, M, L, XL to classify tasks based on complexity and effort. These techniques not only make the estimation process more fun but also enhance alignment within the team.
Calibrating story points is key to maintaining consistency. It involves regular check-ins and retrospectives where teams discuss past sprints and adjust their understanding of what constitutes a certain number of story points.
This ongoing process ensures everyone stays on the same page and estimations remain reliable. Over time, this calibration helps in refining the estimation process, making velocity a more stable metric.
Using large story points for tasks can seriously disrupt your velocity chart. Big chunks of points completing at unpredictable times can make velocity spike or drop, rather than showing a steady flow of work.
This makes it harder to predict future performance and plan accordingly. Keeping story points smaller and more granular helps in maintaining a smoother, more predictable velocity, which in turn aids in better sprint planning and resource allocation.
Here’s a fun fact: undercommitting isn’t a bad thing. In fact, it’s a smart move. Think about it—things go wrong, bugs pop up, meetings drag on.
If your sprint is maxed out from the start, there’s no wiggle room. By planning to do a bit less, you leave space for those “oops” moments. It’s like packing an umbrella—just in case. This approach keeps your team calm and focused, ready to tackle surprises without missing a beat.
Got data? Great, use it! Historical velocity data is gold when setting goals. This data shows what your team has accomplished in previous sprints. It’s a reality check.
Say your team typically completes 20 points per sprint. Setting a goal of 40 points next sprint? That’s a stretch. Stick close to what the data suggests. Over time, as your team grows and improves, these numbers will change. Adjust as you go, and you’ll keep your goals realistic.
Change doesn’t happen overnight. It’s all about small steps. Watch how your team’s velocity changes over time.
Maybe you’ve added new tools or team members have leveled up their skills. These changes can boost your velocity. Start by slightly increasing your sprint commitments. Don’t jump the gun; small increments are key. This gradual approach helps you adjust without overwhelming the team.
It’s like turning up the thermostat one degree at a time—you hardly notice the change, but it makes a difference.
Here’s a head-scratcher: why does changing sprint length throw off your velocity chart? Well, imagine you’re running laps. If one day you run on a 400-meter track and the next day on a 300-meter track, counting laps won’t directly tell how far you’ve run. The same goes for sprint lengths.
If the sprint is longer, naturally, the team might complete more tasks, inflating the velocity figure. To fix this, you need to adjust the numbers to make them comparable. It’s a bit like using a conversion chart when you’re cooking and need to switch from cups to liters.
Got different sprint lengths? No problem! You can normalize the velocity. Here’s a simple trick: choose a standard sprint length as your baseline—let’s say two weeks. Now, if you have a three-week sprint, multiply the velocity of this sprint by two-thirds. Why? Because you’re scaling down to your two-week “standard.”
Here’s the formula:
Normalized Velocity = (Original Velocity Standard Sprint Length) / Actual Sprint Length
This way, you get a velocity that pretends everything happened in your standard two-week sprint.
When you’re juggling multiple sprint lengths (maybe some projects run on a one-week sprint while others last a month), keep a cheat sheet handy. Use the normalization formula to convert all sprint velocities to your chosen standard. This allows you to line them all up neatly for comparison—no more guessing games!
Rolling averages smooth out data fluctuations, providing a clearer picture of a team’s performance trend. By averaging the work completed over multiple cycles, you can forecast future capabilities more reliably. This method helps in anticipating the pace at which a team can work, considering both their best and typical performances.
External factors such as holidays and staffing changes can significantly impact project timelines. By incorporating these variables into your velocity analysis, you can create more realistic forecasts.
For example, if key team members are on holiday, you might predict a slower cycle and adjust deadlines accordingly.
Using historical velocity data is like having a roadmap for your project. It allows you to set realistic timelines based on how your team has performed under similar conditions in the past. This approach not only improves accuracy but also sets realistic expectations, helping to maintain team morale and client trust.
Velocity charts are great for showing how fast tasks are tackled, but they miss out on the interactions between tasks. It’s like knowing the speed of cars on a highway but not seeing the traffic jams ahead. You need more to pinpoint where the real problems lie.
Think of it as adding seasoning to your favorite dish. Velocity charts give the base flavor, but cumulative flow diagrams and burndown charts add that extra zing.
Cumulative flow diagrams provide a snapshot of task progress over time, showing you where tasks pile up.
Burndown charts, on the other hand, show you how much work remains versus the plan. Together, they offer a fuller picture, making it easier to spot where things are getting sticky.
Velocity trends can be sneaky. They show a smooth journey, but don’t let that fool you. Look for variations in the velocity over time — sudden drops or spikes. These can signal that something’s up.
It’s like noticing your car sputters sometimes; it’s a clue something might need a closer look. By keeping an eye on these trends alongside your cumulative flow and burndown charts, you can catch those hidden inefficiencies that velocity alone won’t reveal.
When you spot a velocity spike, the first step is to figure out if it’s due to improved efficiency or just rushed work. Look at the recent changes in team processes or tools—has anything new been introduced that might genuinely speed things up?
If not, you might be looking at a case where the team is hurrying through tasks, which isn’t sustainable and risks the project’s success.
Sometimes, smaller, simpler tasks can inflate velocity. These tasks are quick to complete, giving the illusion of progress and productivity. But are these tasks adding real value or just padding the stats?
It’s crucial to evaluate the impact of these tasks on the overall project. Are they essential steps, or could they be streamlined or even eliminated?
Familiarity with tasks can lead to more accurate estimates, as the team knows exactly what to expect and how long tasks should take.
However, overfamiliarity might also lead to complacency, where tasks are underestimated in complexity or time required.
This misjudgment can skew velocity and affect project timelines and deliverables. Always double-check estimates against actual outcomes to ensure they remain realistic.
The following video will help you create a Clustered Stacked Column Chart in Microsoft Excel.


The following video will help you to create a Clustered Stacked Column Chart in Google Sheets.
Think about the last time you started a new game. You didn’t win immediately, right? New team members are the same. They need a warm-up phase, a ramp-up time before they’re scoring goals. This isn’t idle time; it’s an investment.
By allowing newbies to get up to speed, you’re setting the stage for future wins. It’s all about patience and a bit of coaching. So, give them the time they need to learn the ropes. Before you know it, they’ll be game changers.
Let’s say you’re on a road trip. If you add a detour to see the world’s largest rubber band ball, you wouldn’t expect to arrive at your original time, right?
It’s similar when new team members come aboard. You’ll need to adjust your velocity expectations. Don’t expect to hit the same milestones at the usual pace—at least not at first. This adjustment means recalibrating your timelines and being flexible with deadlines. It’s all part of the journey, ensuring everyone is synced up and speeding along together soon enough.
Adding a new ingredient to your grandma’s secret stew recipe can change the flavor, and similarly, new team members can alter the pace and quality of work in the long run. This isn’t a bad thing!
Over time, fresh ideas and skills can spice things up and might even increase the team’s overall velocity. It’s crucial to monitor these trends, keeping an eye on how things evolve. Are projects speeding up? Is the quality going up a notch?
Understanding these patterns will help you harness the full potential of your reinvigorated team.
One of the main reasons teams hit a velocity plateau is due to a lack of new challenges. When tasks become repetitive, boredom kicks in, and efficiency takes a hit.
Another common roadblock is outdated processes that no longer fit the team’s needs. These are just a few hurdles that might be stopping your team from speeding up.
To get past these blocks, start by identifying what exactly is slowing your team down. Is it unclear roles or perhaps a communication gap? Once you spot these issues, tackle them head-on.
Streamline your workflows, clear out unnecessary steps, and ensure everyone knows their part. This proactive approach keeps your team moving forward without unnecessary stops.
Now, let’s talk about a tool that can rev up your team’s engine: value stream mapping.
This technique helps you see where delays happen and why. By mapping out every step of your process, you can pinpoint where things are getting stuck and figure out how to fix them. It’s like having a roadmap that shows you the fastest route to your goal.
Think of each team as having its own ‘recipe’ that makes up its flavor of work. This includes how they communicate, tackle problems, and manage workflow. Because of this unique mix, the velocity—essentially the speed and efficiency of a team—varies widely.
What’s speedy for one team might be a slow day for another. This isn’t about one team being better or worse; it’s about recognizing that each team plays a different game. Comparing their velocities is like comparing apples to, well, pineapples!
Here’s a better approach: focus on a team’s past performance and track their progress over time. It’s like a runner aiming to beat their own best time rather than worrying about the next person’s record.
This internal comparison helps teams stay focused on their growth without getting sidetracked by irrelevant benchmarks. Plus, it fosters a positive environment where teams are motivated to improve for their own sake, not just to outdo someone else.
Start by setting a baseline—think of it as the ‘home base.’ From there, track how the team evolves. This isn’t about setting a universal standard but about understanding what ‘good’ looks like for that particular team.
As they grow and improve, adjust the baseline. It’s a bit like adjusting the difficulty level in a video game; as you get better, you make it a bit harder to keep things challenging and interesting.
Big teams can make velocity tracking feel like herding cats. Each member might pull in a different direction, making it hard to gauge the true pace and progress of the team. Also, the sheer volume of tasks and interactions grows exponentially, which can cloud the overall picture of how fast things are moving.
The trick here is to split the big team into smaller groups, each with its own velocity chart. Think of it as organizing a big party into smaller tables, making it easier to manage and ensuring everyone gets their slice of cake (or piece of the project, in this case).
This method helps maintain clarity in tracking and improves the accuracy of velocity measurements.
Here’s where it gets interesting. While each team has its own chart, they need to play nicely together.
Instead of each team just racing ahead with blinders on, they must also look around and coordinate with others. It’s less about individual team velocity and more about how all teams move together towards the common goal.
Think relay race rather than solo sprint—passing the baton smoothly is key.
Velocity is a measure of how quickly a team can complete work in a sprint, usually quantified by the number of tasks or story points completed.
On the other hand, capacity refers to the maximum amount of work your team can handle without overextending themselves. It takes into account factors like holidays, team size, and individual work hours.
Effective sprint planning involves aligning your team’s velocity with their capacity. Start by reviewing past sprints, perhaps using goal chart templates to visualize progress and estimate future velocity. Then, adjust the workload to fit within the team’s capacity, ensuring each member has manageable tasks that directly contribute to the project’s goals.
This balance helps maintain a steady pace without overloading your team.
To refine your sprint planning, track capacity separately from velocity.
This means recording the actual hours spent on tasks versus the estimated hours. Such tracking helps identify when a team might be overloaded before it becomes a problem, allowing for timely adjustments in workload distribution. This proactive approach prevents burnout and keeps your team’s morale high.
A decline in the speed of project delivery doesn’t automatically point to performance issues. Consider this: if a team slows down to address critical customer feedback or to refine their processes, this can lead to superior outcomes. This scenario shows progress as it lays a stronger foundation for future tasks.
Factors like burnout, changes in team composition, or modifications in workflow can affect velocity. Recognizing these elements helps in understanding the context of a slowdown. Addressing these factors often leads to a more energized and cohesive team, which is crucial for long-term goals.
Constantly pursuing high speed can lead to burnout and reduced quality. Achieving a consistent pace ensures sustainable progress and maintains team morale. It’s better to move steadily and ensure everything is done right than to rush and make mistakes that cost time to rectify later.
Relying solely on simple averages for velocity predictions can lead to misjudgments.
This method assumes uniformity in sprint performance, which is rarely the case. Projects often encounter unforeseen challenges and changes, making each sprint unique. Simple averages overlook these fluctuations, leading to potential misinterpretations of a team’s capacity and speed.
To overcome the limitations of simple averages, weighted averages and rolling data offer a more refined approach.
Weighted averages prioritize recent sprints, reflecting more current team performance and project conditions.
Rolling data, observing the last few sprints, provides a dynamic view of team velocity, adjusting to recent trends and anomalies. This method ensures forecasts are grounded in the latest project realities.
Outliers in sprint data can skew average velocity calculations, leading to inaccurate forecasts. These anomalies might result from extraordinary circumstances that aren’t likely to recur. Identifying and adjusting for these outliers ensures they don’t disproportionately influence the average.
This adjustment helps maintain a realistic view of the team’s typical performance levels, supporting more precise planning and resource allocation.
Ignoring technical debt is like skipping car maintenance; it seems okay until the car breaks down. In software, this debt makes it hard to add new features or fix bugs, which can mess up your team’s speed or velocity.
Over time, the team might look slower, not because they’re not working hard, but because they’re bogged down by unresolved issues.
Sprint time isn’t just for new features. It’s smart to set aside time for refactoring, which is tech talk for cleaning up code to make it better without changing how it works. This helps manage technical debt by fixing issues before they grow.
Think of it as housekeeping; it keeps your codebase healthy and speeds up future work.
Creating technical debt stories means writing down and prioritizing tech debt like regular project tasks. This makes it easier during sprint planning to see tech debt and deal with it systematically. It’s like adding a chore to your to-do list so it doesn’t get forgotten.
By planning this way, teams can tackle technical debt without disrupting their workflow too much.
It’s easy to get caught up in the numbers shown in a velocity chart. However, effective retrospectives require a deeper look at the processes behind those numbers. Discuss with your team how they approach their tasks and collaborate. Are there any steps in the workflow that consistently cause delays? Is everyone clear about their responsibilities?
By shifting the focus from numbers to processes, your team can uncover deeper insights about how they work together. This approach leads to more meaningful improvements that boost long-term productivity, rather than quick fixes that only inflate velocity temporarily.
Historical data from velocity charts is a treasure trove of information design. It allows teams to spot trends over multiple sprints. Look for patterns such as a gradual increase or decrease in velocity or fluctuations that correspond with specific events or changes within the team.
Once you identify these trends, dig deeper to understand what drives them. Are there recurring process inefficiencies? Perhaps certain tasks take longer than necessary or certain skills are lacking. Addressing these issues can smooth out the workflow and improve both speed and quality of work.
Velocity charts should not just be about how fast the team is working, but also about the quality of the output and the team’s morale. High velocity with poor quality or low team morale is unsustainable. During retrospectives, discuss how team members feel about their workload and the work environment. Are they feeling overworked? Is the fast pace affecting the quality of the outputs?
Aligning velocity with morale and quality requires adjustments in both management approaches and team practices. Sometimes, slowing down can result in faster long-term results and healthier team dynamics. Encourage open communication and ensure that team members feel valued not just for their speed, but also for their craftsmanship and well-being.
It’s key to find a balance. Sure, velocity metrics are helpful. They track progress. But they shouldn’t overshadow quality or team happiness.
When management places equal importance on quality outcomes and team satisfaction, it creates a healthier work environment. Teams thrive when they know that their well-being and the quality of their work are top priorities.
Let’s shift the focus a bit. Celebrating high velocity numbers alone? It’s like cheering only for those who run the fastest without tripping. But what about acknowledging the steady progress, or the smart solutions to tricky problems?
Celebrations should include various milestones and achievements, not just the speed of completion. This approach boosts everyone’s spirits and drives engagement.
Ever seen a sprinter run at full speed for a long distance? They can’t without burning out. The same goes for teams. Encouraging sustainable work practices is crucial. This means reasonable work hours, regular breaks, and a real emphasis on work-life balance. Sustainable practices ensure that the team remains productive and motivated without crashing from exhaustion.
When looking at your team’s velocity, think about the factors at play. Could it be changes in team size, skill levels, or maybe the tools you’re using? Maybe it’s the type of projects you’re tackling. Each factor sways your team’s output speed. It’s like figuring out why your car isn’t running as fast as it should – you need to check under the hood to see what’s going on.
Adjusting sprint goals based on recent data is more of an art than science. If your team has been speeding through tasks, it might be time to up the ante for the next sprint. But if tasks are dragging, consider scaling back. It’s all about finding that sweet spot where your team is challenged but not overwhelmed.
Think of it as tuning an instrument – too tight and it’ll snap, too loose and it won’t play right.
Deciding how to use velocity data is crucial. If you’re using it to plan sprints, it’s about predicting how much your team can handle in the future.
Think of it as your weather forecast, helping you plan for sunny days or storms. But if you’re measuring team performance, it’s more about looking back to see how the team did against expectations. It’s like checking your fitness tracker to see if you hit your 10,000 steps a day goal.
A velocity chart is your guide for understanding how well your team is handling their workload. It’s a simple yet powerful tool to track progress, identify trends, and improve your planning process. By keeping an eye on your team’s performance, you can make smarter decisions and set realistic goals for future sprints.
Remember, the velocity chart isn’t about hitting numbers for the sake of it. It’s about finding a sustainable pace that helps your team stay productive without burning out. Use it to balance your workload, adjust expectations, and keep everything running smoothly.
So, what’s next? Take the lessons from your velocity chart, apply them, and keep refining your approach. Keep it simple, keep it clear, and always aim for steady improvement. After all, a well-used velocity chart leads to better sprints—and better results.
How much did you enjoy this article?


Calculate accounts receivable turnover ratio to measure credit collection speed, improve cash flow, and strengthen your financial strategy. Read on!

Change Management KPIs are the key to tracking adoption, performance, and ROI during transitions. Find out which metrics matter. Read on!

Data collection methods and techniques determine the quality of every insight you act on. Explore key approaches for gathering reliable data. Read on!


