Categories
Picture this: you have a goal and a vision of where you want to be. It’s a lofty peak, seemingly impossible from where you stand. But fear not; goal chart templates are here to guide you. They offer a structured approach to tracking progress and staying accountable.


Research from the American Psychological Association suggests that setting clear, well-defined goals can significantly enhance motivation and productivity. And what better way to define and track your goals than with the aid of goal tracker chart templates? They break down your journey into manageable segments, keeping you focused and on track.
Now, imagine yourself conquering one milestone after another, each step taking you closer to your ultimate objective. Pure bliss!
And it’s not just about individuals; businesses, too, are tapping into the power of these templates. Companies that set and monitor specific, measurable goals for their teams report an increase in productivity.
It’s like witnessing a symphony conductor guiding each note to perfection. And guess what? Goal chart templates are the baton that orchestrates this harmonious productivity crescendo.
Are you ready to revolutionize your goal tracking?
Join us; let’s explore where dreams meet deadlines, the world of goal chart templates.
Definition: Goal chart templates are visual tools designed to outline, track, and communicate progress toward specific objectives. These templates, often created in software or graphic tools, include visual elements like graphs, charts, or timelines. They provide a structured framework for setting and monitoring goals, aiding in strategic planning and organizational alignment.
Goal chart ideas typically feature sections for defining objectives, key performance indicators (KPIs), milestones, and timelines. They streamline the goal-setting process by offering pre-designed layouts, and a waterfall chart is the best option because it’s easy to customize based on specific needs.
Using the goal chart ideas for goals is a strategic practice that transcends mere visualization. These goal chart formats play a pivotal role in contributing to goal achievement and organizational success.
Why?
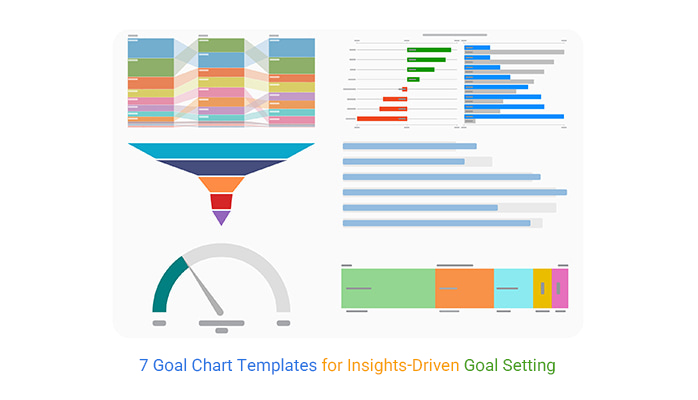
Goal graphics are visual tools that help track, measure, and present progress toward specific objectives. The three most common types are:
Each type serves a different purpose, so the right choice depends on whether you want to show overall completion, key steps, or quick status updates.
Here are some useful Goal Tracker Templates to inspire you.
Later in this blog, I will show you how to make one of these goal charts using ChartExpo.
Tracking goals effectively is pivotal for success, and a goal-setting template in Excel is vital in this endeavor. Here is a step-by-step guide to help you maximize the potential of a goal chart template:
Visualizing goal-tracking data is crucial for understanding progress and making informed decisions. However, while Excel is a powerful tool for Excel goal charts, its visualization capabilities often fall short. This leaves us with an uninspiring Excel goal chart and limited customization options.
This is where ChartExpo comes in, offering a revolutionary solution to Excel’s visualization limitations. With ChartExpo, creating appealing and insightful goal-tracking charts becomes effortless. This empowers us to track and analyze goals with precision and flair.
Let’s learn how to install ChartExpo in Excel.
The ChartExpo goal chart template Excel is available both in Google Sheets and Microsoft Excel. Please use the following CTAs to install the tool of your choice and create attractive visualizations with a few clicks in your favorite tool.


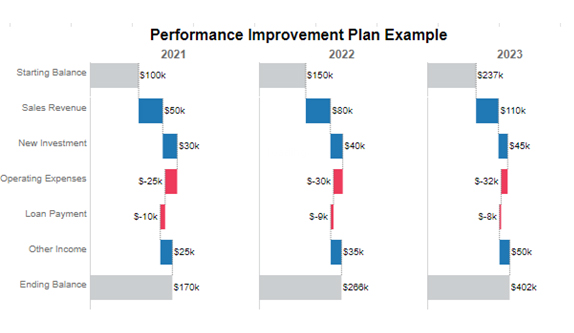
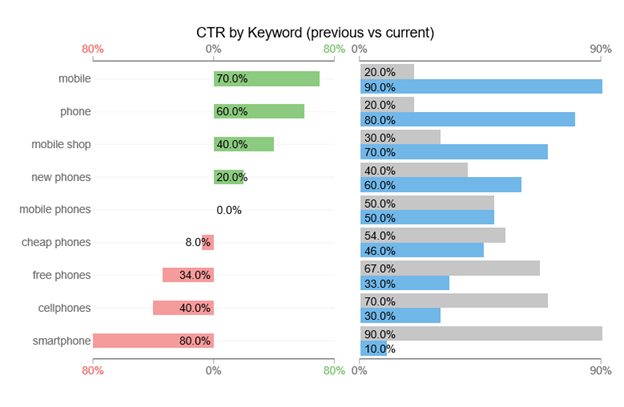
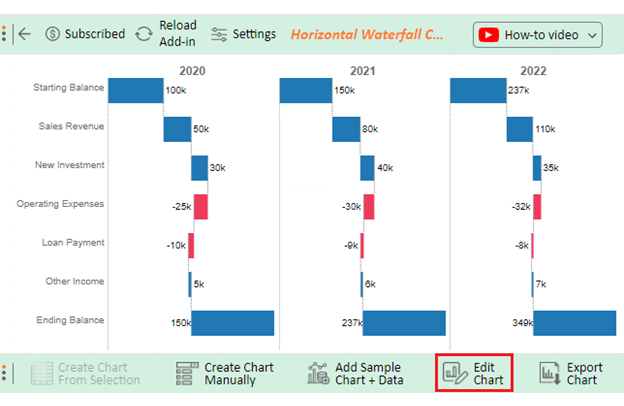
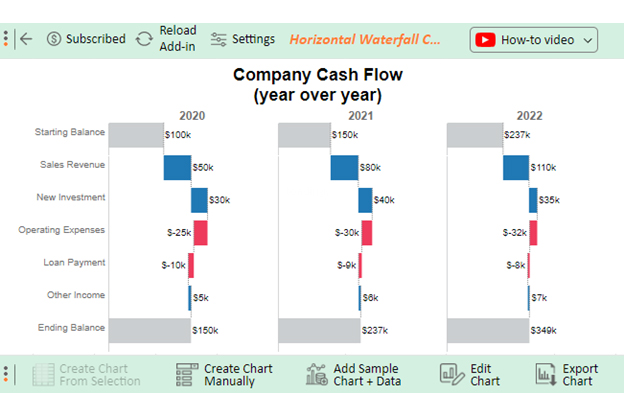
Let’s say you have the sample goal data tabled below. You can visualize this data in Excel using a goal tracker chart to make insight-gleaning effortless.
| Category | Year | Amount |
| Starting Balance | 2021 | 100,000 |
| Starting Balance | 2022 | 150,000 |
| Starting Balance | 2023 | 237,000 |
| Sales Revenue | 2021 | 50,000 |
| Sales Revenue | 2022 | 80,000 |
| Sales Revenue | 2023 | 110,000 |
| New Investment | 2021 | 30,000 |
| New Investment | 2022 | 40,000 |
| New Investment | 2023 | 45,000 |
| Operating Expenses | 2021 | -25,000 |
| Operating Expenses | 2022 | -30,000 |
| Operating Expenses | 2023 | -32,000 |
| Loan Payment | 2021 | -10,000 |
| Loan Payment | 2022 | -9,000 |
| Loan Payment | 2023 | -8,000 |
| Other Income | 2021 | 25,000 |
| Other Income | 2022 | 35,000 |
| Other Income | 2023 | 50,000 |
| Ending Balance | 2021 | 170,000 |
| Ending Balance | 2022 | 266,000 |
| Ending Balance | 2023 | 402,000 |
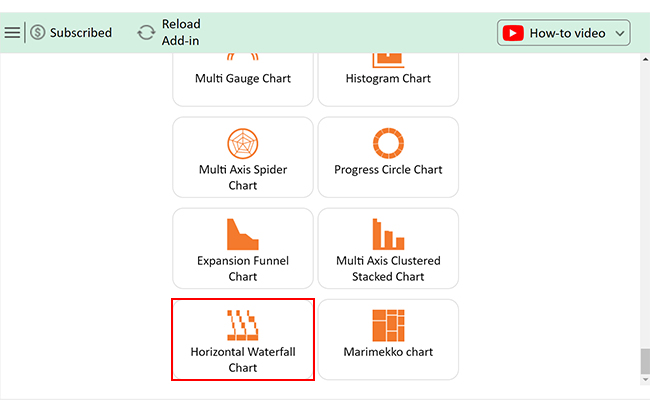
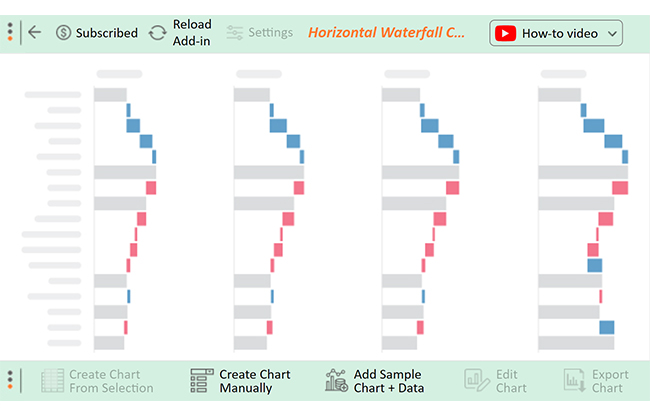
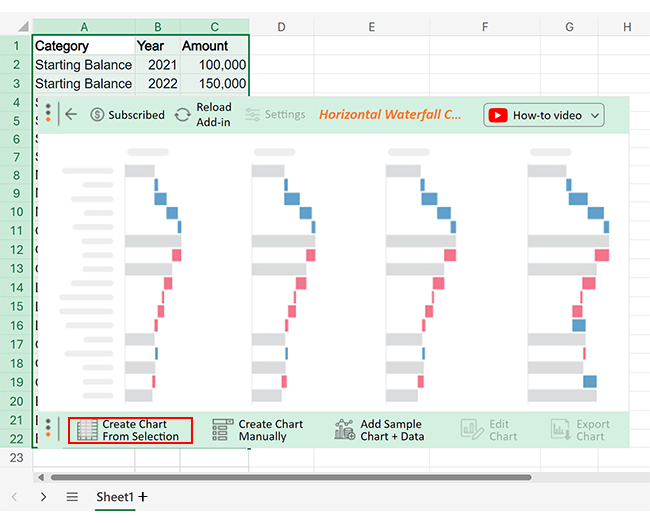
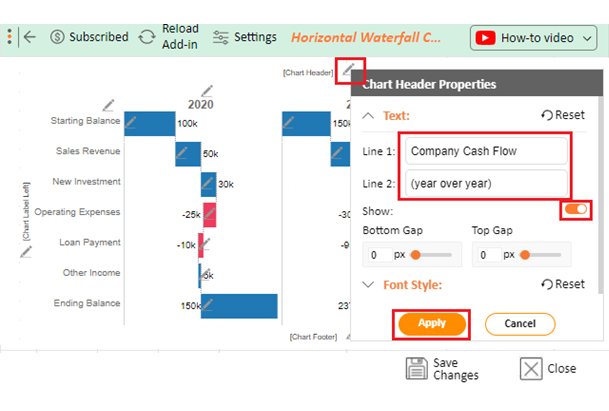
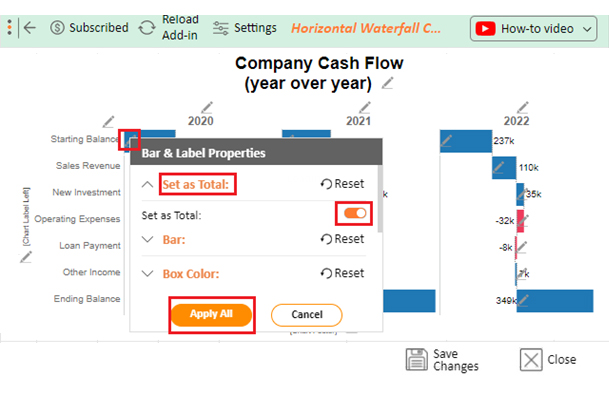
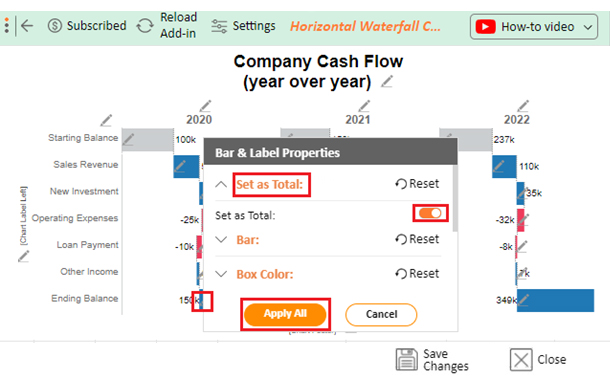
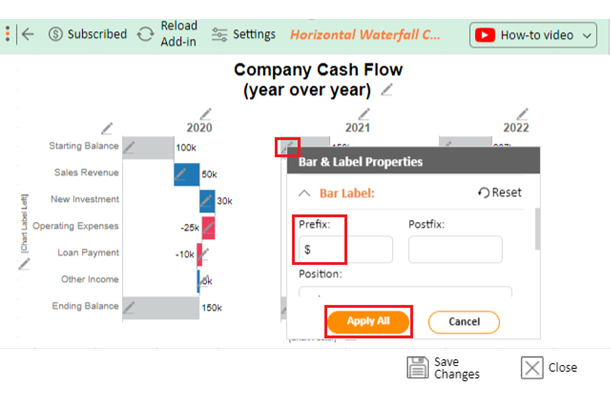
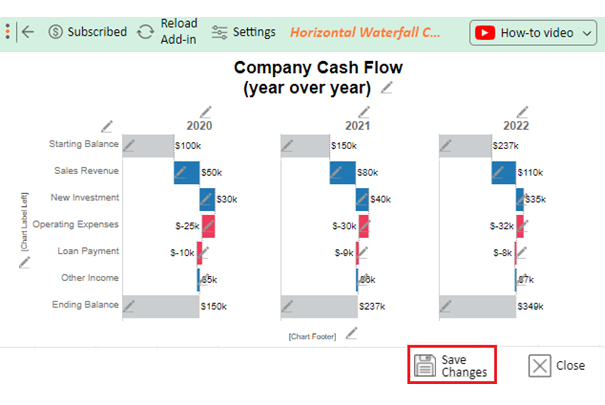
Follow these steps to create a goal chart template in Excel using ChartExpo and visualize your data.


A good goal planning chart template is simple, well-organized, and easy to customize. It should clearly outline goals, deadlines, and progress tracking in a visual format that’s quick to read. The best templates also include space for milestones and action steps, making it easier to stay focused and measure success over time.
Keeps all your goals, deadlines, and progress in one place for easy monitoring.
Helps you stay aligned with your priorities by breaking big goals into smaller tasks.
Visual progress tracking can inspire you to keep moving toward your targets.
Clarifies deadlines and milestones, making it easier to plan your schedule effectively.
Ideal for teams and managers to communicate objectives and track progress together.
Define specific targets with deadlines to make tracking meaningful.
Keep your chart current so it reflects your real progress and performance.
Apply colors or symbols to quickly highlight completed tasks, delays, or milestones.
Check your chart often to identify areas that need improvement and revise goals if necessary.
A smart goal-setting chart outlines objectives, key milestones, and progress toward achieving predetermined targets. It provides a clear and organized representation, aiding individuals or teams in tracking and attaining goals effectively.
To use a smart goal chart, define clear objectives, identify key metrics, and choose a suitable chart type. Set baseline and targets, regularly update data, visualize achievements, and review progress. Adjust strategies based on analysis, celebrate milestones, communicate progress, and iteratively improve the chart for ongoing effectiveness.
The first step in creating a goals chart is to define clear and specific objectives. Ensure they are measurable, achievable, and time-bound (SMART). This foundational clarity sets the stage for creating a comprehensive and effective visual representation of your goals.
The use of goal chart templates is a strategic imperative in the pursuit of success. These templates transcend aesthetics and become powerful tools for steering organizations and individuals toward desired outcomes.
The clarity bestowed by goal diagram templates is transformative. They distill complex objectives into tangible, understandable components, providing a roadmap for progress. In the business landscape’s fast-paced dynamics, this visual clarity guides us through the intricacies of goal achievement.
Motivation, an intangible force, finds a tangible form in these templates. Visualizing milestones and progress sparks enthusiasm, turning the journey toward objectives into a series of achievable steps. The chart becomes a visual record of success, fostering a positive and forward-looking mindset.
Communication, often a challenge in goal setting, becomes streamlined and effective through chart templates. Complex information is condensed into a visual language that resonates universally. This clarity aids in transparent communication, ensuring everyone is on the same page regarding goals and progress.
In essence, goal diagram templates are not just organizational tools but catalysts for transformation. They enhance clarity, motivate action, foster alignment, streamline communication, and facilitate progress tracking.
Do not hesitate.
Embrace goal-tracking templates with ChartExpo today to turn aspirations into reality.
How much did you enjoy this article?


Calculate accounts receivable turnover ratio to measure credit collection speed, improve cash flow, and strengthen your financial strategy. Read on!

Change Management KPIs are the key to tracking adoption, performance, and ROI during transitions. Find out which metrics matter. Read on!

Data collection methods and techniques determine the quality of every insight you act on. Explore key approaches for gathering reliable data. Read on!


