• Home
  • Tools dropdown img
    • Spreadsheet Charts

      • ChartExpo for Google Sheets
      • ChartExpo for Microsoft Excel
    • Power BI Charts

      • Power BI Custom Visuals by ChartExpo
    • Word Cloud

  • Charts dropdown img
    • Chart Category

      • Bar Charts
      • Circle Graphs
      • Column Charts
      • Combo Charts
      • Comparison Charts
      • Line Graphs
      • PPC Charts
      • Sentiment Analysis Charts
      • Survey Charts
    • Chart Type

      • Box and Whisker Plot
      • Clustered Bar Chart
      • Clustered Column Chart
      • Comparison Bar Chart
      • Control Chart
      • CSAT Survey Bar Chart
      • CSAT Survey Chart
      • Dot Plot Chart
      • Double Bar Graph
      • Funnel Chart
      • Gauge Chart
      • Likert Scale Chart
      • Matrix Chart
      • Multi Axis Line Chart
      • Overlapping Bar Chart
      • Pareto Chart
      • Radar Chart
      • Radial Bar Chart
      • Sankey Diagram
      • Scatter Plot Chart
      • Slope Chart
      • Sunburst Chart
      • Tornado Chart
      • Waterfall Chart
      • Word Cloud
    • Google Sheets
      Microsoft Excel
  • Services
  • Pricing
  • Contact us
  • Blog
  • Support dropdown img
      • Gallery
      • Videos
      • Contact us
      • FAQs
      • Resources
    • Please feel free to contact us

      atsupport@chartexpo.com

Categories
All Data Visualizations Data Analytics Surveys
Add-ons/
  • Google Sheets
  • Microsoft Excel
  • Power BI
All Data Visualizations Data Analytics Surveys
Add-ons
  • Google Sheets
  • Microsoft Excel
  • Power BI

We use cookies

This website uses cookies to provide better user experience and user's session management.
By continuing visiting this website you consent the use of these cookies.

Ok

ChartExpo Survey


Home > Blog > Data Analytics

Real Estate Financial Planning Explained Through Charts

Real Estate Financial Models give you the numbers, forecasts, and scenarios you need to make confident property investment decisions. Without them, you’re working on instinct instead of insight, and that’s risky when the stakes run into the millions.

Real Estate Financial Model

These models project income, expenses, and cash flows over time. They show you how a property will perform under different conditions and give you a clear sense of return on investment. They help you see the gap between a “good” deal and a deal that meets your exact requirements.

Whether you’re evaluating a single rental or a multi-property portfolio, the right Real Estate Financial Models can show you how to structure financing, what risks to watch for, and when to sell. Google Sheets makes them easy to build, share, and update. Add visual tools, and you can turn even the busiest spreadsheet into something you and your partners can interpret in seconds.

In this guide, you’ll see exactly what these models are, why they’re important, the different types you can build, and the steps to create and analyze them. You’ll also see a real example in Google Sheets using ChartExpo, complete with a Sankey Chart that makes your data instantly understandable.

Table of Contents:

  1. What are Real Estate Financial Models?
  2. Why Real Estate Financial Modeling is Important?
  3. Types of Real Estate Financial Modeling
  4. Key Components of a Real Estate Financial Model
  5. Step-by-Step Process to Real Estate Financial Modeling
  6. How to Analyze a Real Estate Financial Model in Google Sheets?
  7. Benefits of Commercial Real Estate Financial Modeling
  8. Use Cases for Rental Property Financial Models
  9. Best Practices of Real Estate Private Equity Modeling
  10. FAQs
  11. Wrap-up

What are Real Estate Financial Models?

Definition: Real Estate Financial Models are structured spreadsheets that forecast future income, expenses, cash flows, and returns for property investments. They’re built to account for the specific realities of residential, commercial, and private equity real estate.

A complete build often includes 3-statement financial modeling, which connects the income statement, balance sheet, and cash flow statement. In real estate, it also layers in metrics such as Net Operating Income (NOI), Internal Rate of Return (IRR), and Capitalization Rate (Cap Rate).

You can use a Real Estate Financial Model for a small residential deal or a large commercial acquisition. In either case, the structure is the same, and assumptions, operating data, financing schedules, and return calculations you can adjust as conditions change.

Why Real Estate Financial Modeling is Important?

When you invest in property, you deal with large sums and relatively illiquid assets. A bad call is expensive. With real estate financial modeling, you’re not guessing; you’re projecting.

  • Risk Management – Simulate interest rate hikes or rent declines to see the impact before it happens.
  • Investor Confidence – Show lenders or equity partners a transparent, forecast-based view.
  • Strategic Planning – Align purchase, hold, and exit plans with financial targets.
  • Performance Tracking – Benchmark actual results against projections and adjust as needed.

Models don’t remove risk, but they do give you a clearer picture of where that risk lies.

Types of Real Estate Financial Modeling

  • Development

A development model runs feasibility before you commit to breaking ground. It includes property details, timelines, and cost breakdowns, then calculates potential returns.

If your Real Estate Financial Model shows low profit margins at target occupancy, you know to revisit assumptions before securing financing.

  • Acquisition

An acquisition model compares the profitability of buying an existing property under different scenarios. It accounts for purchase price, closing costs, rehab expenses, appreciation, operating costs, and projected income.

It also shows you how a quick resale might perform compared to a long-term hold.

  • Cash Flow

A cash flow model checks if rental income covers operating expenses and still leaves a profit. It factors in rent, vacancies, operating costs, and capital expenditures.

This type of Real Estate Financial Model helps ensure you remain cash-positive even when expenses rise.

  • Sensitivity Analysis

A sensitivity model tests changes in interest rates, purchase price, or loan amounts to see the effect on returns. This approach is essential in reports on financial analysis for property investments.

You can build best-case, base-case, and worst-case scenarios, giving you clarity on how resilient your deal is.

Key Components of a Real Estate Financial Model

Every strong Real Estate Financial Model contains:

  • Assumptions Tab – Purchase price, rent growth, vacancy rates, operating costs.
  • Operating Statement – NOI calculations.
  • Debt Schedule – Loan details, often shown via a Google Sheets amortization schedule.
  • Cash Flow Projection – Acquisition, operation, and sale flows.
  • Returns Summary – IRR, Equity Multiple, Payback Period.
  • Sensitivity Tables – Varying rents, cap rates, and exit dates.

You can create a financial performance analysis example in Google Sheets that combines these elements. In addition, don’t overlook financial metrics like Debt Service Coverage Ratio (DSCR) and Loan-to-Value (LTV), which help investors compare deals quickly.

Step-by-Step Process to Real Estate Financial Modeling

Step 1: Define your assumptions, property size, purchase price, financing terms, and sale value.

Step 2: For development projects, schedule construction spending over time rather than all at once.

Step 3: Enter operating assumptions, from simple rent × units formulas to detailed per-tenant projections.

Step 4: Build the pro forma statement, calculate NOI, subtract CapEx, and debt service to find equity cash flow.

Step 5: Calculate investment returns, focusing on IRR and cash-on-cash metrics.

Step 6: Test scenarios to see if the deal meets your target returns and acceptable risk range.

A Real Estate Financial Model built this way gives you clear numbers to act on.

How to Analyze a Real Estate Financial Model in Google Sheets?

Google Sheets offers flexibility, live collaboration, and integration with data sources. You can calculate returns, track rental income, and even pull live data feeds.

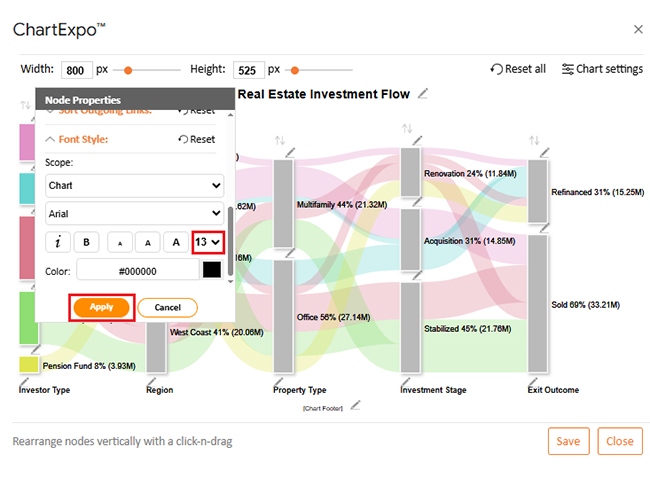
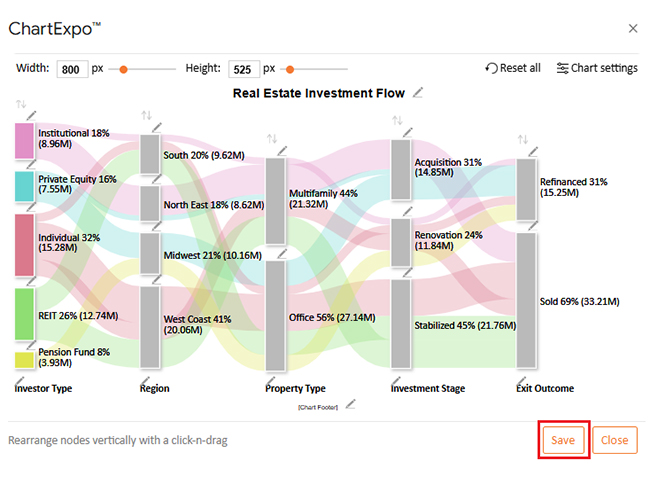
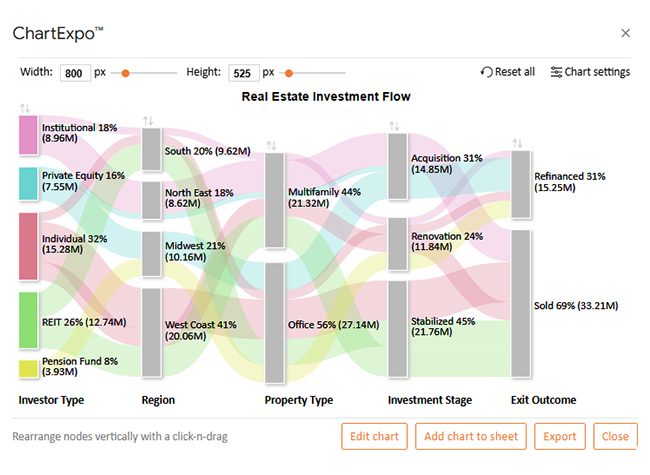
The challenge is making all those numbers understandable. That’s where ChartExpo can help, turning your Real Estate Financial Model into visuals that stakeholders can read at a glance.

Why Use ChartExpo?

  • Follow cash flow, ROI, and IRR visually over time.
  • Compare properties, lease types, or exit strategies.
  • Create visuals without coding.
  • Keep charts updated with live data via IMPORTDATA in Google Sheets.

This combination turns your Real Estate Financial Models from static spreadsheets into dynamic communication tools.

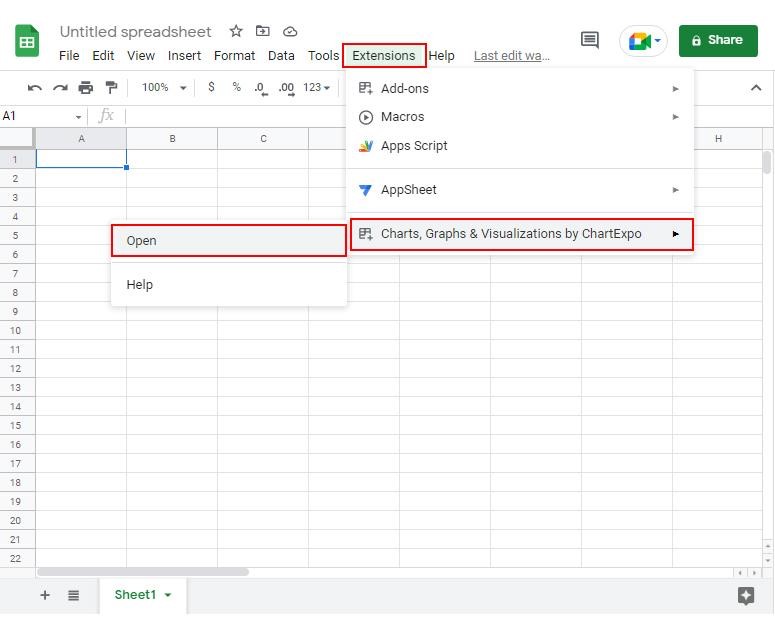
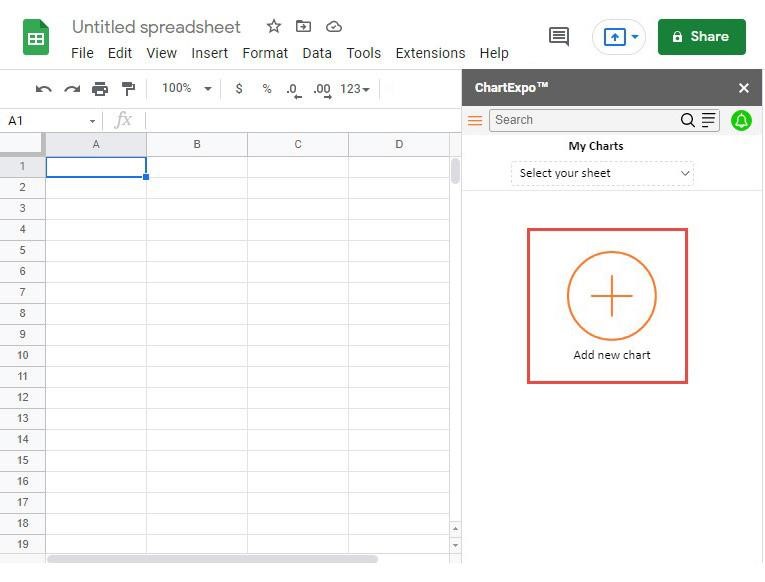
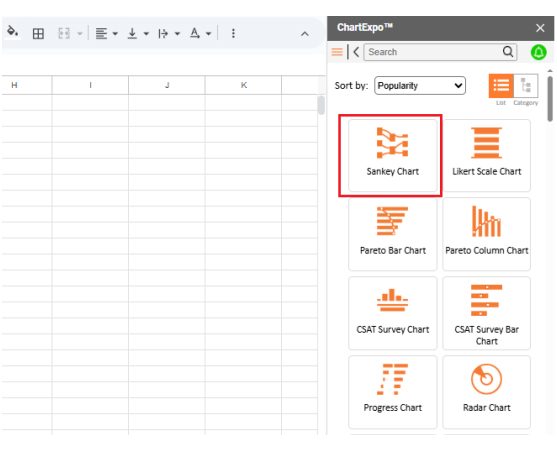
How to Install ChartExpo in Google Sheets?
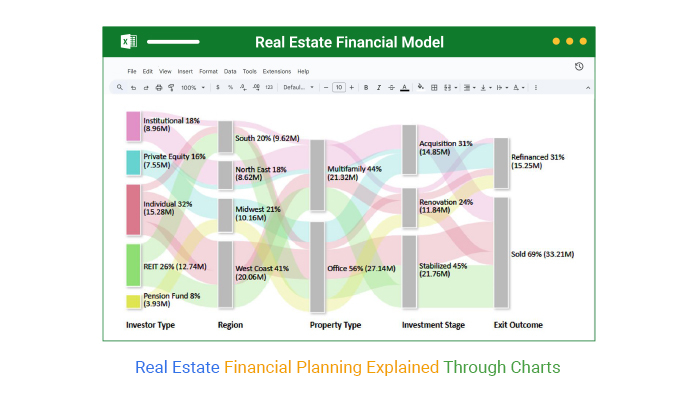
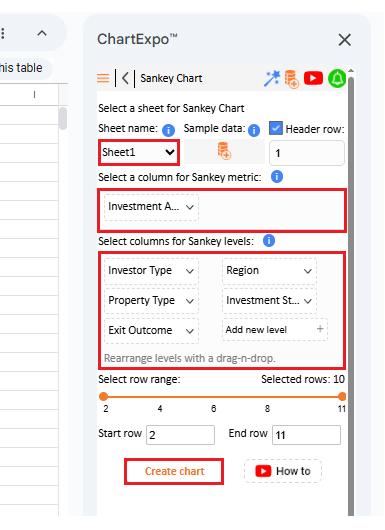
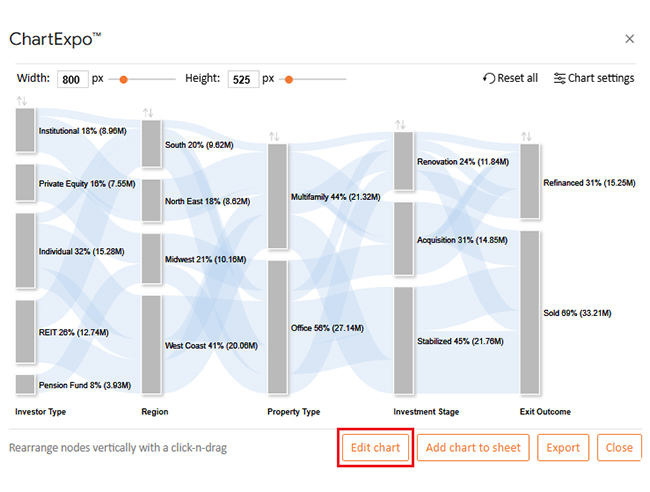
  1. Open Google Sheets and the file you want to use.
  2. Go to Extensions → Add-ons → Get add-ons.
  3. Search “ChartExpo” in Google Workspace Marketplace.
  4. Select “Charts, Graphs & Visualizations by ChartExpo” and click Install.
  5. Grant access and confirm your account.

Example

Here’s the dataset for our Sankey Chart:

Investor Type  Region  Property Type  Investment Stage  Exit Outcome  Investment Amount (USD) 
Institutional  South  Multifamily  Renovation  Refinanced  1,657,139 
Private Equity  Midwest  Office  Acquisition  Refinanced  6,231,546 
Individual  West Coast  Office  Stabilized  Sold  9,020,491 
Individual  West Coast  Multifamily  Renovation  Sold  4,143,481 
Private Equity  North East  Multifamily  Acquisition  Refinanced  1,320,886 
REIT  South  Office  Stabilized  Sold  5,847,322 
Pension Fund  Midwest  Office  Renovation  Refinanced  3,928,145 
Institutional  North East  Multifamily  Acquisition  Sold  7,301,219 
Individual  South  Office  Renovation  Refinanced  2,114,378 
REIT  West Coast  Multifamily  Stabilized  Sold  6,893,200 
  • Open ChartExpo from Extensions to begin working with your Real Estate Financial Model visually.
Real Estate Financial Model
  • Click the “Add new Chart” button to start building your visualization.
Real Estate Financial Model
  • Scroll to find and select the “Sankey Chart” option.
Real Estate Financial Model
  • Pick your sheet, choose metrics and dimensions, then click “Create Chart.”
Real Estate Financial Model
  • Click “Edit Chart” to customize the output.
Real Estate Financial Model
  • Change the chart’s title using the pencil icon and apply the change.
Real Estate Financial Model
  • Adjust bar colors by clicking the pencil icon on the bar, selecting a new color, and applying it.
Real Estate Financial Model
  • Increase font size for easier reading.
Real Estate Financial Model
  • Click “Save” to keep your changes.
Real Estate Financial Model
  • Review the final Sankey Chart to see investment flows clearly.
Real Estate Financial Model

Key Insights

  • Office assets attracted 56% ($27.14M) of investment, more than multifamily properties.
  • West Coast held the top spot for investment at 41% ($20.06M).
  • Individual investors contributed 32% ($15.28M), with REITs next at 26% ($12.74M).
  • 69% ($33.21M) of projects ended with sales, making it the preferred exit.

Benefits of Commercial Real Estate Financial Modeling

With commercial real estate financial modeling, you can:

  • Attract investors by showing clear, data-backed projections.
  • Spot and remove waste to reveal hidden profit potential.
  • Review lease escalations and expirations in detail.
  • Model multiple sale scenarios before committing to one.
  • Compare multiple properties with consistent visuals.

Use Cases for Rental Property Financial Models

A rental property financial model isn’t just for seasoned investors. It’s useful for:

  • New landlords are deciding if a purchase meets ROI goals.
  • Realtors analyzing properties for clients.
  • Startups pitching to investors with credible financial forecasting for startups.
  • Private investors are comparing returns between markets.
  • Developers securing construction funding.

In many cases, these models include a Google Sheets amortization schedule so you can see repayment timelines and interest breakdowns clearly.

Best Practices of Real Estate Private Equity Modeling

With real estate private equity modeling, follow these practices:

  • Use discrete waterfall structures to outline partner profit splits.
  • Run scenario simulations to measure risk levels.
  • Strengthen assumptions with Google Sheets’ artificial intelligence features for real-time insight.
  • Build modular acquisition, financing, and asset management components for efficiency.

FAQs

What are the three main sheets in a typical real estate financial model?

  • Assumptions & Inputs
  • Pro Forma Income & Expense Schedule
  • Summary Cash Flow & Returns

What is the DCF model in real estate?

The Discounted Cash Flow model forecasts future cash flows and discounts them to present value using a target rate. It’s a core method for valuing property investments.

Wrap-up

Real Estate Financial Models turn property investing from guesswork into planned execution. With 15–20 years of industry use, they’ve proven their value in showing exactly how a deal is likely to perform.

From development to acquisition, cash flow to sensitivity analysis, each model type plays a specific role. The right Real Estate Financial Model, built in Google Sheets and presented with visuals, helps you decide when to buy, how to finance, and when to exit.

In a market that shifts quickly, your ability to update assumptions and see the impact instantly is critical. Use these models, combine them with solid data and clear presentation, and you’ll approach every property decision with focus and confidence.

How much did you enjoy this article?

GSAd1
Start Free Trial!
153103

Related articles

next previous
Data Analytics10 min read

How to Create Analytical Report Template in Excel?

Discover ready-to-use Analytical Report Templates that simplify data analysis, highlight trends, and provide actionable business insights.

Data Analytics7 min read

Quality KPIs: A Practical Approach to Tracking Success

Quality KPIs help you measure, track, and improve product and service performance for consistent results and higher customer satisfaction.

Data Analytics8 min read

How to Prioritize Tasks for Better Productivity and Insights

How to Prioritize Tasks in Google Sheets with practical steps, charts, and examples to organize work, reduce stress, and achieve better results.

Data Analytics13 min read

Monthly Finance Report with Charts for Better Insights

Learn what a monthly finance report is, why it matters, and how to create one to track business performance and make informed financial decisions.

Data Analytics14 min read

Monthly Budget Examples: Unveiling Key Expense Insights

Explore detailed monthly budget examples and uncover essential principles for financial management. Start budgeting effectively for a brighter financial future.

ChartExpo logo

Turn Data into Visual
Stories

CHARTEXPO

  • Home
  • Gallery
  • Videos
  • Services
  • Pricing
  • Contact us
  • FAQs
  • Privacy policy
  • Terms of Service
  • Sitemap

TOOLS

  • ChartExpo for Google Sheets
  • ChartExpo for Microsoft Excel
  • Power BI Custom Visuals by ChartExpo
  • Word Cloud

CATEGORIES

  • Bar Charts
  • Circle Graphs
  • Column Charts
  • Combo Charts
  • Comparison Charts
  • Line Graphs
  • PPC Charts
  • Sentiment Analysis Charts
  • Survey Charts

TOP CHARTS

  • Sankey Diagram
  • Likert Scale Chart
  • Comparison Bar Chart
  • Pareto Chart
  • Funnel Chart
  • Gauge Chart
  • Radar Chart
  • Radial Bar Chart
  • Sunburst Chart
  • see more
  • Scatter Plot Chart
  • CSAT Survey Bar Chart
  • CSAT Survey Chart
  • Dot Plot Chart
  • Double Bar Graph
  • Matrix Chart
  • Multi Axis Line Chart
  • Overlapping Bar Chart
  • Control Chart
  • Slope Chart
  • Clustered Bar Chart
  • Clustered Column Chart
  • Box and Whisker Plot
  • Tornado Chart
  • Waterfall Chart
  • Word Cloud
  • see less

RESOURCES

  • Blog
  • Resources
  • YouTube
SIGN UP FOR UPDATES

We wouldn't dream of spamming you or selling your info.

© 2025 ChartExpo, all rights reserved.