• Home
  • Tools dropdown img
    • Spreadsheet Charts

      • ChartExpo for Google Sheets
      • ChartExpo for Microsoft Excel
    • Power BI Charts

      • Power BI Custom Visuals by ChartExpo
    • Word Cloud

  • Charts dropdown img
    • Chart Category

      • Bar Charts
      • Circle Graphs
      • Column Charts
      • Combo Charts
      • Comparison Charts
      • Line Graphs
      • PPC Charts
      • Sentiment Analysis Charts
      • Survey Charts
    • Chart Type

      • Box and Whisker Plot
      • Clustered Bar Chart
      • Clustered Column Chart
      • Comparison Bar Chart
      • Control Chart
      • CSAT Survey Bar Chart
      • CSAT Survey Chart
      • Dot Plot Chart
      • Double Bar Graph
      • Funnel Chart
      • Gauge Chart
      • Likert Scale Chart
      • Matrix Chart
      • Multi Axis Line Chart
      • Overlapping Bar Chart
      • Pareto Chart
      • Radar Chart
      • Radial Bar Chart
      • Sankey Diagram
      • Scatter Plot Chart
      • Slope Chart
      • Sunburst Chart
      • Tornado Chart
      • Waterfall Chart
      • Word Cloud
    • Google Sheets
      Microsoft Excel
  • Services
  • Pricing
  • Contact us
  • Blog
  • Support dropdown img
      • Gallery
      • Videos
      • Contact us
      • FAQs
      • Resources
    • Please feel free to contact us

      atsupport@chartexpo.com

Categories
All Data Visualizations Data Analytics Surveys
Add-ons/
  • Google Sheets
  • Microsoft Excel
  • Power BI
All Data Visualizations Data Analytics Surveys
Add-ons
  • Google Sheets
  • Microsoft Excel
  • Power BI

We use cookies

This website uses cookies to provide better user experience and user's session management.
By continuing visiting this website you consent the use of these cookies.

Ok

ChartExpo Survey


Home > Blog > Google Sheets

Google Sheets Artificial Intelligence to Discover Insights

Google Sheets Artificial Intelligence—how often do you think about it? Most people use spreadsheets daily, yet many overlook AI-powered features that boost efficiency. From automated data cleanup to predictive analysis, AI is changing how we handle numbers.

Google Sheets AI spots trends, suggests formulas and predicts outcomes. Whether managing sales, tracking expenses, or analyzing customer behavior, this AI turns raw data into insights. Moreover, integrating Google Forms into Google Sheets streamlines data collection, making analysis even faster.

Google Sheets Artificial Intelligence

Features like Smart Fill and formula suggestions save time by automating workflows. Instead of entering data manually, you get instant recommendations based on patterns. This minimizes errors and boosts productivity. A Google Sheets extension can further expand AI capabilities, enhancing automation and efficiency.

AI-powered tools improve precision by detecting anomalies and flagging inconsistencies. A simple miscalculation in financial reports can lead to significant setbacks. AI tools help prevent such mistakes, ensuring data integrity.

AI-driven analysis highlights key trends, helping teams make informed choices. Machine learning algorithms can also help you predict sales, optimize marketing strategies, and streamline operations. Visualizing trends with graph design ideas makes data-driven decisions more transparent and effective.

Artificial Intelligence transforms spreadsheets into dynamic tools that think, learn, and assist. From small businesses to global enterprises, AI-powered features make data work faster and wiser. The question isn’t whether AI is important—it’s how soon you’ll start using it.

Table of Contents:

  1. What is AI in Google Sheets?
  2. Why is Google Sheets AI Important?
  3. How to Use AI with Google Sheets?
  4. How to Use AI for Data Analysis with Google Sheets?
  5. Use Cases of AI for Google Sheets
  6. Advantages of Using AI for Google Sheets
  7. Tips for Using Artificial Analysis in Google Sheets
  8. FAQs
  9. Wrap Up

What is AI in Google Sheets?

Definition: AI in Google Sheets refers to artificial intelligence-powered features that enhance data processing, automation, and analysis within spreadsheets. These include tools like Smart Fill, formula suggestions, and Explore. These tools help users effortlessly identify trends, clean data, and generate insights.

AI-powered charts highlight key trends, while automatic translations break language barriers. Connected Sheets link massive datasets for deeper analysis. Moreover, you can use an AI-powered job application tracker template in Google Sheets to streamline job searches.

AI simplifies complex calculations, saving time, reducing mistakes, and boosting productivity. Google Sheets AI effortlessly turns raw data into more intelligent decisions.

Why is Google Sheets AI Important?

Google Sheets AI transforms how we work with data, making everything more efficient and accessible. It even enhances features like the Google Sheets Progress Bar for tracking tasks visually. With AI, managing and analyzing data becomes faster, smarter, and more intuitive.

How?

  • Task automation: AI automates repetitive tasks, freeing your time for more critical work. It can perform actions like data entry or formatting without you lifting a finger.
  • More intelligent data insights: AI quickly analyzes large datasets, offering more profound insights. It highlights key patterns and trends that could otherwise go unnoticed.
  • Better decision-making: You can trust AI to present clear, actionable insights that guide your next move. Real-time data analysis helps you make smarter decisions faster.
  • Simplified visualization: With AI, creating charts and graphs is straightforward. It automatically generates visuals that help you intuitively see the data.
  • Easy collaboration: Google Sheets AI enhances collaboration by allowing team members to work in sync. Everyone can update and access data in real-time, making teamwork seamless.

How to Use AI with Google Sheets?

Google Sheets AI makes working with data easier, faster, and wiser. It helps with market segmentation by identifying patterns in customer data. Whether you’re analyzing trends or automating tasks, AI can do the heavy lifting for you.

Here’s how you can use it:

  1. Explore data with natural language: Type a question in the “Explore” bar, and AI will instantly analyze your data. It provides answers, summaries, and chart suggestions without complex formulas.
  2. Automate data entry with bright fill: AI detects patterns in your data and automatically fills in missing values. This saves time, reduces errors, and ensures consistency in large datasets.
  3. Generate charts automatically: Highlight your data, and AI suggests the most relevant charts. Moreover, you can visualize trends and insights without manual formatting.
  4. Use add-ons and AI integrations: Google Sheets supports AI-powered add-ons that enhance data processing and predictions. Tools like machine learning extensions can help with advanced analytics.
  5. Leverage Google Apps Script for automation: Apps Script lets you automate repetitive tasks like generating reports or sending emails. AI-enhanced scripting makes Sheets smarter, handling complex workflows with minimal effort.
  6. Google Workspace AI features: Built-in AI features like smart suggestions and formula insights speed up your work. These tools help you use Google Sheets efficiently and accurately.

How to Use AI for Data Analysis with Google Sheets?

Data is everywhere, but making sense of it isn’t always easy. Strong data visualization brings numbers to life, making analysis more transparent and decisions smarter. However, Google Sheets falls short of creating advanced visuals.

Are you a business offering data and analytics services and need an advanced Clustered bar chart in Google Sheets? I have a solution for you: ChartExpo.

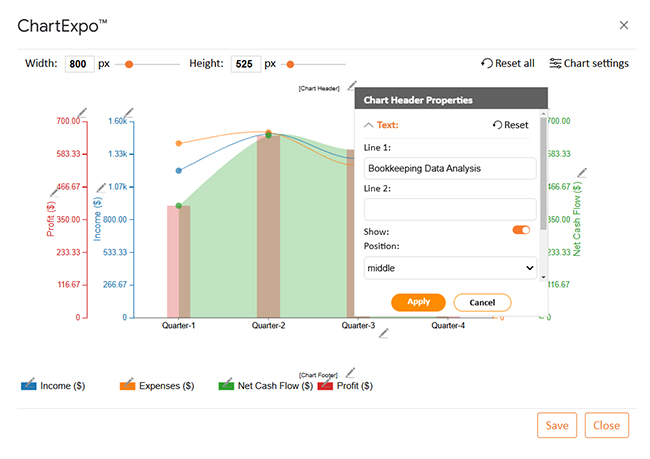
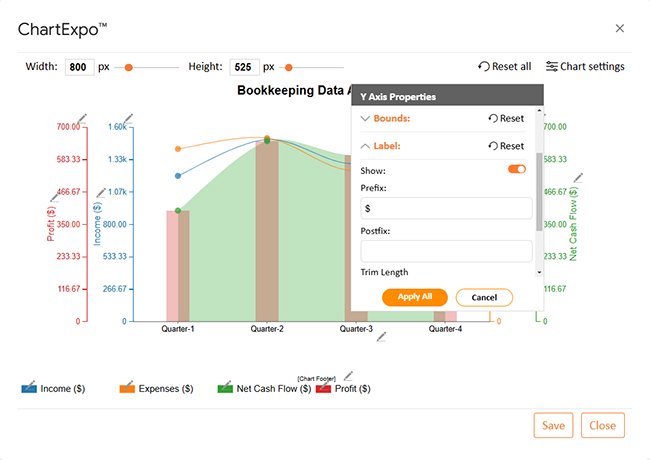
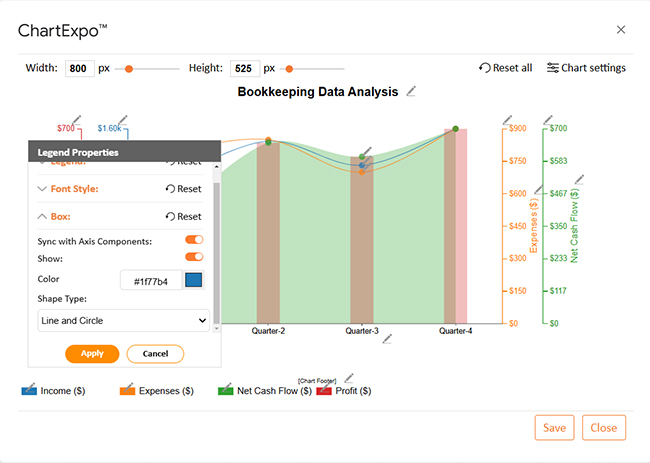
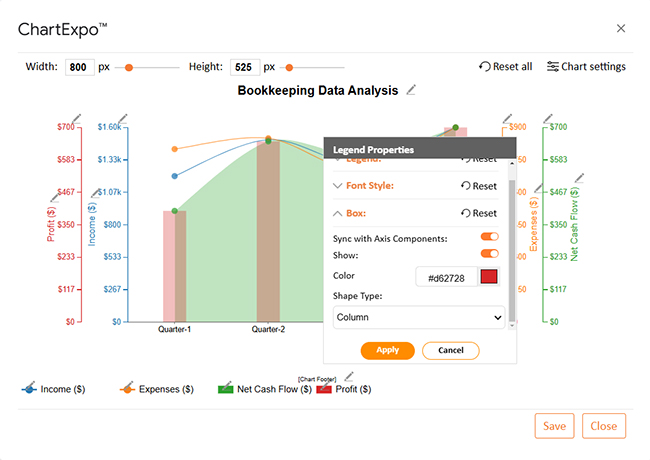
ChartExpo turns raw data into clear, engaging charts. With AI-powered insights and better visuals, decisions become more innovative and faster.

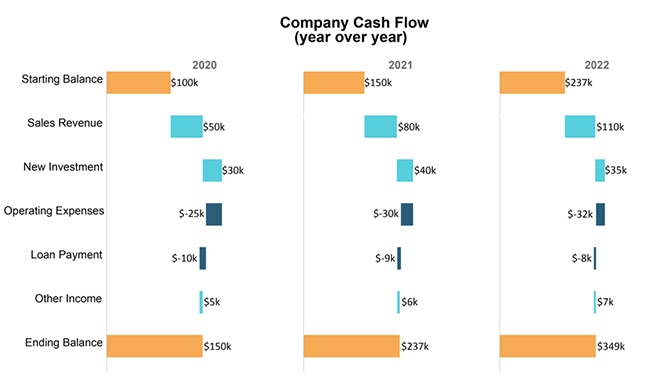
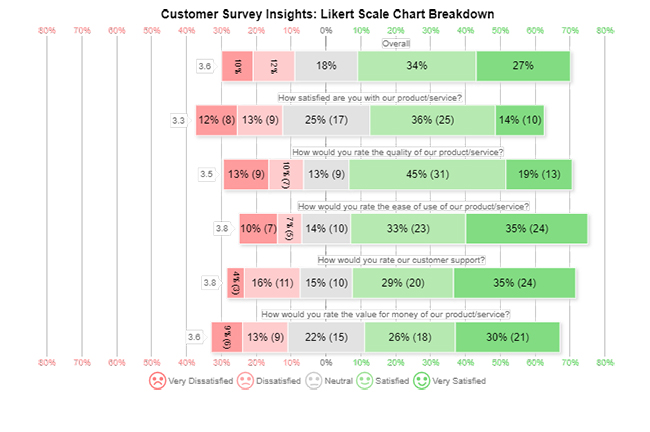
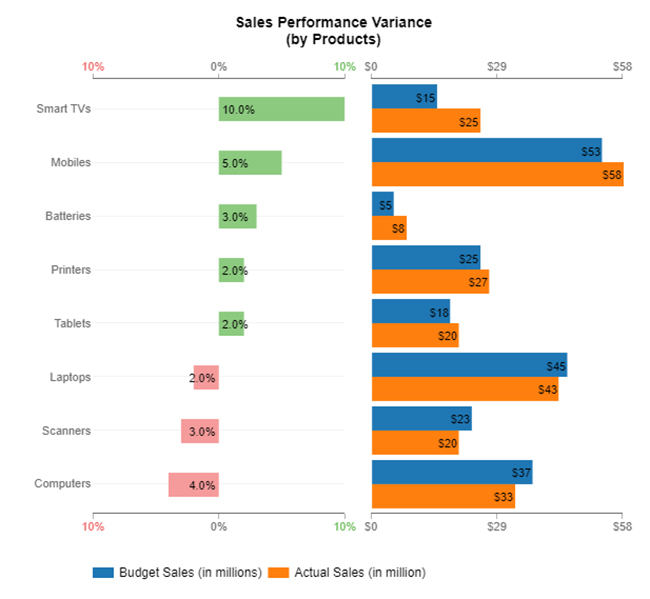
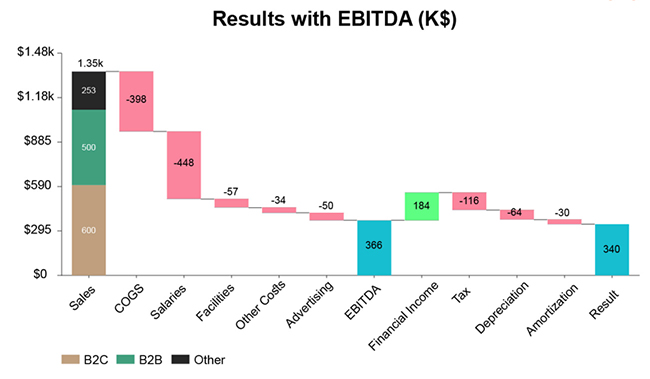
The charts below were created in Excel using ChartExpo:

Multi-Axis Line Chart

Google Sheets Artificial Intelligence

Horizontal Waterfall Chart

Google Sheets Artificial Intelligence

Likert Scale Chart

Google Sheets Artificial Intelligence

Progress Chart

Google Sheets Artificial Intelligence

Stacked Waterfall Chart

Google Sheets Artificial Intelligence

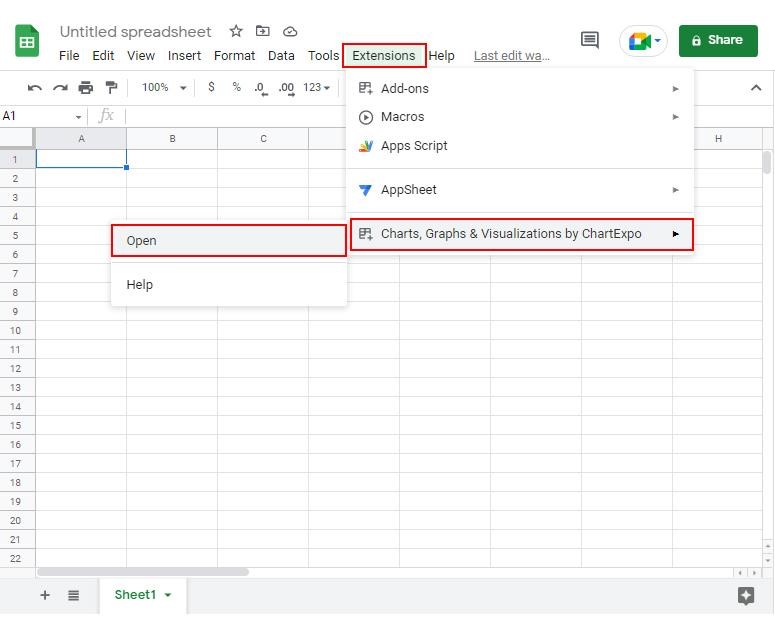
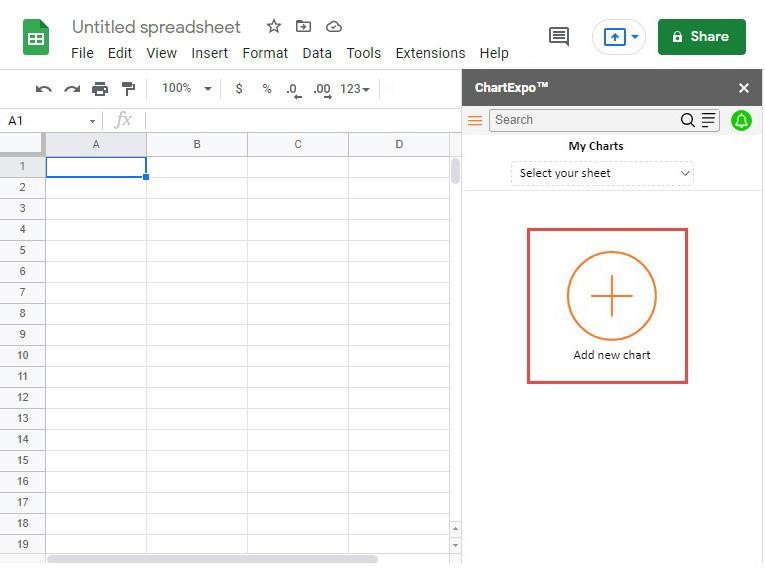
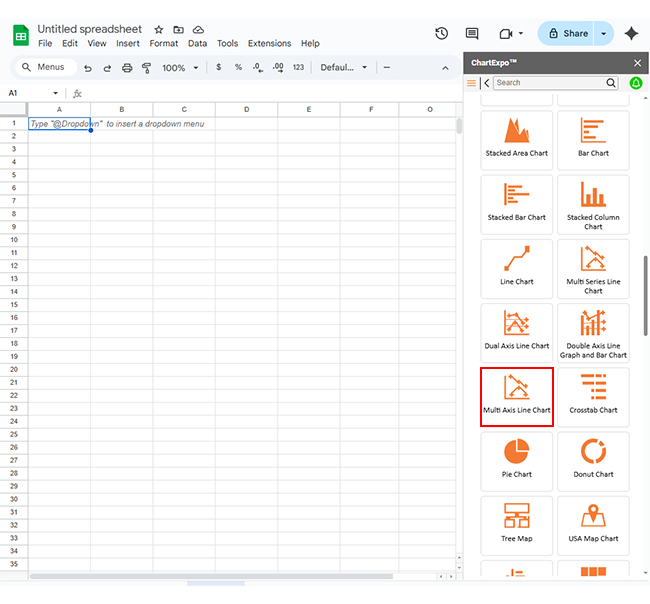
How to Install ChartExpo in Google Sheets?

  1. To start using ChartExpo, download it directly from the Google Sheets program. To do this, select Extensions from the top toolbar.
  2. A menu will appear. Click the Get add-ons option.
  3. Search for ChartExpo, and click on Charts, Graphs & Visualizations by ChartExpo when it appears in the results.
  4. Click the Install button. You will have to confirm your Google account and accept some permissions.

ChartExpo charts are available both in Google Sheets and Microsoft Excel. Please use the following CTAs to install the tool of your choice and create beautiful visualizations in a few clicks in your favorite tool.

Example

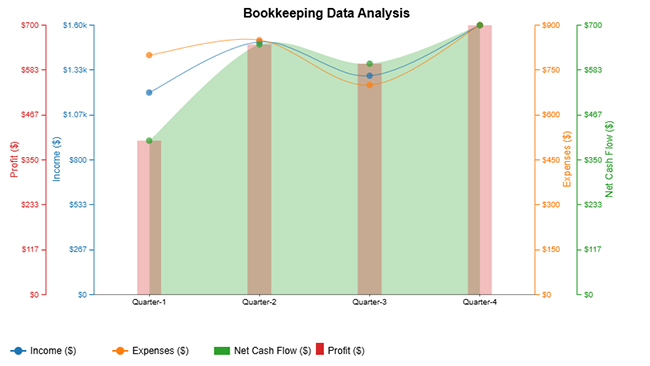
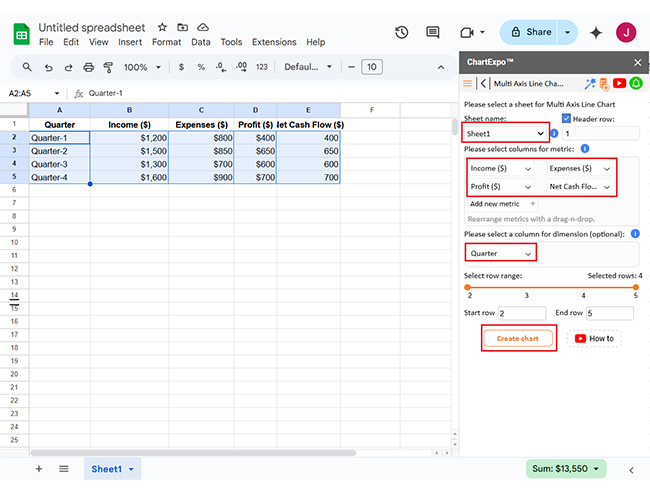
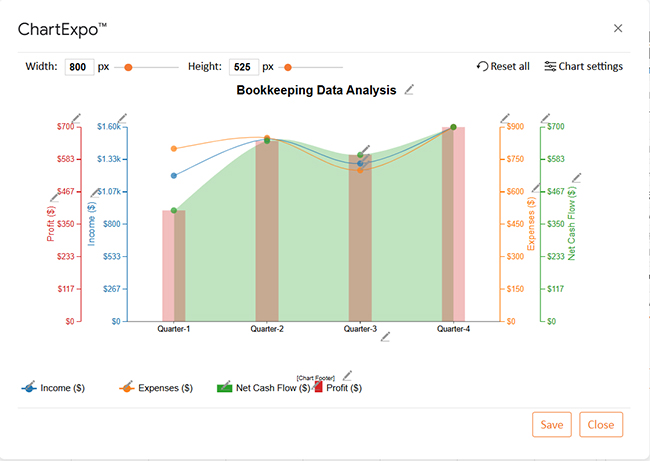
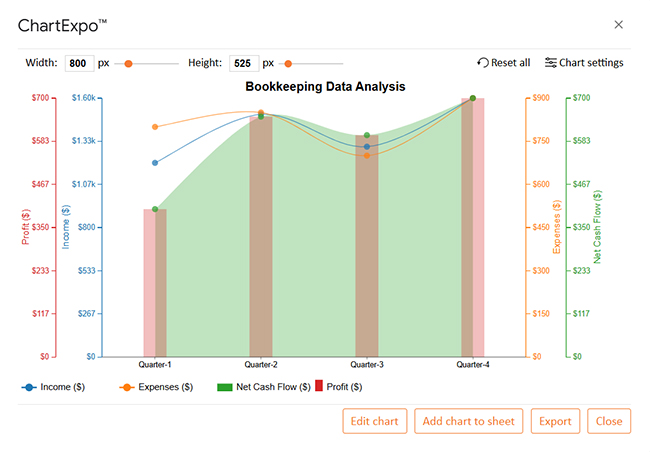
Let’s create a chart from the sample data below and analyze it using ChartExpo.

Quarter Income ($) Expenses ($) Profit ($) Net Cash Flow ($)
Quarter-1 $1,200 $800 $400 400
Quarter-2 $1,500 $850 $650 650
Quarter-3 $1,300 $700 $600 600
Quarter-4 $1,600 $900 $700 700
  • To get started with ChartExpo, install ChartExpo in Google Sheets.
  • Go to Extensions > Charts, Graphs & Visualizations by ChartExpo > Open.
Google Sheets Artificial Intelligence
  • To access the charts library, click the Add new chart button.
Google Sheets Artificial Intelligence
  • Once it loads, scroll through the charts list to locate and choose the “Multi-Axis Line Chart”.
Google Sheets Artificial Intelligence
  • Click the “Create Chart From Selection” button after selecting the data from the sheet, as shown.
Google Sheets Artificial Intelligence
  • ChartExpo will create the chart below for you.
  • If you want to add anything to the chart, click the Edit Chart button:
Google Sheets Artificial Intelligence
  • If you want to add anything to the chart, click the Edit Chart button:
  • Click on Settings and change the “Data Representation” as follows.
Google Sheets Artificial Intelligence
  • Click the pencil icon next to the Chart Header to change the title.
  • It will open the properties dialog. Under the Text section, you can add a heading in Line 1 and enable Show.
  • Give the appropriate title of your chart and click the Apply button.
Google Sheets Artificial Intelligence
  • You can add the Dollar Sign ($) with all values and change the precision value to zero as follows:
Google Sheets Artificial Intelligence
  • Change the Legend shape of “Income and Net Cash Flow” into a Line and Circle and click the “Apply” button.
Google Sheets Artificial Intelligence
  • Change the shape of “Profit” into a Column and click the “Apply” button:
Google Sheets Artificial Intelligence
  • After making all the changes, click on the “Save” button as follows:
Google Sheets Artificial Intelligence
  • Your final Multi Axis Line Chart will look like the one below.
Google Sheets Artificial Intelligence

Insights

  • Steady growth: Income and profit increase each quarter.
  • Rising expenses: Costs grow but remain manageable.
  • Positive margins: Profitability stays intact.
  • Improved cash flow: Net cash flow strengthens over time.
  • Strong Q4 performance: Income and profit peak, marking a successful period.
  • Financial stability: Controlled expenses ensure sustained profitability.

Use Cases of AI for Google Sheets

AI in Google Sheets simplifies tasks and unlocks your data’s full potential. For instance, it streamlines supply chain management by optimizing inventory and logistics. From cleaning messy information to predicting trends, AI can transform your work – here are some use cases:

  • Data cleaning & formatting: AI quickly detects errors like duplicates or missing values. Moreover, it automatically suggests or fixes formatting, saving you hours of manual work.
  • Data analysis & insights: AI analyzes large datasets and provides key insights in seconds. It helps you spot patterns, correlations, and outliers without needing deep analysis skills.
  • Trend prediction: AI can predict future trends based on historical data. Analyzing past behaviors provides actionable forecasts that help you plan.
  • Chart & data visualization: AI automatically generates the best visual representation of your data. You get clear, easy-to-understand charts without spending time on customization.
  • Personalized suggestions: AI suggests optimizations and improvements based on your usage. It learns from your data patterns to offer tailored recommendations.
  • Collaborative efficiency: Google Sheets AI enhances teamwork by helping everyone stay on the same page. Real-time data sharing and suggestions improve collaboration and decision-making across teams.

Advantages of Using AI for Google Sheets

Have you ever felt like spreadsheets are taking forever to manage? AI changes the game. It simplifies tasks like monthly budget tracking by simplifying data organization and forecasts. Here’s how AI makes Google Sheets better:

  • Increased productivity: AI automates repetitive tasks like data entry, formatting, and calculations, saving hours of manual work. This lets you focus on strategic tasks instead of getting lost in spreadsheets.
  • Enhanced data insights: AI quickly analyzes large datasets to identify trends, patterns, and outliers. It transforms raw numbers into meaningful insights, helping you make smarter decisions.
  • Ease of use: You don’t need to be an expert—AI-powered features simplify tasks. For instance, data interpretation becomes easier with AI-generated charts, summaries, and reports.
  • Data accuracy: AI reduces human errors by automatically validating and cleaning data. This ensures your reports and analyses are always based on reliable information.
  • Better decision-making: AI provides real-time data analysis and intelligent recommendations, helping you make informed choices. It eliminates guesswork and ensures solid data back decisions.
  • Cost efficiency: Automating tasks with AI reduces the need for manual labor, cutting operational costs. Fewer errors also mean less time spent fixing mistakes and more time improving overall efficiency.

Tips for Using Artificial Analysis in Google Sheets

AI turns spreadsheets into powerful tools that save time and reveal insights you might have missed. Pivot reporting helps organize complex data, making trends more straightforward to analyze. Want to get the most out of AI in Google Sheets? Follow these tips:

  • Leverage the Explore feature: Click the Explore button to generate charts, summaries, and trend analysis instantly. It’s like having a built-in data expert at your fingertips.
  • Automate data entry with bright fill: Let AI predict and complete repetitive entries with just a few keystrokes. No more manual typing—just faster, smarter data handling.
  • Utilize forecasting for predictions: Use AI-driven forecasting to predict future trends based on past data. Whether it’s sales numbers or performance metrics, AI helps you stay ahead.
  • Experiment with smart cleanup: AI can detect duplicates, fix inconsistencies, and suggest improvements. Keep your data clean, organized, and ready for analysis with minimal effort.
  • Optimize visualizations: AI helps create compelling charts and graphs with just a few clicks. Turn raw numbers into clear, visually appealing insights that anyone can understand.
  • Integrate AI Add-ons: Supercharge Google Sheets with AI-powered add-ons for advanced analytics, automation, and data extraction. There’s an AI tool for almost everything—find the ones that fit your needs.

FAQs

Is there any AI for Google Sheets?

Yes. Google Sheets has built-in AI features like Smart Fill, Explore, and formula suggestions. You can also use AI-powered add-ons like OpenAI’s GPT, Data Analyzer, and machine learning plugins. Google Apps Script enables custom AI automation for advanced tasks.

How to enable generative AI in Google Sheets?

Generative AI in Google Sheets is available through Google Workspace Labs. To enable it, join Google Workspace Labs (if eligible). Then, use AI-powered features like Smart Fill and formula suggestions. You can also install AI add-ons or use Google Apps Script.

Is there a ChatGPT for Google Sheets?

Yes, you can use ChatGPT in Google Sheets through third-party add-ons. Install an OpenAI-powered extension from the Google Workspace Marketplace. You can also connect ChatGPT via Google Apps Script or API to generate text, analyze data, and automate tasks.

Wrap Up

Google Sheets Artificial Intelligence changes how we work with data. It automates tasks, improves accuracy, and saves time, helping businesses and individuals gain deeper insights. For instance, AI-driven analysis makes managing a budget on Google Sheets easier, ensuring better financial planning.

Errors cost money, and accuracy leads to better decisions. AI reduces mistakes by detecting inconsistencies. It ensures data integrity, preventing costly miscalculations.

Time is valuable. AI automates repetitive tasks like data entry and formatting. Smart Fill and formula suggestions speed up tasks, so you can focus on analysis instead of manual work. Running what-if analysis in Google Sheets helps test different financial scenarios quickly, improving forecasting.

Data holds answers. AI instantly uncovers trends and patterns. Moreover, machine learning helps predict outcomes and optimize strategies.

Collaboration improves with Google Sheets Artificial Intelligence. AI-powered tools streamline teamwork, while Connected Sheets efficiently manages massive datasets. Businesses leveraging CRM analytics gain deeper customer insights, enhancing sales and marketing strategies.

Google Sheets Artificial Intelligence is a game changer. It simplifies complex tasks, enhances efficiency, and improves decision-making, giving those who use it a competitive edge. Start using it with ChartExpo to revolutionize how you work with data.

How much did you enjoy this article?

GSAd1
Start Free Trial!
149353

Related articles

next previous
Google Sheets11 min read

Google Spreadsheet Timesheet Template: A Visual Guide

A Google spreadsheet timesheet template simplifies time tracking and payroll management. Learn how to create, customize, and analyze timesheets.

Google Sheets9 min read

Google Sheets Transpose: A Complete Guide

Discover what Google Sheets Transpose is and how to flip data in your spreadsheet. You’ll learn methods and tips to enhance data analysis and visualization.

Google Sheets10 min read

Google Workspace for Education for Better Insights

Google Workspace for Education boosts collaboration and remote learning. Explore its features, benefits, and how ChartExpo enhances data analysis.

Google Sheets9 min read

Google Workspace Marketplace for Boosting Insights

Google Workspace Marketplace provides apps to enhance Gmail, Drive, and Docs. Learn about this tool and how to improve data visualization and analysis.

Google Sheets12 min read

Google Sheets CRM Templates for Insightful Decisions

Google Sheets CRM templates help businesses track contacts, sales, and customer data. Learn their benefits, setup steps, and expert tips to boost efficiency.

ChartExpo logo

Turn Data into Visual
Stories

CHARTEXPO

  • Home
  • Gallery
  • Videos
  • Services
  • Pricing
  • Contact us
  • FAQs
  • Privacy policy
  • Terms of Service
  • Sitemap

TOOLS

  • ChartExpo for Google Sheets
  • ChartExpo for Microsoft Excel
  • Power BI Custom Visuals by ChartExpo
  • Word Cloud

CATEGORIES

  • Bar Charts
  • Circle Graphs
  • Column Charts
  • Combo Charts
  • Comparison Charts
  • Line Graphs
  • PPC Charts
  • Sentiment Analysis Charts
  • Survey Charts

TOP CHARTS

  • Sankey Diagram
  • Likert Scale Chart
  • Comparison Bar Chart
  • Pareto Chart
  • Funnel Chart
  • Gauge Chart
  • Radar Chart
  • Radial Bar Chart
  • Sunburst Chart
  • see more
  • Scatter Plot Chart
  • CSAT Survey Bar Chart
  • CSAT Survey Chart
  • Dot Plot Chart
  • Double Bar Graph
  • Matrix Chart
  • Multi Axis Line Chart
  • Overlapping Bar Chart
  • Control Chart
  • Slope Chart
  • Clustered Bar Chart
  • Clustered Column Chart
  • Box and Whisker Plot
  • Tornado Chart
  • Waterfall Chart
  • Word Cloud
  • see less

RESOURCES

  • Blog
  • Resources
  • YouTube
SIGN UP FOR UPDATES

We wouldn't dream of spamming you or selling your info.

© 2025 ChartExpo, all rights reserved.