• Home
  • Tools dropdown img
    • Spreadsheet Charts

      • ChartExpo for Google Sheets
      • ChartExpo for Microsoft Excel
    • Power BI Charts

      • Power BI Custom Visuals by ChartExpo
    • Word Cloud

  • Charts dropdown img
    • Chart Category

      • Bar Charts
      • Circle Graphs
      • Column Charts
      • Combo Charts
      • Comparison Charts
      • Line Graphs
      • PPC Charts
      • Sentiment Analysis Charts
      • Survey Charts
    • Chart Type

      • Box and Whisker Plot
      • Clustered Bar Chart
      • Clustered Column Chart
      • Comparison Bar Chart
      • Control Chart
      • CSAT Survey Bar Chart
      • CSAT Survey Chart
      • Dot Plot Chart
      • Double Bar Graph
      • Funnel Chart
      • Gauge Chart
      • Likert Scale Chart
      • Matrix Chart
      • Multi Axis Line Chart
      • Overlapping Bar Chart
      • Pareto Chart
      • Radar Chart
      • Radial Bar Chart
      • Sankey Diagram
      • Scatter Plot Chart
      • Slope Chart
      • Sunburst Chart
      • Tornado Chart
      • Waterfall Chart
      • Word Cloud
    • Google Sheets
      Microsoft Excel
  • Services
  • Pricing
  • Contact us
  • Blog
  • Support dropdown img
      • Gallery
      • Videos
      • Contact us
      • FAQs
      • Resources
    • Please feel free to contact us

      atsupport@chartexpo.com

Categories
All Data Visualizations Data Analytics Surveys
Add-ons/
  • Google Sheets
  • Microsoft Excel
  • Power BI
All Data Visualizations Data Analytics Surveys
Add-ons
  • Google Sheets
  • Microsoft Excel
  • Power BI

We use cookies

This website uses cookies to provide better user experience and user's session management.
By continuing visiting this website you consent the use of these cookies.

Ok

ChartExpo Survey


Home > Blog > Google Sheets

Budget on Google Sheets: Enhance Your Reports with Visuals

A budget on Google Sheets? This point-and-click financial reporting tool combines the convenience of cloud-based software with powerful spreadsheet capabilities.

Google Sheets is the friendly face you need to help you create, track, and maintain your finances. Its collaboration options let you share your budget plan with family or business partners. Consequently, ensuring everyone stays on the same financial page.

Budget on Google Sheets

Digital budgeting tool usage is on the rise. A study conducted by the Financial Health Network shows that 62% of Americans utilize digital tools to manage their finances. This behavior reflects a need for rapid, personalized financial services in an increasingly digital era.

Creating a budget using Google Sheets is easy. The first step is to open a new spreadsheet and list your income and expense categories. Then, employ simple formulas for automated calculations that give you an instant view of your financial health.

The beauty of Google Sheets lies in its accessibility. You can access your budget online. Therefore, you have the latest information accurately updated with a working internet connection.

Moreover, Google Sheets’ integration with other Google services enhances its functionality. You can set up automatic imports from your bank accounts or use Google Forms to input daily expenses. This streamlines the budgeting process.

Maintaining a budget on Google Sheets is not just a task –  it’s an engaging financial management experience.

Let’s dive into it.

Table of Contents:

  1. What is a Budget on Google Sheets?
  2. Why Create a Budget Using Google Sheets?
  3. What Makes a Google Sheets Monthly Budget Effective?
  4. How to Use Google Sheets Budget Template?
  5. How to Create a Google Spreadsheet Budget Template?
  6. What are the Advantages and Disadvantages of Using Google Sheets for Budgeting?
  7. What are the Tips & Tricks for Successfully Executing the Google Sheet Budgeting?
  8. Wrap Up

First…

What is a Budget on Google Sheets?

Definition: A budget on Google Sheets is a simple tool for tracking income and expenses. It helps you organize finances, plan for savings, and avoid overspending.

You can create categories like rent, food, and entertainment. Then, you add amounts for each and monitor how they compare to your spending.

Google Sheets allows for automatic calculations, making it easy to see totals and spot trends. It’s flexible, customizable, and perfect for managing personal or business finances.

Why Create a Budget Using Google Sheets?

Creating a budget on Google Sheets is like giving your finances a digital makeover. It’s a simple yet powerful tool that makes managing money much easier.

Here’s why it’s a great choice:

  • Visualize your entire budget in one place: Google Sheets lets you see all your income, expenses, and savings in one clear view. It’s like having your financial snapshot right in front of you.
  • Track spending efficiently: You can update and track every dollar spent in real-time. As a result, you’ll always know where your money is going.
  • Highlight important data: Color-coding and formatting options make spotting key details, like bills due or monthly goals, easy.
  • Share budget updates: You can easily share the sheet with family or coworkers, keeping everyone in the loop with any changes.
  • Improved accuracy: Built-in formulas reduce errors and make calculations automatic, ensuring your budget is precise.
  • More customization options: You can design your budget exactly how you like, add charts, create specific categories, and adjust it as your needs change. It’s your budget, your rules!

What Makes a Google Sheets Monthly Budget Effective?

A Google Sheets monthly budget is like your personal money manager! It helps keep your finances organized and gives you more control over spending.

Here’s what makes it so effective:

  • Real-time updates: You can track income and expenses as they happen to get a clear picture of your financial situation.
  • Easy to customize: You can adjust the layout and categories or add charts to make the budget perfectly suit your needs.
  • Automatic calculations: Built-in formulas do the math for you, reducing errors and saving time.
  • Accessible anywhere: Since it’s on Google Sheets, you can check your budget from any device with internet access.

How to Use Google Sheets Budget Template?

Using a Google Sheets budget template is a great way to organize your finances and track spending easily. Here’s a step-by-step guide to help you get started:

Step 1: Open Google Sheets

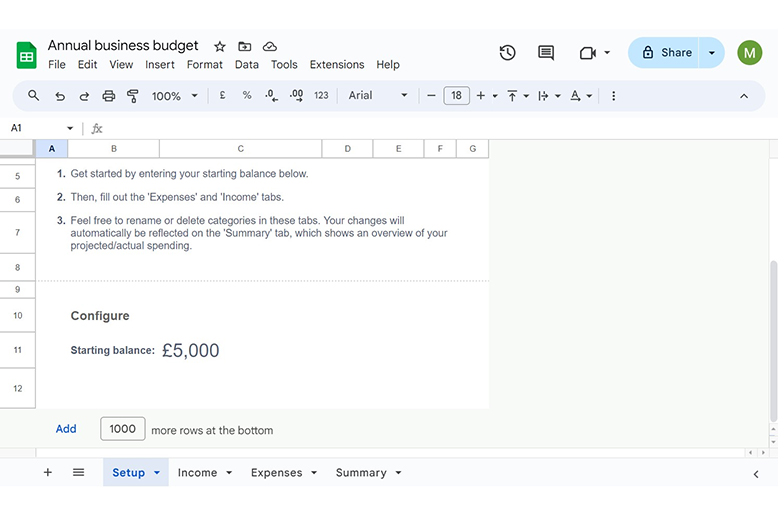
Log into your Google account and open Google Sheets. You can also access it directly through Google Drive.

Log into Google Sheets for Doing Budget on Google Sheets

Step 2: Click on Budget Template

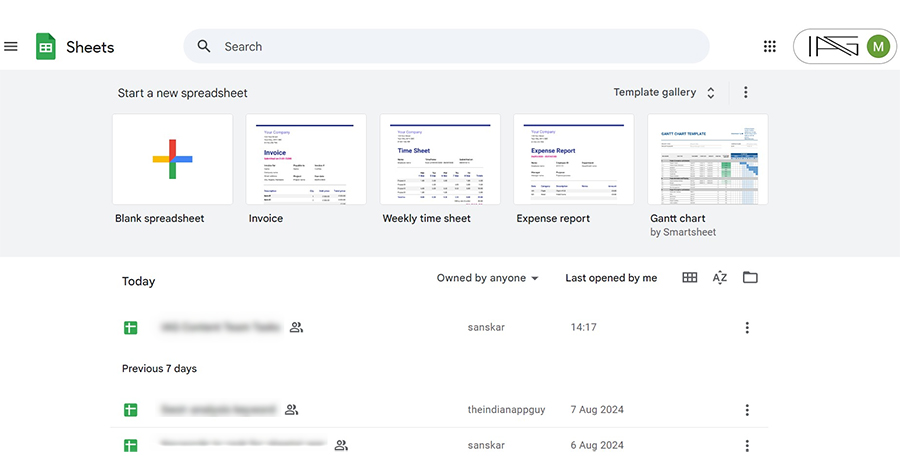
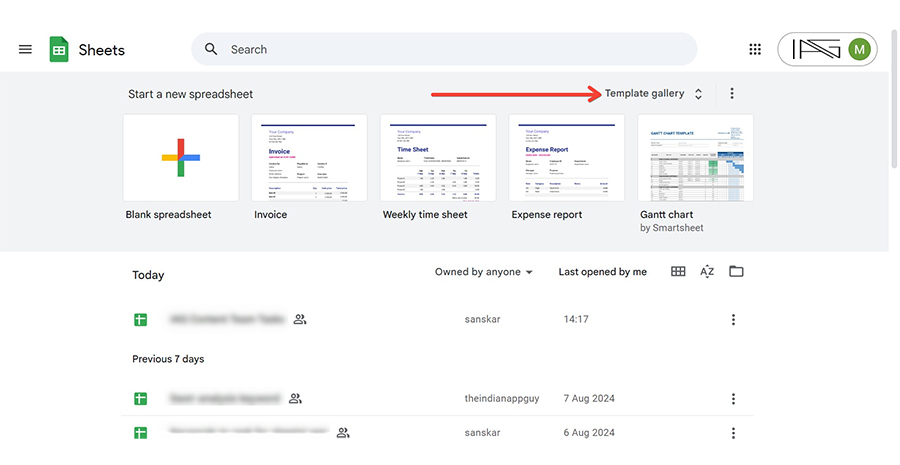
Once in Google Sheets, navigate to the “Template Gallery” at the top.

Navigate to Template Gallery for Doing Budget on Google Sheets

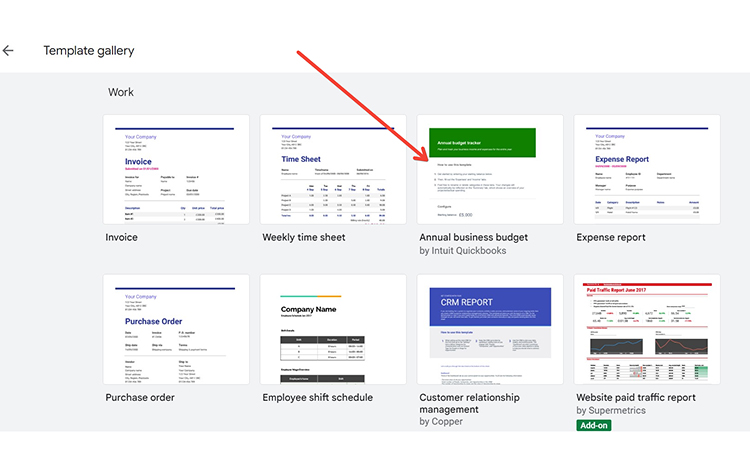
Then, select a budget template that fits your needs, such as the “Monthly Budget” or “Annual Business Budget”.

Select Budget Template as Monthly Budget on Google Sheets

Step 3: Customize Your Budget Template

Now it’s time to tailor the template to your specific financial goals:

  • Income and Expenses: List your income sources (salary, freelance work, etc.) and your expected expenses, such as rent, utilities, or groceries. You can easily edit these to match your lifestyle.
  • Categories and Labels: Group your expenses into categories, such as housing, food, entertainment, and savings. You can rename labels or add new ones based on what you need to track.
  • Formatting Options: Use color coding, bold text, or borders to make your budget visually clear. Use different colors to highlight overdue bills or upcoming savings goals.

Step 4: Select the Cells You Want to Edit

Click on specific cells to enter your numbers. You can also add formulas to calculate totals, averages, or any other data you want to monitor.

Add Formulas to Calculate Totals for Doing Budget on Google Sheets

Step 5: Your Budget Template is Ready!

With your template set up and customized, you can start tracking your income and expenses. Check it regularly to adjust your budget as your finances change and stay on top of your financial goals!

How to Create a Google Spreadsheet Budget Template?

Are you tired of your money playing hide-and-seek? It’s time to create a Google Spreadsheet budget template! This financial detective will track down every penny faster than you can say, “Where did my paycheck go?”

But wait, there’s a plot twist in this money mystery. Data visualization, the superhero of data analysis, often gets stuck in Google Sheets’ limitations.

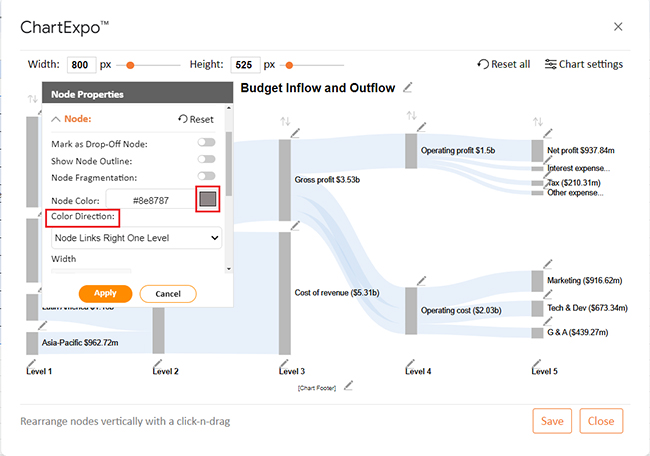
Enter ChartExpo. This add-on turns your Google Sheets into a visual feast, making budget tracking less of a snooze-fest. With ChartExpo, you’ll read your finances like a thrilling graphic novel – no accountant-level superpowers required.

Let’s learn how to install ChartExpo in Google Sheets.

  1. To start using ChartExpo, download it directly from the Google Sheets program. To do this, select Extensions from the top toolbar.
  2. A menu will appear. Click the Get add-ons option.
  3. Search for ChartExpo, and click on Charts, Graphs & Visualizations by ChartExpo when it appears in the results.
  4. Click the Install button. You will have to confirm your Google account and accept some permissions.

ChartExpo charts are available both in Google Sheets and Microsoft Excel. Please use the following CTAs to install the tool of your choice and create beautiful visualizations in a few clicks in your favorite tool.

Example

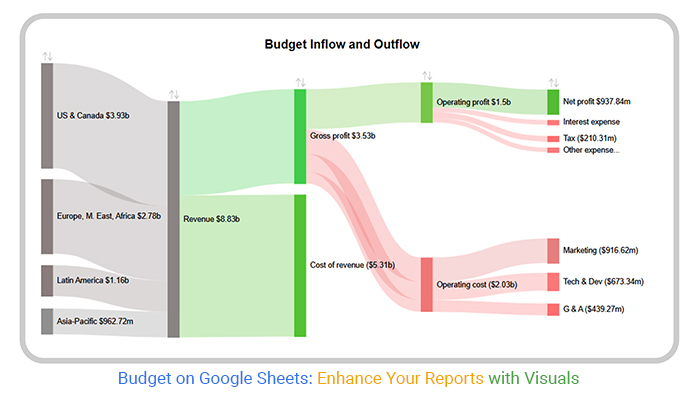
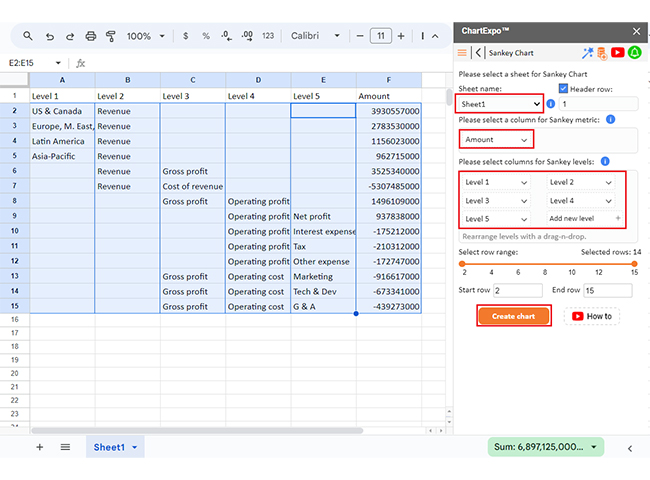
Let’s visualize the budget in Google Sheets sample data below using ChartExpo and glean valuable insights.

Level 1 Level 2 Level 3 Level 4 Level 5 Amount
US & Canada Revenue 3930557000
Europe, M. East, Africa Revenue 2783530000
Latin America Revenue 1156023000
Asia-Pacific Revenue 962715000
Revenue Gross profit 3525340000
Revenue Cost of revenue -5307485000
Gross profit Operating profit 1496109000
Operating profit Net profit 937838000
Operating profit Interest expense -175212000
Operating profit Tax -210312000
Operating profit Other expense -172747000
Gross profit Operating cost Marketing -916617000
Gross profit Operating cost Tech & Dev -673341000
Gross profit Operating cost G & A -439273000
  • To get started with ChartExpo, install ChartExpo in Google Sheets.
  • Go to Extensions > Charts, Graphs & Visualizations by ChartExpo > Open.
open chartexpo in google sheets
  • To access the charts library, click the Add new chart button.
add new chart in google sheets
  • Once ChartExpo is loaded. Click on “Sankey Chart.
search sankey chart in google sheets
  • Select the data from your worksheet and click the Create Chart button.
Select Data From Your Worksheet and Click Create Chart for Doing Budget on Google Sheets
  • Your Sankey Chart shown will appear as below.
Sankey Chart Shown will Appear for Doing Budget on Google Sheets
  • Click the Edit chart button to make custom changes.
  • To change the title of the chart, click the pencil icon next to the Chart Header.
  • It will open the properties dialog. Under the Text section, you can add a heading in Line 1 and enable the Show option. Give the appropriate title of your chart and click the Apply button.
Add Chart Header for Doing Budget on Google Sheets
  • You can enable the negative data button:
Enable Negative Data Button for Doing Budget on Google Sheets
  • You can change the width of Nodes:
Change Width of Nodes for Doing Budget on Google Sheets
  • You can disable the percentage value:
Disable Percentage Value for Doing Budget on Google Sheets
  • You can disable the outline of Nodes:
Disable Outline of Nodes for Doing Budget on Google Sheets
  • You can add the dollar sign with values:
Add Dollar Sign with Values for Doing Budget on Google Sheets
  • You can disable the lower labels:
Disable the Lower Labels for Doing Budget on Google Sheets
  • You can change the format type into currency format as follows:
Change Format Type into Currency Format for Doing Budget on Google Sheets
  • You can select the option of “show for negative numbers only” for parenthesis as follows:
Select Option of Show for Nagative Numbers Only for Doing Budget on Google Sheets
  • You can change the colors of all Nodes and set the direction:
Change Colors of All Nodes for Doing Budget on Google Sheets
  • After making all changes, click the “Save” button.
Click Save Button for Doing Budget on Google Sheets
  • Your final chart will appear below.
Final Budget on Google Sheets

Insights

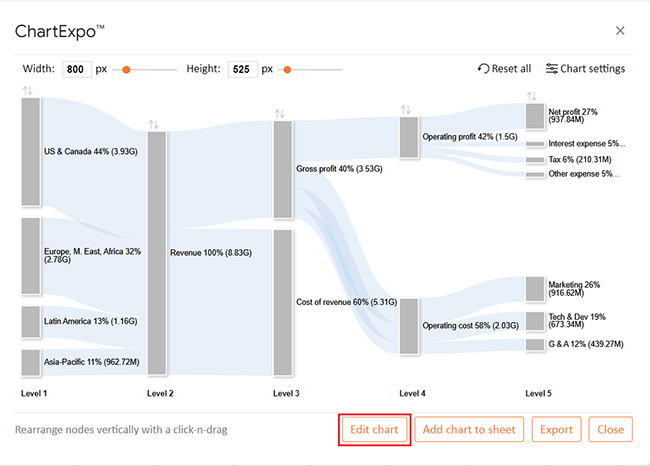
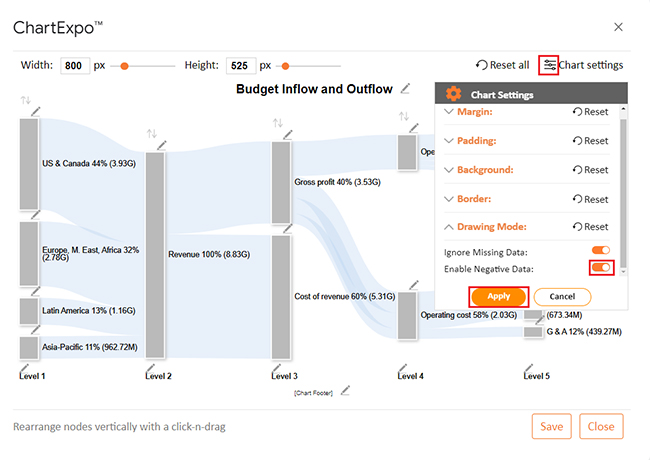
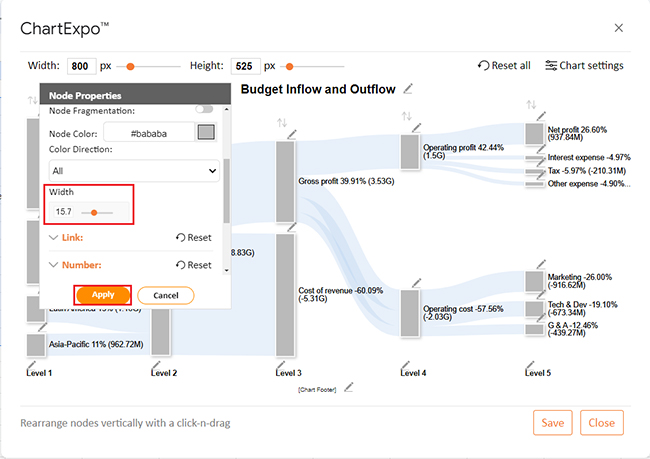
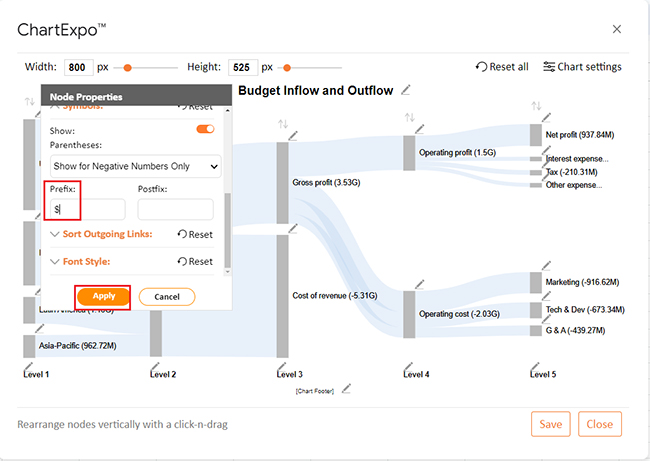
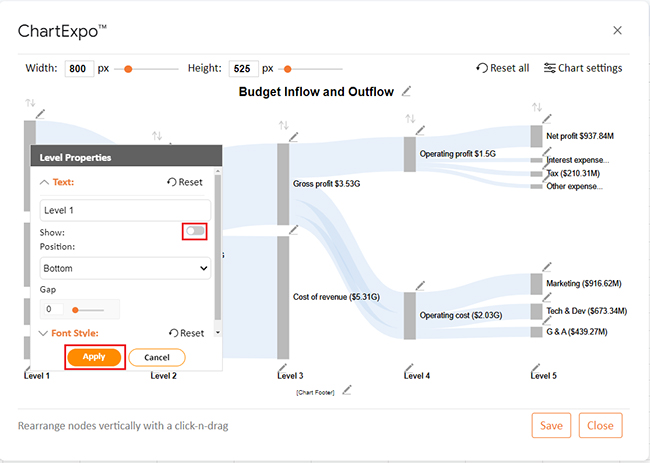
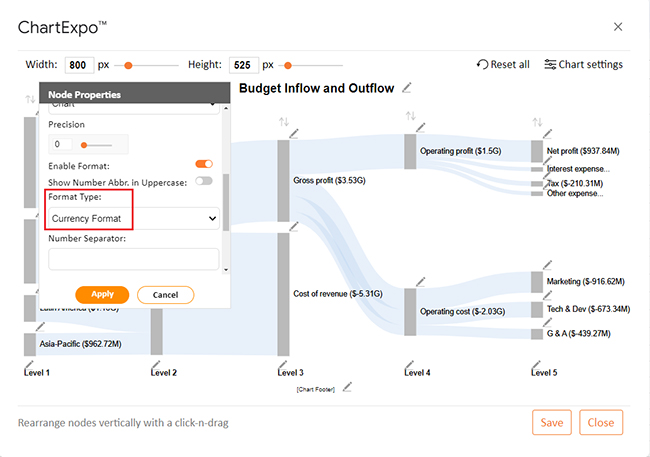
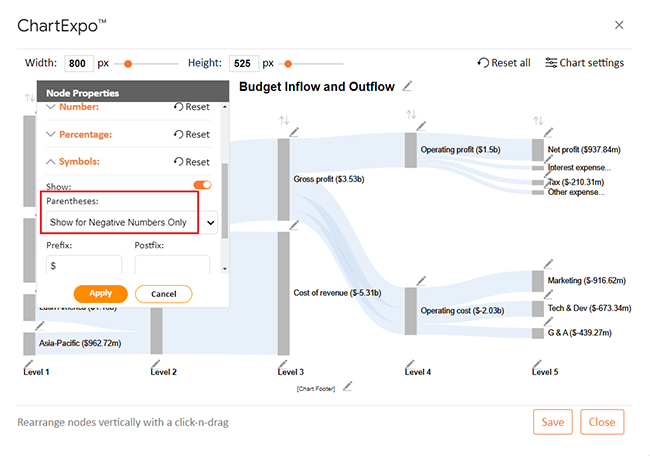
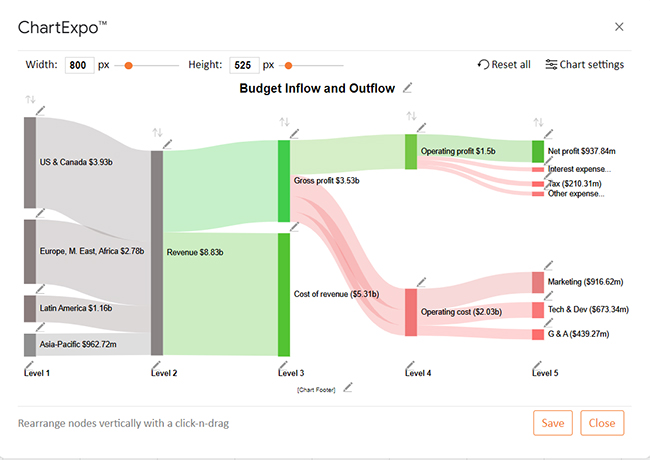
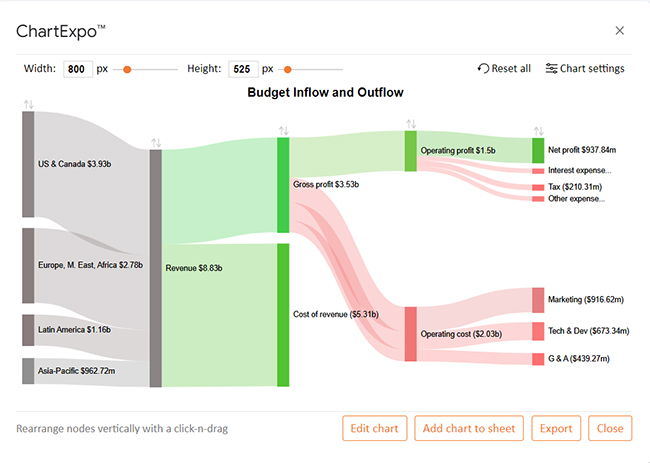
The data shows a revenue breakdown by region.

US & Canada contribute the largest portion of revenue.

Gross profit is reduced by substantial costs, including:

  • Marketing expenses
  • Technology development costs

After all expenses, the net profit stands at $937.84 million.

Unlock Financial Insights and Efficiency with Budget Charts on Google Sheets:

  1. Open your Google Sheets Application.
  2. Install ChartExpo Add-in for Google Sheets from Google Workspace Marketplace.
  3. Select the Sankey Chart from the list of charts.
  4. Fill in the necessary fields
  5. Click on the “Create Chart” button.
  6. Customize your chart properties to add header, axis, legends, and other required information.
  7. Export your chart and share it with your audience.

The following video will help you to create a Sankey Chart in Google Sheets.

What are the Advantages and Disadvantages of Using Google Sheets for Budgeting?

Google Sheets is a popular tool for budgeting, and for good reason. It offers flexibility and control over your finances. However, like any tool, it has its pros and cons:

Advantages of Using Google Sheets for Budgeting:

  • Customizable: You can design your budget exactly how you want, add categories, adjust labels, and create charts to track your goals.
  • Real-time access: Because it’s cloud-based, you can access your budget from any device with the internet, so you’re always in control.
  • Automated calculations: No need for manual math! Built-in formulas calculate totals, averages, or percentage breakdowns automatically.
  • Data visualization: You can create different types of charts and graphs to get a clear, visual overview of your financial trends.
  • Conditional formatting: Highlight important figures, overdue payments, or savings goals with color-coding to make your budget easier to read.
  • Collaboration: You can share your budget with a partner, family, or colleagues to keep everyone in sync.
  • Cost-effective: It’s free! All you need is a Google account to access Sheets and its features.
  • Google Drive integration: Your budget is automatically stored in Google Drive, making it easy to access, organize, and backup files.
  • Templates: Google Sheets offers built-in templates for easy budgeting so you can get started immediately.

Limitations of Using Google Sheets for Budgeting:

  • Manual entry: You have to input your transactions manually. This can be time-consuming if you don’t keep up with it regularly.
  • Complexity: If you’re unfamiliar with spreadsheets, formulas, and functions, customizing or navigating them may feel overwhelming.
  • Data security: Your financial data may be vulnerable if not properly secured with strong passwords or two-factor authentication.
  • Limited automation: Google Sheets doesn’t automatically sync with your bank or credit card accounts. Therefore, you need to update your budget manually.

What are the Tips & Tricks for Successfully Executing the Google Sheet Budgeting?

It’s all about working smarter, not harder. Here are some great ways to make sure your Google Sheets budget works like a charm:

  1. Start with a template: Choose a Google spreadsheet budget template to start quickly. It saves setup time.
  2. Automate with formulas: Use simple formulas like =SUM to automate calculations like monthly totals or savings goals.
  3. Categorize expenses: Group expenses into categories like rent, food, and entertainment. It helps track spending better.
  4. Set up alerts: Use color coding to highlight when you’re near your spending limits.
  5. Regular updates: Update your budget daily or weekly to stay on top of your finances.
  6. Review regularly: Check your budget at the end of the month to see where you overspent or saved.
  7. Utilize charts: Create charts to visualize spending trends and make adjustments easily.

FAQs

What are the best practices for budgeting in Google Sheets?

  • Use templates to simplify setup.
  • Categorize expenses and income.
  • Apply formulas for automation.
  • Track actual vs. planned expenses regularly.
  • Use conditional formatting for insights and set monthly review reminders.

How can I visualize my budget data in Google Sheets?

To visualize your budget data:

  • Use charts like bar, pie, or line graphs.
  • Highlight trends with conditional formatting.
  • Create dashboards for an overview of spending.
  • Use pivot tables to analyze data by category or time period.

Can I link my Google Sheets budget to Power BI?

Yes, you can link Google Sheets to Power BI. Use Power BI’s Google Sheets connector or export your sheet as a CSV. Regular syncing keeps your data updated for reporting in Power BI.

Wrap Up

A budget on Google Sheets is a powerful tool for managing your finances. It helps track income, expenses, and savings in one organized place. You can easily see where your money is going each month.

With Google Sheets, you can create a budget that fits your needs. You can add categories for expenses like groceries, bills, and entertainment. This makes it easier to spot patterns in your spending.

The platform’s automatic calculations are a major advantage. You don’t have to worry about doing the math yourself. Google Sheets can sum up totals, show averages, and calculate savings instantly.

Customization is another benefit. You can adjust your budget layout, add labels, or create charts to understand your financial habits better. It’s flexible and can grow as your financial needs change.

Real-time access is a huge plus. You can check and update your budget from any device on the internet. This keeps your finances updated, whether at home or on the go.

In conclusion, a Google Sheets budget helps you stay in control of your money. It’s customizable, easy to use, and accessible anytime. If you want a simple yet powerful tool for financial tracking, Google Sheets is a great option.

How much did you enjoy this article?

GSAd2
Start Free Trial!
142163

Related articles

next previous
Google Sheets10 min read

Google Sheets Amortization Schedule with Clear Visuals

A Google Sheets Amortization Schedule tracks loan payments, interest, and balances. Learn how to create your schedule for better loan management.

Google Sheets11 min read

Google Sheet Profit and Loss Template for Financial Success

Google Sheet profit and loss template simplifies tracking income and expenses. Learn tips and steps for using this template for better financial management.

Google Sheets11 min read

Sales Tracking Spreadsheet for Better Insights

A Spreadsheet for Sales Tracking organizes data, tracks performance, and analyzes trends. This guide covers its benefits, templates, and visualization tips.

Google Sheets11 min read

How to Create a Chart in Google Sheets in Few Steps?

Learn step-by-step how to create a chart in Google Sheets to visualize your data clearly and effectively, even if you're a beginner.

Google Sheets14 min read

How to Use Google Spreadsheet for Insightful Results

Learn how to use Google Sheets for data management. You’ll discover tips on adding data, using formulas, creating charts, and more to streamline your work.

ChartExpo logo

Turn Data into Visual
Stories

CHARTEXPO

  • Home
  • Gallery
  • Videos
  • Services
  • Pricing
  • Contact us
  • FAQs
  • Privacy policy
  • Terms of Service
  • Sitemap

TOOLS

  • ChartExpo for Google Sheets
  • ChartExpo for Microsoft Excel
  • Power BI Custom Visuals by ChartExpo
  • Word Cloud

CATEGORIES

  • Bar Charts
  • Circle Graphs
  • Column Charts
  • Combo Charts
  • Comparison Charts
  • Line Graphs
  • PPC Charts
  • Sentiment Analysis Charts
  • Survey Charts

TOP CHARTS

  • Sankey Diagram
  • Likert Scale Chart
  • Comparison Bar Chart
  • Pareto Chart
  • Funnel Chart
  • Gauge Chart
  • Radar Chart
  • Radial Bar Chart
  • Sunburst Chart
  • see more
  • Scatter Plot Chart
  • CSAT Survey Bar Chart
  • CSAT Survey Chart
  • Dot Plot Chart
  • Double Bar Graph
  • Matrix Chart
  • Multi Axis Line Chart
  • Overlapping Bar Chart
  • Control Chart
  • Slope Chart
  • Clustered Bar Chart
  • Clustered Column Chart
  • Box and Whisker Plot
  • Tornado Chart
  • Waterfall Chart
  • Word Cloud
  • see less

RESOURCES

  • Blog
  • Resources
  • YouTube
SIGN UP FOR UPDATES

We wouldn't dream of spamming you or selling your info.

© 2025 ChartExpo, all rights reserved.