Categories
By ChartExpo Content Team
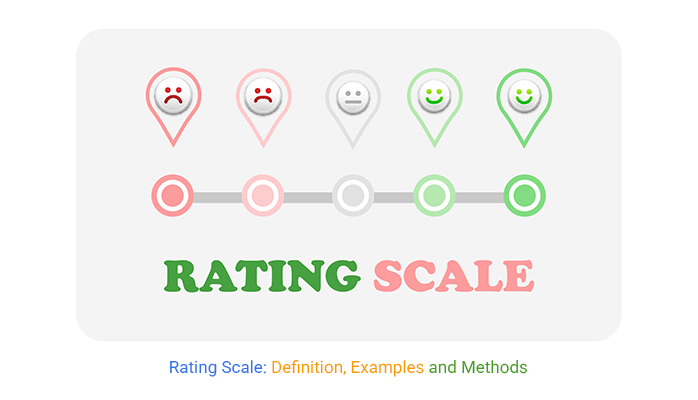
Embarking on the journey of effective data collection and feedback analysis, the spotlight turns to the invaluable insights offered by the “Rating Scale”.


When conducting a survey, respondents may need to rate their opinion or degree of satisfaction with a particular product or service. To perform this objectively, you’ve got to use different rating scale queries in your survey.
With a rating scale, you can easily quantify your audience’s feelings and opinions in terms of specified values in numbers.
A rating scale is one of the proven question types for online and offline surveys. Your audience can use the scale to rate an attribute or feature of your service or product.
Let’s assume you’ve used a rating scale to gather data for further analysis.
How do you extract answers from the data?
This is where charts with rating scales, such as Likert, come in. A Likert Scale Chart has choices ranging from ‘strongly agree’ to ‘strongly disagree’ to help you get a bird’s eye view of your audience’s opinions and level of agreement.
Also, it’s straightforward to read and interpret a Likert scale chart, as you will see later.
Definition: A rating scale is a structured, closed-ended tool used in surveys, assessments, and evaluations to capture and measure opinions, attitudes, or performance using a predefined range of options, often numerical or descriptive.
It helps quantify qualitative feedback, allowing for easier comparison, analysis, and decision-making. Common formats include Likert scales, numerical ratings (e.g., 1 to 5), star ratings, and slider scales. Rating scales are widely used in customer feedback, employee performance reviews, product evaluations, and psychological assessments.
1. Clarity
Options are easy to understand and interpret, ensuring respondents can answer confidently without confusion.
2. Consistency
Each item follows the same format and structure, which helps maintain uniformity throughout the scale and improves reliability.
3. Neutrality
The language used is unbiased and avoids leading the respondent toward a particular answer.
4. Relevance
The scale aligns with the purpose of the survey or assessment and focuses on attributes that truly matter.
5. Scalability
Responses can be easily quantified, making it possible to analyze trends, compare results, and draw meaningful insights.
The primary function of a rating scale is to quantify opinions, behaviors, or performance using a structured set of responses. It transforms subjective input into measurable data, making it easier to analyze trends, identify gaps, and make informed decisions.
Whether you’re collecting customer feedback, assessing employee skills, or measuring satisfaction, a rating scale helps:
Scoring scales are essential because they turn subjective opinions into measurable data. They make it easier to evaluate performance, satisfaction, or behavior across individuals, groups, or products. By using consistent metrics, scoring scales help identify patterns, highlight areas for improvement, and support data-driven decisions in surveys, reviews, and assessments.
Use a multiple-choice rating scale when you need fast, reliable, and consistent feedback. It’s perfect for:
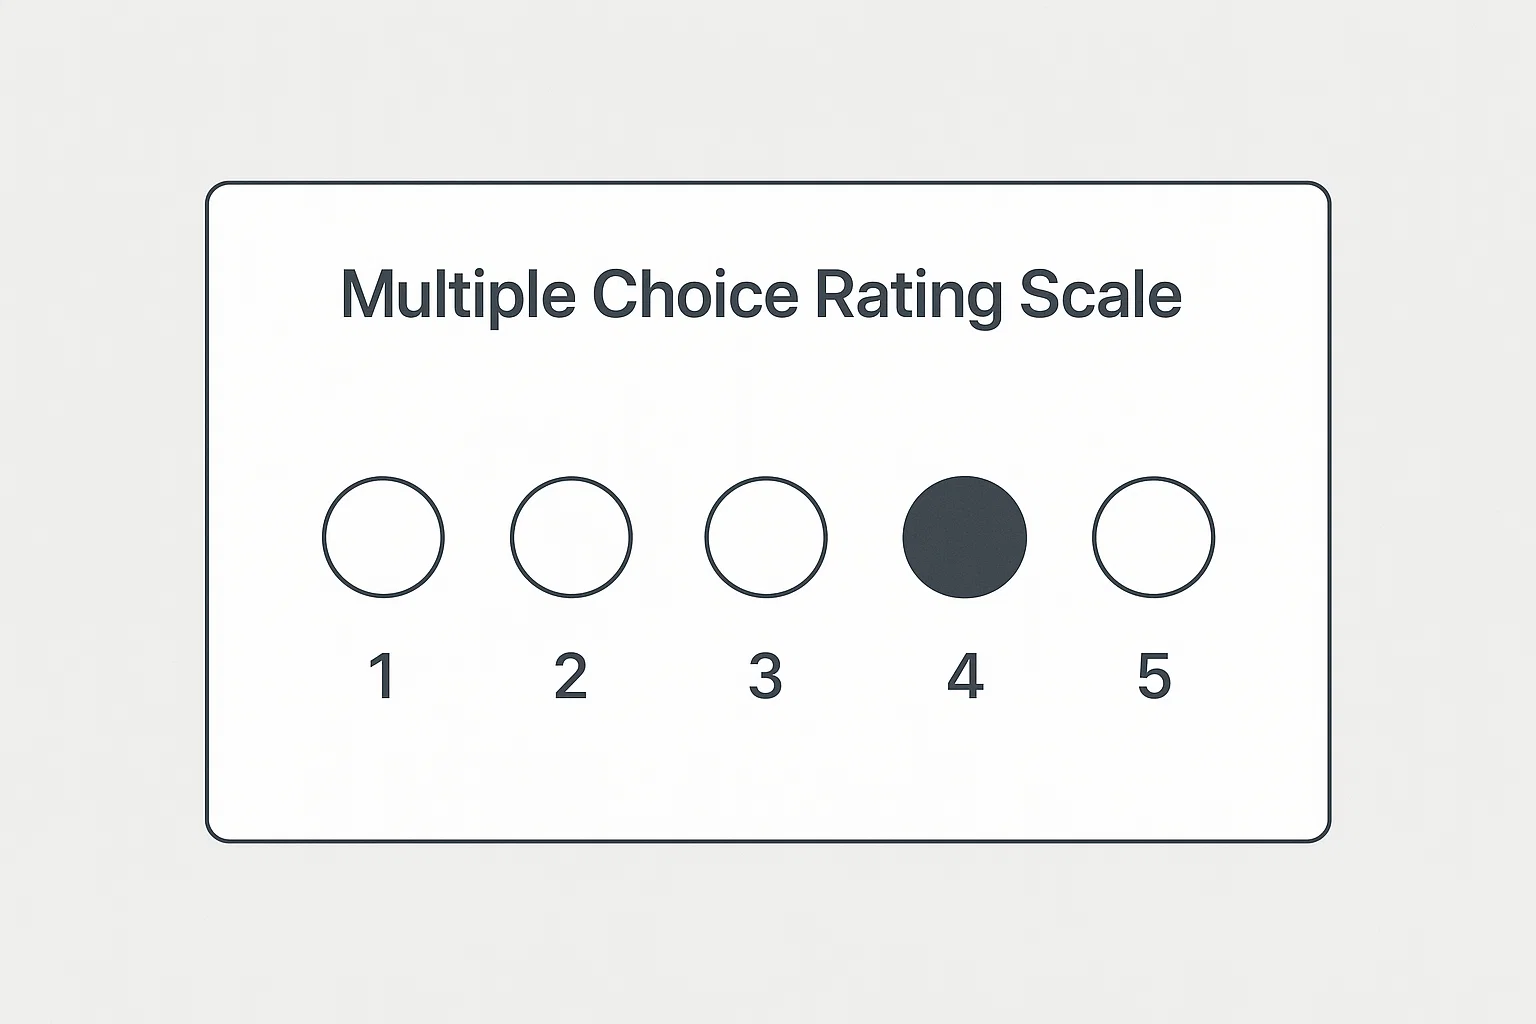
This scale is best used when you want to reduce guesswork, speed up analysis, and make decisions backed by structured responses. Whether it’s a customer survey, employee review, or product test, this format makes feedback count.
We have 4 primary types of rating scales you can use to put together a survey.
Let’s check them out.
A graphic rating scale uses a visual representation of the response options. Respondents select a point on the scale that best reflects their opinion.
A common graphic rating scale is the 5 to 7-point Likert scale.
Here is an example of a graphic rating scale question:
“How satisfied are you with the quality of the food?”
The response options are displayed as a bar with the numbers 1 to 5. Respondents select the point on the bar that best reflects their opinion.
A numerical rating scale employs numbers as replies. Respondents choose the number that best represents their point of view.
Here is a numerical rating scale question example:
“How satisfied are you with the quality of our customer service?”
The response options range from 1 to 5, and 1 being “Extremely dissatisfied” and 5 being “Extremely satisfied.”
The respondents picked the number that best represented their opinion.
In a descriptive rating scale, respondents are provided with an option to elaborate on their responses, which can be particularly useful in Descriptive Analytics to gain deeper insights.
For instance, how would you rate our services?
We have used the 5-point Likert scale in the above example.
As the name suggests, a comparative rating scale provides your target audience with an option to answer a survey question by comparing one attribute against another.
Here are different rating scale examples:
You don’t want to miss this.
Imagine your rating scale question is like a measuring stick for opinions. Here’s how to design one that gets helpful results:
Clearly understand the purpose of the rating questions. Determine what specific information or feedback you are seeking from the respondents.
Decide on the type of rating scale you want to use. Common rating scales include:
Craft a clear and specific question that focuses on the aspect you want respondents to rate. The way you word your question should make sense with the rating options you give people (like numbers, words, or symbols).
Example:
Did our customer service meet your expectations? (1 = Not at all, 5 = Completely)
If the rating scale has specific labels or meanings, provide clear instructions to the respondents. For instance, explain what each point on the scale represents.
Example:
Please review the statement and choose your level of agreement using the scale below: (1 = Strongly Disagree, 5 = Strongly Agree)
Choose how respondents will provide their ratings. The user interface for your rating questions might include checkboxes, radio buttons, or a dropdown menu. The specific format will depend on the capabilities of your survey or open-ended questionnaire platform.
Pretest the rating scale question with a small sample group to check for clarity, ease of understanding, and whether it captures the intended responses effectively.
If you are using an online survey tool, implement the rating scale question according to the chosen response format and configuration options.
Once you have survey answers, study the data from your 5-point performance rating scale question to learn about people’s opinions, how happy they are, or what they like.
Excel is a spreadsheet application you can use to organize, store, and visualize data using a rating scale chart.
You’re unlikely to find advanced charts in Excel with a rating Scale chart, such as the Likert Scale Chart. We’re not advocating you leave this tool. Install a particular third-party add-in in your spreadsheet application to create rating charts.
The application is called ChartExpo.
What is ChartExpo?
ChartExpo is an add-in you can easily install in your spreadsheet application to access charts with rating scales. This intuitive rating tool helps simplify the process of visualizing survey data in Excel and feedback data.
Also, you don’t need coding skills to create rating scale charts for your stories.
Let’s learn how to install ChartExpo.
ChartExpo rating charts are available both in Google Sheets and Microsoft Excel. This powerful rating tool makes it easy to visualize feedback and scores effectively. Please use the following CTA’s to install the tool of your choice and create beautiful visualizations in a few clicks in your favorite tool.
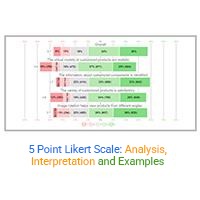
The Likert Scale Chart is used for survey feedback analysis to measure people’s opinions, attitudes, or behaviors. This allows researchers to easily visualize and understand the results of their survey by quantifying intangible feelings and attitudes.
Let’s analyze the rating scale examples data using the Likert Scale Chart.
| Questions | Scales | Responses |
| How well does our product meet your needs? | 1 | 130 |
| How well does our product meet your needs? | 2 | 136 |
| How well does our product meet your needs? | 3 | 128 |
| How well does our product meet your needs? | 4 | 968 |
| How well does our product meet your needs? | 5 | 638 |
| How satisfied are you with our team in resolving your issue? | 1 | 186 |
| How satisfied are you with our team in resolving your issue? | 2 | 278 |
| How satisfied are you with our team in resolving your issue? | 3 | 483 |
| How satisfied are you with our team in resolving your issue? | 4 | 539 |
| How satisfied are you with our team in resolving your issue? | 5 | 514 |
| How satisfied are you with your in-store experience? | 1 | 148 |
| How satisfied are you with your in-store experience? | 2 | 130 |
| How satisfied are you with your in-store experience? | 3 | 193 |
| How satisfied are you with your in-store experience? | 4 | 665 |
| How satisfied are you with your in-store experience? | 5 | 864 |
| How satisfied are you with product packing? | 1 | 145 |
| How satisfied are you with product packing? | 2 | 240 |
| How satisfied are you with product packing? | 3 | 104 |
| How satisfied are you with product packing? | 4 | 667 |
| How satisfied are you with product packing? | 5 | 844 |


Check out the benefits of a rating scale below.
Other data collection tools, such as interviews, are often prone to manipulation and distortion.
For instance, respondents may not want to share their true feelings with a stranger. Besides, social pressure to conform can easily distort the final data.
How?
Experiments have shown that we tend to agree with a more dominant person in a room.
Yes, even if we know the answer is wrong.
A survey rating scale can help you overcome this obstacle. Your respondents will fill out the surveys privately, without peer pressure.
The responses gathered will be more honest and reliable. In other words, they will be true representations of the actual sentiments of your target market.
A survey rating scale can help you to do more than collect information about past customers.
To uncover a potential customer base, you can use a rating scale in other scopes, such as market research, as well as IELTS band scores.
How can you do this?
A well-crafted rating scale can help you ask qualifying questions that narrow the audience to hot leads.
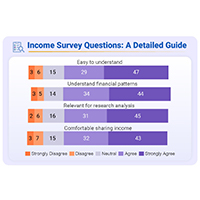
For instance, you can target people with a high disposable income by using questions that probe income brackets.
One of the key merits of a rating scale is that you can use it to question your audience over a protracted time.
Besides, there are freemium survey creation tools, such as Google Forms and Microsoft Forms, for creating rating scale questions and gathering data.
The longer you gather data, the more you’ll have for analysis. More data means a higher degree of reliability of the resulting insights.
While convenient and commonly used, rating analysis scales possess certain limitations for data collection and analysis:
Rating scales often provide a limited level of precision in capturing nuanced opinions or attitudes. Respondents might find it challenging to express subtle differences between their sentiments, leading to a loss of detailed information.
The interpretation of scale points can vary among respondents. Variations in individual perspectives and experiences can lead to different interpretations of the same rating on a scale. This subjectivity can introduce inconsistency in the collected data.
People taking surveys might choose “safe” answers in the middle, instead of saying how they feel. This can make the data misleading, as it doesn’t show the full picture of opinions or experiences.
Rating scales often lack context, making it challenging to understand the reasons behind a particular rating. Without additional qualitative data, it may be difficult to uncover the root causes of certain ratings.
The cultural background and language proficiency of respondents can influence their understanding of rating scale items. This introduces potential bias, especially in surveys with a diverse participant pool.
Customer Feedback Surveys
Understand customer satisfaction, preferences, and service experiences.
Employee Evaluations
Assess job performance, teamwork, and skill development in a structured way.
Academic and Social Research
Measure opinions, attitudes, behaviors, and perceptions for qualitative or quantitative analysis.
Product and UX Testing
Evaluate user satisfaction with websites, apps, and digital interfaces.
Healthcare and Clinical Settings
Rate symptoms, pain levels, or mental health indicators for diagnostic and monitoring purposes.
A 1 to 10 rating scale lets respondents rate something from very poor (1) to excellent (10), offering a wide range for expressing opinions.
One of the key merits of rating scales is that you can use them to question your audience over a prolonged time. Besides, there are freemium survey creation tools, such as Google Forms and Microsoft Forms, that make everything easier in creating surveys.
When carrying out a survey exercise, your respondents may need to rate their knowledge or degree of satisfaction with a particular product or service.
To perform this objectively, you’ve got to use a different rating scale in the survey.
Let’s assume you’ve used a rating scale to gather data for further analysis.
How do you extract answers from the data?
This is where charts with rating scales, such as Likert Scale Chart, come in.
Microsoft Excel lacks charts with rating scales, such as a Likert Scale Chart.
So, what’s the solution?
We recommend you install an add-in, such as ChartExpo, to access the Likert Scale Chart and other rating scale charts.
ChartExpo is an Excel add-in loaded with rating scale visualizations, such as the Likert Scale Chart.
Sign up for a 7-day free trial today to access ready-made graphs for visualizing rating scale responses.
How much did you enjoy this article?


Learn how the 5-Point Performance Rating Scale improves employee evaluations with clear, consistent, and fair performance reviews across teams.

Fun Survey Questions can raise response rates, reveal patterns, and guide survey planning across teams, classrooms, and customer research. Read on!

Learn how to create, collect, and analyze data using a 4-point Likert scale. A complete guide with definition, examples, advantages, and practical applications.