• Home
  • Tools dropdown img
    • Spreadsheet Charts

      • ChartExpo for Google Sheets
      • ChartExpo for Microsoft Excel
    • Power BI Charts

      • Power BI Custom Visuals by ChartExpo
    • Word Cloud

  • Charts dropdown img
    • Chart Category

      • Bar Charts
      • Circle Graphs
      • Column Charts
      • Combo Charts
      • Comparison Charts
      • Line Graphs
      • PPC Charts
      • Sentiment Analysis Charts
      • Survey Charts
    • Chart Type

      • Box and Whisker Plot
      • Clustered Bar Chart
      • Clustered Column Chart
      • Comparison Bar Chart
      • Control Chart
      • CSAT Survey Bar Chart
      • CSAT Survey Chart
      • Dot Plot Chart
      • Double Bar Graph
      • Funnel Chart
      • Gauge Chart
      • Likert Scale Chart
      • Matrix Chart
      • Multi Axis Line Chart
      • Overlapping Bar Chart
      • Pareto Chart
      • Radar Chart
      • Radial Bar Chart
      • Sankey Diagram
      • Scatter Plot Chart
      • Slope Chart
      • Sunburst Chart
      • Tornado Chart
      • Waterfall Chart
      • Word Cloud
    • Google Sheets
      Microsoft Excel
  • Services
  • Pricing
  • Contact us
  • Blog
  • Support dropdown img
      • Gallery
      • Videos
      • Contact us
      • FAQs
      • Resources
    • Please feel free to contact us

      atsupport@chartexpo.com

Categories
All Data Visualizations Data Analytics Surveys
Add-ons/
  • Google Sheets
  • Microsoft Excel
  • Power BI
All Data Visualizations Data Analytics Surveys
Add-ons
  • Google Sheets
  • Microsoft Excel
  • Power BI

We use cookies

This website uses cookies to provide better user experience and user's session management.
By continuing visiting this website you consent the use of these cookies.

Ok

ChartExpo Survey


Home > Blog > Data Analytics

Primary vs Secondary Research: Which Method Is Better?

Data-driven decisions depend on a foundational choice made before any analysis begins: whether to generate new information or work with what already exists.

Primary vs Secondary Research

Primary vs secondary research defines that divide, and each path carries meaningful consequences for data quality, cost, timeline, and the reliability of conclusions.

This guide explains both approaches, compares their core differences, and shows how to apply both approaches across business scenarios.

Whether you are building a new study from scratch, leveraging existing datasets, or deciding when to combine both, a clear grasp of these methods is essential for producing insights that hold up under scrutiny.

Table of Contents:

  1. What is Primary vs Secondary Research in Primary Research?
  2. What is Primary vs Secondary Research in Secondary Research?
  3. Primary vs Secondary Research: Key Difference
  4. When to Use Primary and Secondary Research?
  5. Types of Primary vs Secondary Research
  6. Secondary vs Primary Research Methods
  7. Primary vs Secondary Research Examples
  8. How to Conduct Primary vs Secondary Research?
  9. How to Analyze Primary vs Secondary Research in Power BI?
  10. Pros and Cons of Primary vs Secondary Research
  11. Best Practices for Primary vs Secondary Research
  12. Which Research Strategy Should You Choose?
  13. FAQs
  14. Wrap Up

What is Primary vs Secondary Research in Primary Research?

Definition: Primary research is the process of collecting original data directly from first-hand sources to answer a specific question or defined objective. In primary vs secondary research, this approach produces entirely new datasets structured around precise analytical goals.

Because researchers control every stage of data collection, from variables measured to how responses are recorded, the resulting information is highly targeted. This control makes primary research especially valuable when existing data cannot adequately address the problem.

Common collection techniques include surveys, interviews, focus groups, observational studies, and controlled experiments. Organizations use these methods to gauge customer satisfaction, test market assumptions, and validate strategies.

What is Primary vs Secondary Research in Secondary Research?

Definition: Secondary research draws on data already gathered by other researchers or institutions for separate purposes. When evaluating primary vs secondary research, this approach converts existing work into analytical value rather than generating raw data from scratch.

Typical sources include government databases, academic journals, industry reports, and historical records. Because this information already exists, broad datasets can be accessed quickly and at low cost.

Reliability depends on source quality and contextual fit with current objectives. Secondary research suits situations where budget, timelines, or respondent access limits direct collection.

Primary vs Secondary Research: Key Difference

Both methods inform decisions, but the operational mechanics of primary and secondary research differ considerably.

Aspect

Primary Research

Secondary Research

Data Source Collected firsthand Previously published
Cost & Time Higher investment Lower investment
Accuracy Highly specific Context-dependent
Data Control Full control Limited control
Reliability Strong if well designed Depends on source quality
Examples Surveys, experiments Reports, databases

When to Use Primary and Secondary Research?

Each approach serves distinct analytical purposes; selecting correctly ensures both precision and efficient use of resources.

  • Use primary research when the problem requires data that does not yet exist anywhere.
  • Choose primary methods for measuring customer attitudes, behaviors, or preferences directly.
  • Apply primary research when results must support quantitative market research or validated models.
  • Use secondary research when analyzing industry trends, historical benchmarks, or competitive landscapes.
  • Rely on secondary sources when corroborating patterns identified in earlier survey results.
  • Combine both methods when cross-validation is needed to strengthen analytical conclusions.
  • Base the choice on the precision required, available budget, and accessibility of data.

Types of Primary vs Secondary Research

Understanding primary and secondary research also requires recognizing the methodological categories within each approach and how they serve different analytical goals.

Primary Research Types

  • Surveys: A structured format used in market research methods to gather standardized responses from a target audience.
  • Interviews: One-on-one conversations designed to capture in-depth qualitative perspectives from participants.
  • Focus Groups: Facilitated discussions where participants share perceptions, opinions, and reactions on a specific topic.
  • Observational Studies: Systematic monitoring of real-world behaviors without direct researcher involvement.
  • Experiments / Field Trials: Controlled tests measuring cause-and-effect outcomes under defined conditions.

Secondary Research Types

  • Government Reports: Official publications covering demographic data, economic conditions, and sector statistics.
  • Industry Studies: Reports examining market performance, competitive dynamics, and sector-wide trends.
  • Academic Journals: Peer-reviewed studies providing validated theoretical and empirical findings.
  • Market Research Reports: Commercial analyses covering consumer behavior and market dynamics.
  • Online Databases: Centralized repositories of historical and aggregated data for structured analysis.

Secondary vs Primary Research Methods

Executing secondary vs primary research correctly means matching collection and analysis methods to the nature of the data being gathered.

  • Structured vs unstructured data collection: Structured formats ensure consistency, while unstructured approaches are common in exploratory consumer research.
  • Qualitative vs quantitative comparison: Qualitative methods interpret meaning and perception; quantitative methods measure numerical relationships and statistical patterns.
  • Behavioral vs statistical evaluation: Behavioral approaches examine real-world actions; statistical evaluation derives insight from numerical patterns and inferential analysis.
  • Technology-assisted response capture: Digital tools accelerate data gathering and feature prominently in many research survey examples across industries.
  • Analytical validation techniques: Validation processes reduce bias, confirm measurement consistency, and strengthen the overall credibility of research outcomes.

Primary vs Secondary Research Examples

Practical scenarios illustrate how organizations across various sectors apply both approaches. The examples below make the methodological distinction concrete and show how each approach addresses specific analytical challenges in real-world business and research contexts.

  • Business & Marketing Customer Experience Evaluation

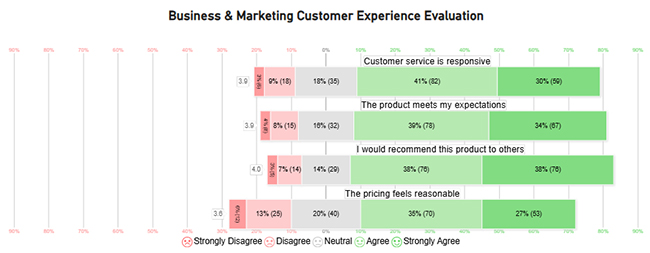
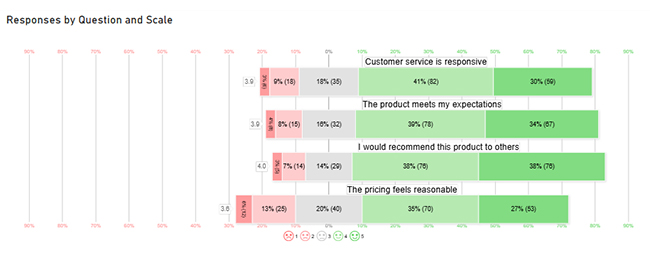
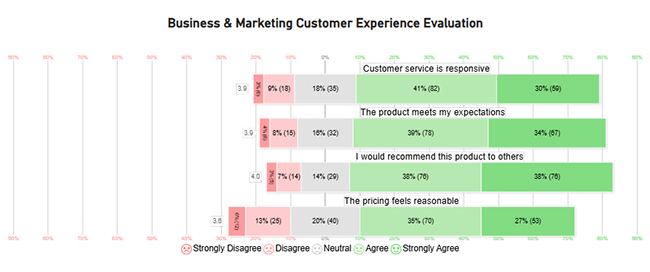
A marketing team conducted a customer satisfaction survey to evaluate product experience, pricing perception, service quality, and recommendation intent. Results revealed strong brand advocacy and high satisfaction with service delivery, while pricing emerged as the primary area requiring improvement.

Primary vs Secondary Research
  • National Health Database Evaluation

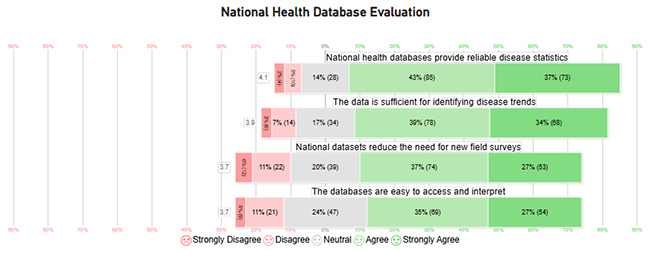
Researchers reviewed national health databases to assess data reliability and usability across institutions. The evaluation found strong agreement on accuracy and trend identification, with moderate concerns about accessibility and a reduced need for new field-based data collection efforts.

Primary vs Secondary Research
  • Product Adoption & User Satisfaction

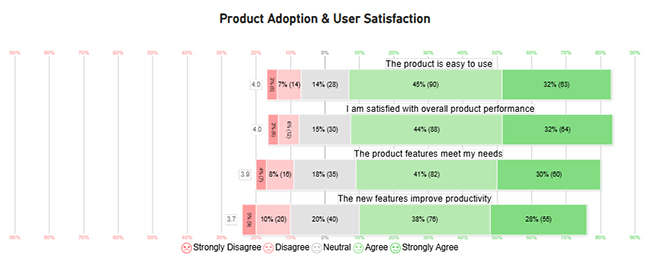
A technology company analyzed user feedback to assess product adoption and overall satisfaction levels. Usability and performance scored consistently high across most response categories, while findings identified clear opportunities to improve feature-driven productivity outcomes for active users.

Primary vs Secondary Research

How to Conduct Primary vs Secondary Research?

Reliable results from both research approaches depend on clear objectives, disciplined collection, and structured validation.

Primary Research Workflow

  • Define objectives: Clarify the specific question or problem the research will address.
  • Select collection techniques: Choose suitable methods, such as interviews or a market research survey.
  • Gather responses: Collect raw data from participants, observations, or experimental results.
  • Validate accuracy: Review data for errors, inconsistencies, and response bias.
  • Interpret findings: Analyze validated data to extract actionable insights.

Secondary Research Workflow

  • Define scope: Establish what information is needed and the search limits.
  • Identify credible sources: Locate authoritative reports, peer-reviewed publications, or databases.
  • Compile datasets: Gather and organize relevant existing data into a structured format.
  • Evaluate reliability: Assess each source for accuracy, recency, and relevance.
  • Derive insights: Convert data patterns into conclusions that support market analysis.

How to Analyze Primary vs Secondary Research in Power BI?

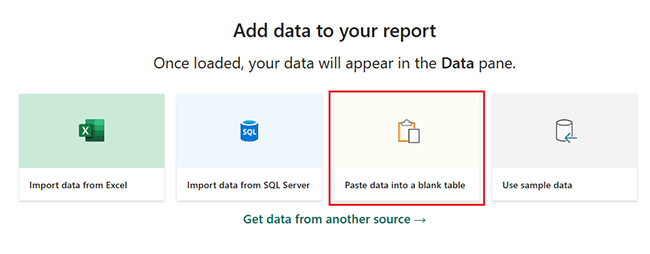
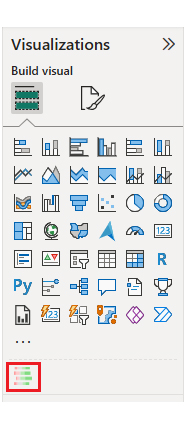
Analyzing both research types in Power BI follows a clear and structured approach.

  • Import datasets: Load data from a Microsoft survey or other structured external sources.
  • Clean and standardize variables: Resolve formatting inconsistencies and confirm reliable field structures.
  • Build relationships between fields: Connect variables across tables to enable multi-dimensional analysis.
  • Create visuals for comparison: Develop dashboards using approaches drawn from Power BI report examples.
  • Interpret patterns: Translate visual outputs into concrete, actionable decisions.

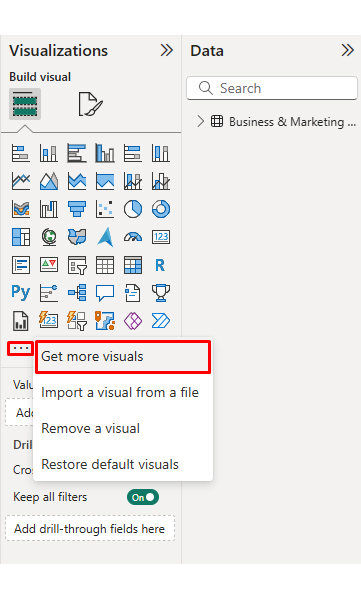
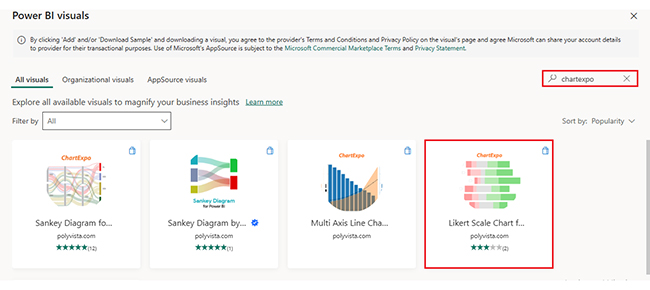
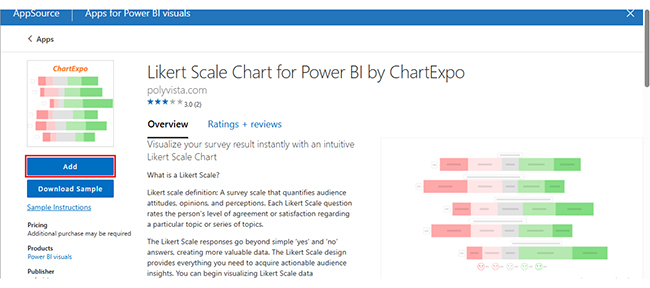
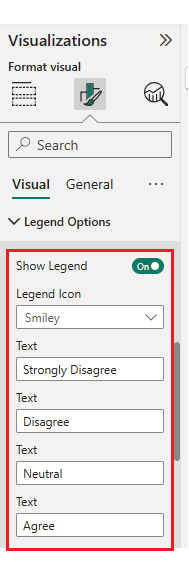
The quality of visualization directly shapes what can be understood from perception-driven research data. Power BI offers a capable set of native visuals, but ChartExpo extends those capabilities with chart formats purpose-built for analytical storytelling, making response distributions and comparisons more intuitive.

Why use ChartExpo?

  • Delivers specialized visuals for Power BI that surface patterns standard charts frequently miss.
  • Turns complex response distributions into clear, presentation-ready outputs for faster decisions.
  • Available with a 7-day free trial, with continued access at $10/month.

Example:

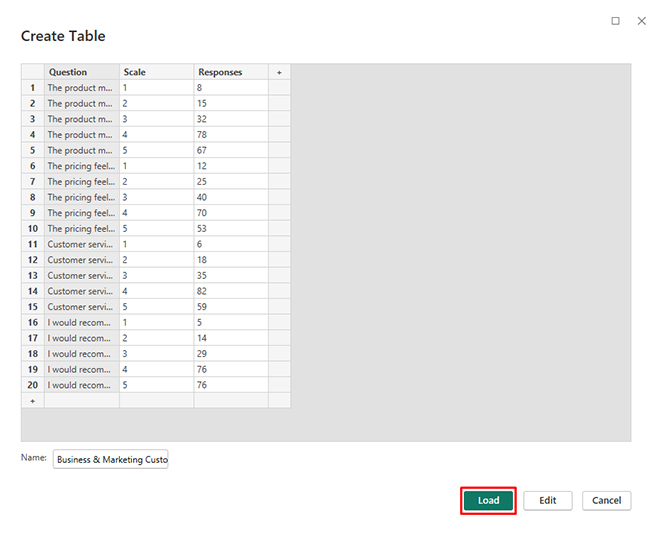
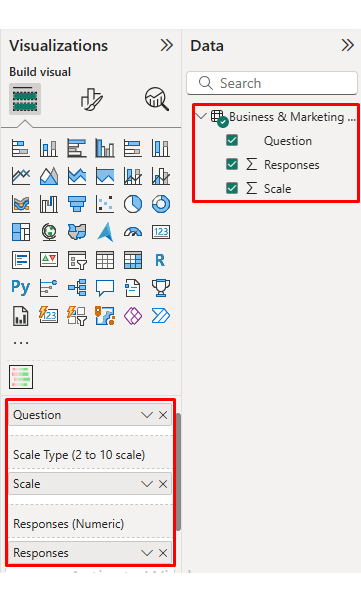
Consider we have the following data for the Likert Scale Chart.

Question Scale Responses
The product meets my expectations 1 8
The product meets my expectations 2 15
The product meets my expectations 3 32
The product meets my expectations 4 78
The product meets my expectations 5 67
The pricing feels reasonable 1 12
The pricing feels reasonable 2 25
The pricing feels reasonable 3 40
The pricing feels reasonable 4 70
The pricing feels reasonable 5 53
Customer service is responsive 1 6
Customer service is responsive 2 18
Customer service is responsive 3 35
Customer service is responsive 4 82
Customer service is responsive 5 59
I would recommend this product to others 1 5
I would recommend this product to others 2 14
I would recommend this product to others 3 29
I would recommend this product to others 4 76
I would recommend this product to others 5 76
  • Log in to Power BI.
  • Enter your email. Click the “Submit” button.
Primary vs Secondary Research
  • You are redirected to your Microsoft account.
  • Enter your password and click “Sign in”.
Primary vs Secondary Research
  • Choose whether to stay signed in.
Primary vs Secondary Research
  • First, you need to add data to your report and click on the “Paste data into a blank report”.
Primary vs Secondary Research
  • Paste the data table above into a blank table, name it, and click on the “Load” button.
Primary vs Secondary Research
  • To build a Likert Chart, import the visual from App Source by opening the Visualizations panel in Power BI.
  • Select “Get more Visuals”.
Primary vs Secondary Research
  • Search ChartExpo and select the Likert Chart.
Primary vs Secondary Research
  • Click on the “Add” button.
Primary vs Secondary Research
  • After that, you can select the “Likert Chart” icon in the visualization panel.
Primary vs Secondary Research
  • To add a Likert Chart visual, click on the chart icon and choose the dimension and measures.
Primary vs Secondary Research
  • In Visualization’s properties, click on “License Settings” and add the key so that you’ll see the Likert Chart without a watermark.
Primary vs Secondary Research
  • Now, after applying the key, the watermark is removed from the chart, and our chart is shown below.
Primary vs Secondary Research
  • We can modify the chart’s title to better align with the visualized data.
Primary vs Secondary Research
  • You can change the legend text as well.
Primary vs Secondary Research
  • The final look of the Likert Chart is shown below.
Primary vs Secondary Research

Key Insights

  • Recommendation intent reached 76%, pointing to a strong pool of brand advocates.
  • Product expectations and customer service both surpassed 70% positive ratings, reflecting consistent performance.
  • Pricing earned the lowest scores overall, with higher dissatisfaction rates than any other measured attribute.

Pros and Cons of Primary vs Secondary Research

Weighing the advantages and limitations of primary vs secondary research supports better-structured studies and more reliable outcomes.

Primary Research

Advantages

  • Generates data precisely aligned with the research question.
  • Gives researchers full control over study design and collection.
  • Produces direct evidence of actual behaviors and preferences.
  • Enables focused, problem-specific analysis.

Limitations

  • Requires significant time and financial investment.
  • Susceptible to bias, sampling errors, and design flaws.
  • Logistically demanding, especially at scale.
  • Greater scale increases cost and operational complexity.

Secondary Research

Advantages

  • Faster to access and substantially less expensive.
  • Well-suited for trends, benchmarks, and historical analysis.
  • Provides access to large, pre-existing datasets.
  • Supports exploratory analysis at low cost.

Limitations

  • No control over how the original data was collected or verified.
  • Sources may be outdated, biased, or contextually misaligned.
  • Context differences can reduce accuracy for new objectives.

Best Practices for Primary vs Secondary Research

Applying primary vs secondary research effectively requires careful planning, source discipline, and consistent methodological rigor throughout.

  • Clearly define analytical objectives: Establish measurable goals before selecting any collection method or data source.
  • Validate credibility of data sources: Confirm that datasets are current, unbiased, and suited to the research question.
  • Combine methods strategically: Use both approaches together when cross-validation will strengthen final conclusions.
  • Avoid outdated datasets: Prioritize recency and relevance, particularly for work involving forecasting in Power BI.
  • Maintain ethical standards: Follow responsible practices for data collection, storage, and participant confidentiality.
  • Ensure transparency in interpretation: Document all assumptions, limitations, and methodological decisions clearly.

Which Research Strategy Should You Choose?

The right method in primary vs secondary research depends on three factors: the precision required, available resources, and timeline constraints. When the objective demands original, highly targeted data, primary research provides the necessary control and specificity.

When existing data sufficiently answers the question, secondary research offers speed and cost efficiency. Combining both methods produces the strongest results, with secondary analysis informing the hypothesis and primary research confirming it.

FAQs

What is an example of primary and secondary data in research?

Primary data is gathered directly from respondents through tools such as interviews, surveys, or structured observations. Secondary data comes from pre-existing sources, including published reports, government records, or institutional databases.

How to know if research is primary or secondary?

If data were collected by the researcher for the current study, it is primary research. If it was previously gathered by someone else and is now being reused or reanalyzed, it qualifies as secondary research.

Are trials primary or secondary research?

Clinical and field trials are classified as primary research because the investigator directly generates new observations under controlled or monitored conditions rather than reusing data from prior work.

Wrap Up

The distinction between primary vs secondary research shapes more than methodology; it determines the quality, relevance, and trustworthiness of every insight a team produces.

Knowing when to collect original data, when to draw on existing sources, and when to effectively combine both approaches separates reactive reporting from deliberate, evidence-based analytical strategy.

When the right method is matched to the right objective, sources are rigorously evaluated, and findings are communicated with clarity and precision, research becomes a genuine competitive asset. These principles, applied with consistency, give analysts and business teams the foundation to convert raw data into confident, well-supported decisions.

How much did you enjoy this article?

ExcelAd1
Start Free Trial!
160205

Related articles

next previous
Data Analytics12 min read

Staff Onboarding Template: Insights for HR Decisions

Staff onboarding template: discover how to build, track, and analyze a process that gets new hires productive from day one. Read on!

Data Analytics10 min read

What are DORA Metrics: A Complete Guide

What are DORA Metrics? Discover the four KPIs every engineering team needs to track delivery speed, stability, and reliability. Read on!

Data Analytics12 min read

Analytics in Insurance Industry: From Data to Clear Insights

Analytics in insurance industry turns claims, policy, and service data into decisions for pricing, fraud checks, and retention. Read on!

Data Analytics9 min read

Cost Per Hire: Analyzing Hiring Costs Easily

Cost Per Hire shows what each hire costs and where the money goes. Use the formula, examples, and Excel steps to track spend. Read on!

Data Analytics12 min read

Need Analysis Template: A Complete Guide

A need analysis template transforms scattered observations into structured, evidence-based decisions. Discover how to close performance gaps. Read on!

ChartExpo logo

Turn Data into Visual
Stories

CHARTEXPO

  • Home
  • Gallery
  • Videos
  • Services
  • Pricing
  • Contact us
  • FAQs
  • Privacy policy
  • Terms of Service
  • Sitemap

TOOLS

  • ChartExpo for Google Sheets
  • ChartExpo for Microsoft Excel
  • Power BI Custom Visuals by ChartExpo
  • Word Cloud

CATEGORIES

  • Bar Charts
  • Circle Graphs
  • Column Charts
  • Combo Charts
  • Comparison Charts
  • Line Graphs
  • PPC Charts
  • Sentiment Analysis Charts
  • Survey Charts

TOP CHARTS

  • Sankey Diagram
  • Likert Scale Chart
  • Comparison Bar Chart
  • Pareto Chart
  • Funnel Chart
  • Gauge Chart
  • Radar Chart
  • Radial Bar Chart
  • Sunburst Chart
  • see more
  • Scatter Plot Chart
  • CSAT Survey Bar Chart
  • CSAT Survey Chart
  • Dot Plot Chart
  • Double Bar Graph
  • Matrix Chart
  • Multi Axis Line Chart
  • Overlapping Bar Chart
  • Control Chart
  • Slope Chart
  • Clustered Bar Chart
  • Clustered Column Chart
  • Box and Whisker Plot
  • Tornado Chart
  • Waterfall Chart
  • Word Cloud
  • see less

RESOURCES

  • Blog
  • Resources
  • YouTube
SIGN UP FOR UPDATES

We wouldn't dream of spamming you or selling your info.

© 2026 ChartExpo, all rights reserved.