• Home
  • Tools dropdown img
    • Spreadsheet Charts

      • ChartExpo for Google Sheets
      • ChartExpo for Microsoft Excel
    • Power BI Charts

      • Power BI Custom Visuals by ChartExpo
    • Word Cloud

  • Charts dropdown img
    • Chart Category

      • Bar Charts
      • Circle Graphs
      • Column Charts
      • Combo Charts
      • Comparison Charts
      • Line Graphs
      • PPC Charts
      • Sentiment Analysis Charts
      • Survey Charts
    • Chart Type

      • Box and Whisker Plot
      • Clustered Bar Chart
      • Clustered Column Chart
      • Comparison Bar Chart
      • Control Chart
      • CSAT Survey Bar Chart
      • CSAT Survey Chart
      • Dot Plot Chart
      • Double Bar Graph
      • Funnel Chart
      • Gauge Chart
      • Likert Scale Chart
      • Matrix Chart
      • Multi Axis Line Chart
      • Overlapping Bar Chart
      • Pareto Chart
      • Radar Chart
      • Radial Bar Chart
      • Sankey Diagram
      • Scatter Plot Chart
      • Slope Chart
      • Sunburst Chart
      • Tornado Chart
      • Waterfall Chart
      • Word Cloud
    • Google Sheets
      Microsoft Excel
  • Services
  • Pricing
  • Contact us
  • Blog
  • Support dropdown img
      • Gallery
      • Videos
      • Contact us
      • FAQs
      • Resources
    • Please feel free to contact us

      atsupport@chartexpo.com

Categories
All Data Visualizations Data Analytics Surveys
Add-ons/
  • Google Sheets
  • Microsoft Excel
  • Power BI
All Data Visualizations Data Analytics Surveys
Add-ons
  • Google Sheets
  • Microsoft Excel
  • Power BI

We use cookies

This website uses cookies to provide better user experience and user's session management.
By continuing visiting this website you consent the use of these cookies.

Ok

ChartExpo Survey


Home > Blog > Data Analytics

Logistics KPIs: See the Big Picture and Win

What are logistics KPIs, and why do they matter so much?

Numbers don’t lie. But they must be tracked, understood, and acted on – that’s the role of KPIs in logistics. Shipping delays, inventory shortages, and rising fuel costs aren’t random issues. They are signals that are tracked, measured, and improved through these KPIs.

Logistics KPIs

In 2023, over 60% of supply chain leaders reported disruptions due to poor visibility. Without clear performance metrics, logistics operations quickly lose efficiency. Every late delivery or stockout chips away at customer trust and profit margins.

Logistics KPIs offer direction. They track delivery times, warehouse accuracy, order fulfillment rates, and more. For example, Amazon uses real-time data and KPIs to maintain its two-day delivery promise and stay ahead.

The pressure is growing. Consumers expect faster shipping and real-time tracking. According to McKinsey, e-commerce demand has increased logistics costs by 15% in just two years. Without logistics KPIs, companies risk falling behind. This applies not only to global giants. Small and mid-sized businesses need these indicators, too. From freight tracking to last-mile delivery, every process can be improved if measured correctly.

In this blog, we’ll explain which KPIs matter most and how to measure them. You’ll see why logistics teams can’t afford to ignore them anymore. We’ll also look at KPI for freight forwarders—what they use, why it matters, and how the right metrics turn daily chaos into predictable success.

Ready to measure what matters? Let’s begin.

Table of Contents:

  1. What are Logistics KPIs?
  2. What is the Importance of Monitoring Transportation KPI?
  3. How to Choose KPIs for Logistics?
  4. How to Analyze the Logistics KPIs in Excel?
  5. How to Use KPIs for Freight Forwarders?
  6. Tips for Tracking Logistics KPIs
  7. FAQs
  8. Wrap Up

What are Logistics KPIs?

Definition: Logistics KPIs are measurable values used to track logistics performance. For instance, transportation KPI metrics help companies monitor delivery speed and fuel usage.

Logistics Key Performance Indicators also cover warehousing efficiency and inventory turnover. These KPIs highlight delays, excess costs, and weak links in the supply chain. Businesses utilize them to enhance operations and improve customer satisfaction. Without them, it’s hard to stay competitive. Tracking the right data leads to smarter, faster, and more efficient logistics decisions.

What is the Importance of Monitoring Transportation KPI?

Are you wondering how to minimize delays, reduce costs, and ensure timely deliveries? You need clear, measurable data. Transportation KPIs help logistics teams move from guesswork to smart decisions. The right KPIs highlight where to act—and why it matters.

Here’s how transportation KPIs drive better logistics:

  • Enhances delivery performance: Late deliveries hurt customer trust. Use KPIs to track on-time rates, spot weak routes, and improve speed across the board.
  • Controls transportation costs: Monitor cost per shipment, fuel use, and route efficiency. Small tweaks based on KPI data can lead to significant savings.
  • Improves operational efficiency: Identify delays at loading docks or long idle times. Streamlined operations mean fewer hiccups and faster turnarounds.
  • Increases supply chain visibility: Real-time tracking KPIs help you follow every shipment, reduce blind spots, and respond fast to disruptions.
  • Supports better strategic planning: Data from KPI Graphs lets you forecast needs, manage resources, and confidently prepare for peak demand.
  • Drives continuous improvement: Logistics success is never static. Customer success KPIs help teams spot trends, set goals, and raise performance over time.

How to Choose KPIs for Logistics?

Choosing logistics KPIs isn’t about picking random metrics from a checklist. It’s about clarity—tracking what truly drives your supply chain performance. The smart move? Build KPIs that align with your business goals and drive decisions.

Here’s how to choose the right KPIs for logistics:

  • Align with business objectives: KPIs should reflect your top priorities. Want faster deliveries? Lower transport costs? Fewer returns? Start there. Don’t track delivery time just because others do—track it if it’s critical to your customer promise or cost strategy.
  • Focus on key logistics activities: Break down your logistics process into procurement, warehousing, shipping, and last-mile delivery. Then, choose KPIs that spotlight performance in each area. For example, measure pick accuracy or warehouse cycle time if inventory errors hurt your fulfillment.
  • Make KPIs measurable and actionable: Avoid vague goals like “improve delivery quality”. Instead, apply SMART KPIs, like “reduce average delivery time from 4 to 3 days by Q3”. Clarity drives accountability.
  • Balance leading and lagging indicators: Use leading indicators (like order processing time) to prevent problems before they grow. Combine them with lagging indicators (like the number of late deliveries) to assess what has already happened and why.
  • Keep it simple and relevant: More data doesn’t mean better decisions. Focus on 5–10 high-impact KPIs. Even customer service KPI metrics, like delivery satisfaction scores, can reflect logistics performance if customer experience is a key objective.

How to Analyze the Logistics KPIs in Excel?

You can get the numbers down when analyzing logistics KPIs in Excel. But turning them into actionable insights? That’s where Excel hits a wall. Sure, it handles data like a pro, but when it comes to visuals? It can feel like trying to paint a masterpiece with a blunt pencil.

This is where data visualization steps in to save the day. With tools like ChartExpo, you can turn your KPIs into clear, interactive visuals—everything Excel leaves out. Let’s see how you can use both to unlock logistics insights.

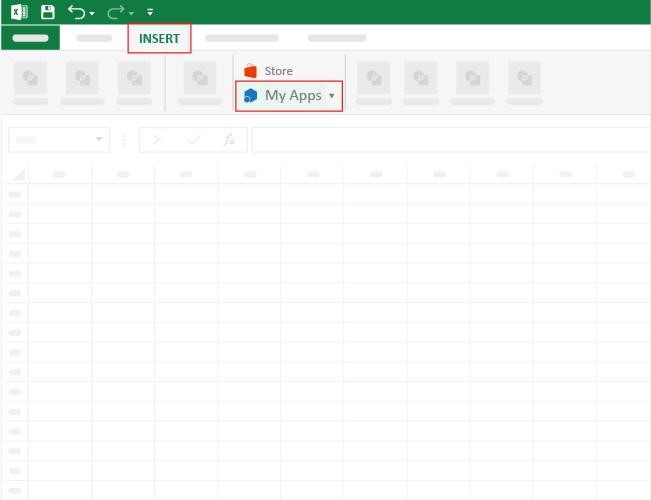
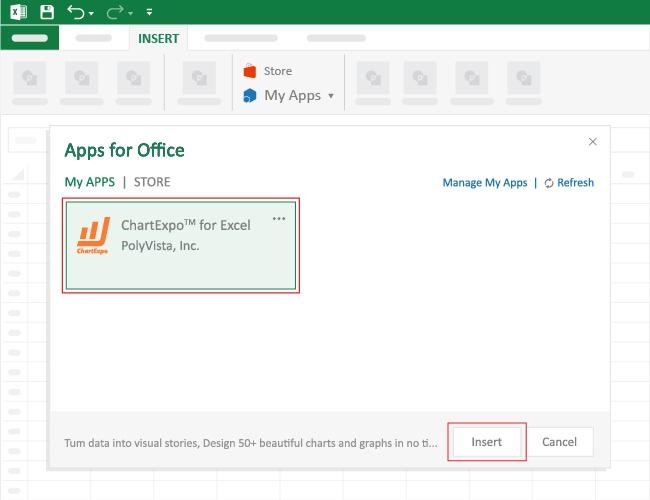
How to Install ChartExpo in Excel?

  1. Open your Excel application.
  2. Open the worksheet and click the “Insert” menu.
  3. You’ll see the “My Apps” option.
  4. In the Office Add-ins window, click “Store” and search for ChartExpo on my Apps Store.
  5. Click the “Add” button to install ChartExpo in your Excel.

ChartExpo charts are available both in Google Sheets and Microsoft Excel. Please use the following CTAs to install the tool of your choice and create beautiful visualizations with a few clicks in your favorite tool.

Example

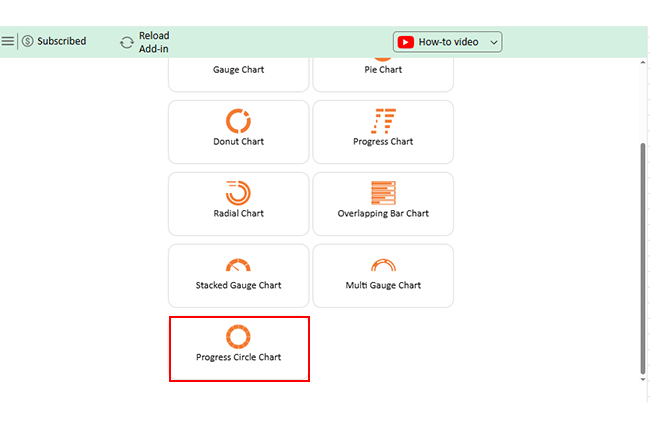
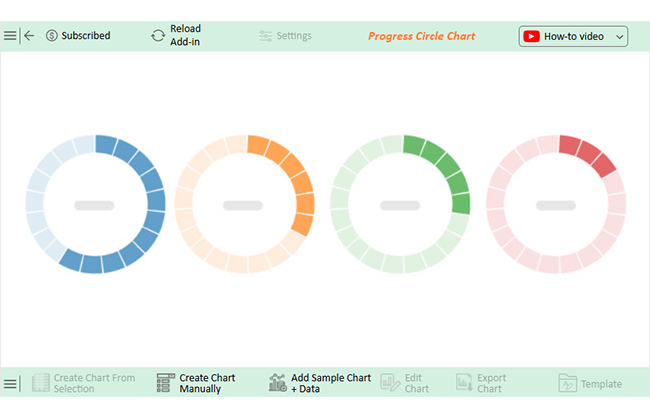
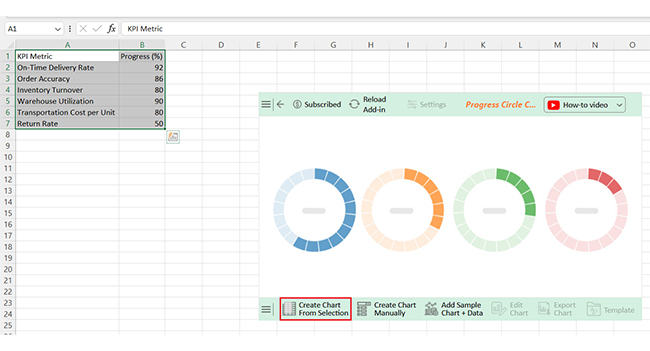
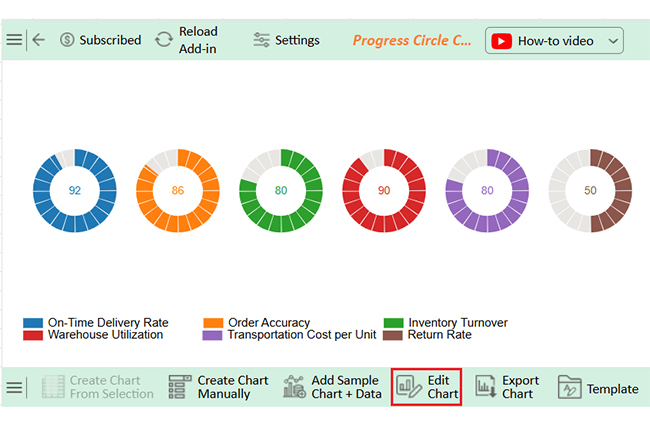
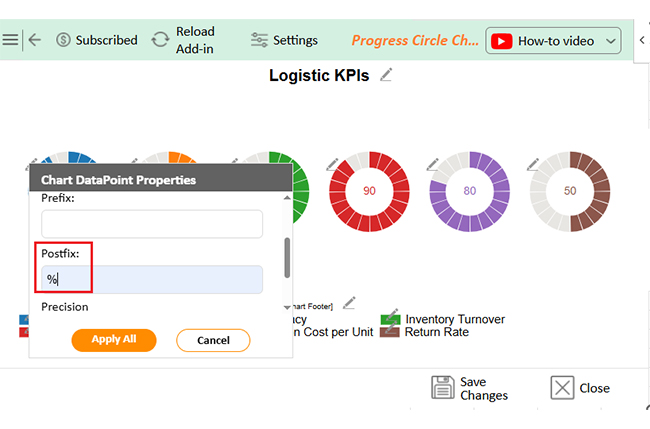
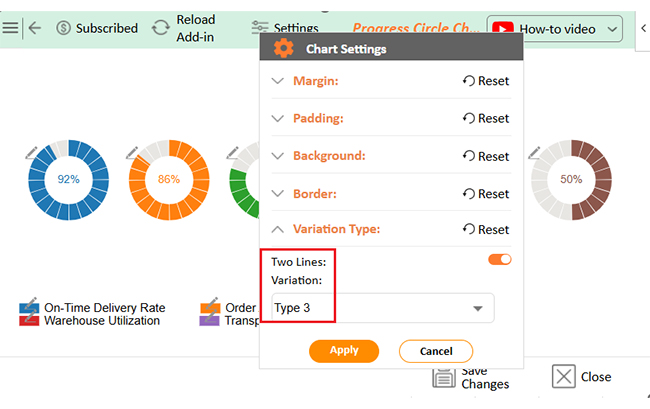
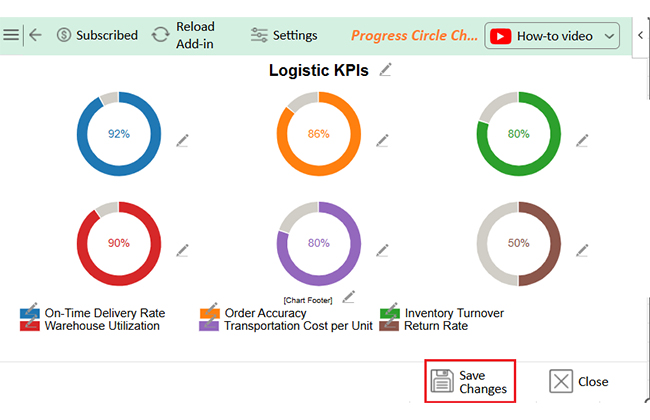
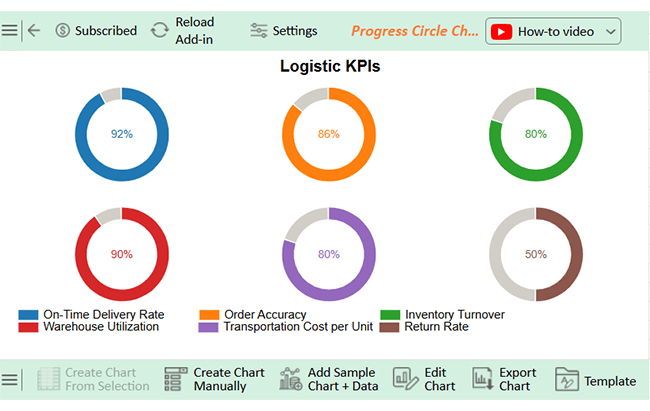
Let’s visualize and analyze the key performance indicators for operations data below in Excel using ChartExpo.

KPI Metric Progress (%)
On-Time Delivery Rate 92
Order Accuracy 86
Inventory Turnover 80
Warehouse Utilization 90
Transportation Cost per Unit 80
Return Rate 50
  • To get started with ChartExpo, install ChartExpo in Excel.
  • Now, click on My Apps from the INSERT menu.
Logistics KPIs 1
  • Choose ChartExpo from My Apps, then click Insert.
Logistics KPIs 2
  • Once it loads, scroll through the charts list to locate and choose the “Progress Circle Chart”.
Logistics KPIs 3
  • The Progress Circle Chart will appear as follows.
Logistics KPIs 4
  • Click the “Create Chart From Selection” button after selecting the data from the sheet, as shown.
Logistics KPIs 5
  • ChartExpo will generate the visualization below for you.
Logistics KPIs 6
  • If you want to add anything to the chart, click the Edit Chart button:
  • Click the pencil icon next to the Chart Header to change the title.
  • It will open the properties dialog. Under the Text section, you can add a heading in Line 1 and enable Show.
  • Give the appropriate title of your chart and click the Apply button.
Logistics KPIs 7
  • You can add the (%) with all values:
Logistics KPIs 8
  • You can change the variation type by clicking on Settings as follows:
Logistics KPIs 9
  • Click the “Save Changes” button to persist the changes made to the chart.
Logistics KPIs 10
  • Your final Progress Circle Chart will look like the one below.
Logistics KPIs 11

Insights

  • On-Time Delivery Rate: 92% – A strong indicator of reliable delivery performance.
  • Warehouse Utilization: 90% – There is efficient use of warehouse space and resources.
  • Order Accuracy: 86% – Needs improvement to reduce errors and boost customer satisfaction.
  • Inventory Turnover: 80% – Could be higher to reflect faster inventory movement.
  • Return Rate: 50% – A major red flag signaling serious issues requiring immediate action.

How to Use KPIs for Freight Forwarders?

Success in freight forwarding hinges on a mix of speed, cost control, and customer satisfaction. But how do you know if you’re performing well? That’s where KPIs for freight forwarders come into play. These metrics give you the insight to optimize processes, cut costs, and keep customers happy.

Here’s how to use KPIs to improve your freight forwarding operations:

  1. Monitor delivery performance: Late deliveries cost time and money, and monitoring helps spot delays before they become bigger issues. So, track delivery times and accuracy to ensure shipments reach their destination on schedule.
  2. Control transportation costs: Freight costs can quickly spiral out of control. Use KPIs for freight forwarders to monitor fuel efficiency, route optimization, and shipment size to manage costs. Even small adjustments can lead to significant savings.
  3. Measure customer satisfaction: Customer expectations are higher than ever. Measure satisfaction through delivery speed, order accuracy, and communication. Consistently tracking these KPIs can help improve customer relationships and reduce complaints.
  4. Track operational efficiency: Efficiency is the backbone of any logistics operation. Track key metrics like warehouse turnaround time, loading dock performance, and freight handling to improve the overall flow of operations.
  5. Support continuous improvement: Freight forwarding is always evolving. So, use Retail Industry KPIs to identify weaknesses and areas for growth. Continuous tracking helps you refine processes, implement best practices, and stay ahead of the competition.

Tips for Tracking Logistics KPIs

Tracking logistics KPIs is more than just collecting data—it’s about ensuring data works for you. Too often, companies gather numbers but fail to turn them into actionable insights. So, how do you track the right metrics?

  1. Set clear, relevant KPIs: Don’t try to measure everything. Focus on the KPIs that directly impact your goals, like on-time delivery or inventory accuracy. Clarity here means better performance.
  2. Use reliable data sources: Accurate data is the foundation of good KPIs. Make sure you’re pulling information from trusted sources. Whether it’s your warehouse management system or transport software, reliability is key.
  3. Define KPI ownership: Assign responsibility for each KPI to ensure accountability. Whether it’s the warehouse manager or the transportation coordinator, clear ownership keeps your team focused.
  4. Create visual dashboards: Numbers on a page don’t mean much unless you can see the story they tell. Use KPI graphs or visual dashboards to display performance trends clearly. This makes it easier to spot issues and improvements.
  5. Monitor regularly and consistently: Set a routine for tracking KPIs. Whether it’s daily, weekly, or monthly, regular check-ins ensure you’re not missing any red flags or opportunities to optimize.
  6. Adjust KPIs as needed: Your logistics goals may evolve. So, adjust KPIs as needed to stay aligned with shifting objectives. Most importantly, keep measuring what matters, not what’s convenient.

FAQs

What are the 6 indicators of the logistics performance index?

The six indicators of the Logistics Performance Index are customs, infrastructure, international shipments, logistics competence, tracking and tracing, and timeliness. These metrics help assess a country’s logistics efficiency, reliability, and ability to move goods effectively across borders.

How to improve KPIs in logistics?

  • Set clear goals.
  • Track the right KPIs.
  • Use real-time data.
  • Improve staff training.
  • Automate repetitive tasks.
  • Optimize routes and inventory.
  • Review performance regularly.
  • Act on insights quickly.
  • Collaborate with partners.
  • Keep adjusting based on what the data tells you.

Wrap Up

Logistics KPIs help you measure what matters, showing how well your supply chain is running. From delivery times to cost efficiency, these numbers tell the story. They keep your team focused and aligned.

Good KPIs are more than reports. They drive decisions. They help reduce waste, improve speed, and boost customer satisfaction. That’s why picking the right ones matters. Metrics and KPIs are your map to smarter operations.

Don’t confuse activity with results. Just because you’re busy doesn’t mean you’re performing. What are sales KPIs? They tell you how well your sales process converts. The same applies to logistics. KPIs reveal the truth behind the action.

Tracking KPIs in Excel is common, but it has limits. Visualizing data can be messy, dashboards are often complex to build, and insights get buried. That’s where ChartExpo changes the game.

ChartExpo makes KPI graphs easy. It connects with Excel – No coding. No clutter. Just clean, clear visuals. Whether you’re tracking customer success KPIs or transportation KPIs, you get answers fast.

Are you ready to improve your logistics? Start with the right KPIs and use tools that make your life easier. Don’t settle for spreadsheets that slow you down. Install ChartExpo and start seeing your logistics data in a whole new way.

How much did you enjoy this article?

PBIAd1
Start Free Trial!
152414

Related articles

next previous
Data Analytics10 min read

Private Equity Waterfall to Uncover Key Insights

Discover the private equity waterfall model and analyze it in Excel. This blog compares the American vs. European models for smarter investment decisions.

Data Analytics9 min read

KPIs for Safety for Visualizing Safety Progress

Learn the importance of KPIs for Safety and how they enhance workplace safety. You’ll discover top KPIs, their benefits, and tips for effective tracking.

Data Analytics24 min read

SWOT Analysis: Why Most Businesses Get It Wrong

SWOT analysis helps reveal what drives business success or failure. Want to avoid costly mistakes and gain a strategic edge? Read on and get started now!

Data Analytics10 min read

Gauge Dashboard: Turning Metrics into Instant Insight

A gauge on dashboard helps visualize key metrics clearly and quickly. Learn how to build, use, and analyze gauge dashboards to boost your business insights.

Data Analytics20 min read

Pivot Reporting: Why Your Reports Aren’t Working for You

Pivot reporting plays a key role in decision-making under pressure. Learn how to avoid common pitfalls and create reliable, actionable insights. Read on!

ChartExpo logo

Turn Data into Visual
Stories

CHARTEXPO

  • Home
  • Gallery
  • Videos
  • Services
  • Pricing
  • Contact us
  • FAQs
  • Privacy policy
  • Terms of Service
  • Sitemap

TOOLS

  • ChartExpo for Google Sheets
  • ChartExpo for Microsoft Excel
  • Power BI Custom Visuals by ChartExpo
  • Word Cloud

CATEGORIES

  • Bar Charts
  • Circle Graphs
  • Column Charts
  • Combo Charts
  • Comparison Charts
  • Line Graphs
  • PPC Charts
  • Sentiment Analysis Charts
  • Survey Charts

TOP CHARTS

  • Sankey Diagram
  • Likert Scale Chart
  • Comparison Bar Chart
  • Pareto Chart
  • Funnel Chart
  • Gauge Chart
  • Radar Chart
  • Radial Bar Chart
  • Sunburst Chart
  • see more
  • Scatter Plot Chart
  • CSAT Survey Bar Chart
  • CSAT Survey Chart
  • Dot Plot Chart
  • Double Bar Graph
  • Matrix Chart
  • Multi Axis Line Chart
  • Overlapping Bar Chart
  • Control Chart
  • Slope Chart
  • Clustered Bar Chart
  • Clustered Column Chart
  • Box and Whisker Plot
  • Tornado Chart
  • Waterfall Chart
  • Word Cloud
  • see less

RESOURCES

  • Blog
  • Resources
  • YouTube
SIGN UP FOR UPDATES

We wouldn't dream of spamming you or selling your info.

© 2025 ChartExpo, all rights reserved.