Categories
In the dynamic landscape of business, understanding the key indicators that propel customer satisfaction and loyalty is not just advantageous; it is essential. These Customer Success Metrics stand as beacons, confidently guiding businesses toward a deeper comprehension of customer needs and experiences.


Let’s imagine you’re the captain of a ship navigating through rough seas. Your goal is to reach a safe harbor.
How do you measure your progress and ensure you’re heading in the right direction?
Just like a ship’s captain, you have to measure your progress toward achieving your goals. One of the go-to ways to do this is using customer success metrics.
Customer success metrics you can use to gauge the effectiveness of customer success programs. More so, these metrics help your business track customer satisfaction, identify areas for improvement, and ultimately increase revenue.
In today’s economic landscape, customer success is more important than ever before. With so many options available to consumers, you have to focus on providing exceptional customer experiences to retain and grow your customer base.
Customer success metrics allow you to track progress in delivering outstanding customer experiences. This ultimately translates into increased customer loyalty and revenue growth.
Whether you’re a small business just starting or a large enterprise looking to optimize your customer success program, understanding customer success metrics is ultra-essential.
Let’s start by defining the Customer success metrics.
Definition: Customer success metrics are measurable indicators you can use to track the effectiveness of customer success programs.
These metrics help your businesses to assess the following:
There are several customer success metrics you can use, namely:
Each of these customer success metrics and KPIs provides you with unique insights into your customer success program’s performance.
For instance, the Customer Churn Rate measures the number of customers who discontinue using your products or services.
On the other hand, Monthly Recurring Revenue (MRR) measures the revenue generated by your business’s subscription-based products or services.
The Net Promoter Score (NPS) checks how likely your customers are to recommend your brand to others.
Business success isn’t just about winning over customers; it’s about keeping them satisfied. Below are some of the reasons why measuring customer success KPIs is crucial.
Satisfied customers are more inclined to share positive feedback, which can attract new customers through word-of-mouth referrals. Customer success KPIs allow you to gauge customer satisfaction with your offerings. Then, use the insights to optimize your offerings to better meet customer needs.
Customer success KPIs help identify pain points and areas of improvement in the customer journey visualization. Understanding these pain points allows you to proactively address issues and improve the customer experience.
One of the primary goals of customer success is to retain existing customers. Measuring KPIs related to customer retention helps track how well you retain your customer base. Improving customer retention reduces the need for expensive customer acquisition efforts, contributing to sustainable revenue growth.
Customer success KPIs provide valuable data to optimize strategies and initiatives to enhance the customer experience. For instance, you can analyze usage data and feature adoption rates to identify the most valuable features. Then focus on promoting those aspects. This approach ensures that resources are allocated to activities that have the most significant impact on customer success.
Product adoption ensures that customers fully leverage the value of the products or services they purchase. Customer success KPIs shed light on how well customers are embracing the product. Understanding valuable features and obstacles helps improve customer onboarding and targeted training, enhancing product adoption.
This metric measures how satisfied customers are with a specific interaction, product, or service. Typically gathered through surveys immediately after a support interaction or product use, CSAT is expressed as a percentage, with higher scores indicating greater satisfaction. It’s useful for assessing immediate customer sentiment.
This composite metric combines various indicators, such as product usage frequency, customer engagement, and support requests, to assess the overall health of a customer relationship. A high health score often correlates with higher retention and upsell potential.
This metric measures additional revenue generated from existing customers through upsells, cross-sells, or renewals. It reflects the success of efforts to increase the value delivered to current customers and indicates the effectiveness of growth strategies.
TTV measures the time it takes for a customer to realize the value of a product or service after purchase. A shorter TTV can lead to higher satisfaction and quicker customer success, making this metric essential for optimizing onboarding processes.
CES assesses how easy it is for customers to resolve issues or achieve their goals with a company’s product or service. A lower effort score signifies a smoother, more user-friendly experience, which is often linked to higher customer satisfaction.
This metric tracks the rate at which new customers start using the product’s features or services. High adoption rates can indicate successful onboarding and a product that meets customer needs effectively.
This measures the percentage of customers who renew their subscriptions or service contracts. A high renewal rate often signifies strong customer satisfaction and perceived value, while a low rate might highlight areas for improvement in service delivery.
In the coming sections, we’ll dive deeper into the 13 customer success metrics.
You don’t want to miss this.
What are the key metrics for measuring products’ performance?
While the answer may vary depending on the niche, customer success metrics play a crucial role in shaping a product/service’s success.
Below are the top 5 metrics for measuring product performance:
By tracking these customer success metrics, you can gain valuable insights into your product’s performance and make data-driven decisions.
In the following sections, we’ll dive deeper into the customer success metrics and explore how they work and how you can use them to drive success.
This is the percentage of customers who stop using your product or service.
It includes canceled subscriptions, closed accounts, loss of recurring value, and loss of a recurring business or contract. Measuring customer churn rate is crucial because it serves as a key performance indicator of your customer success strategy.
To calculate the churn rate, divide the total number of churned customers in a given period by the total number of all onboarded customers.
You can track this customer success metric monthly or annually, depending on your needs.
Churn Rate Formula:
Total number of churned customers / total number of all customers = Customer Churn Rate.
This is a crucial metric for subscription-based or Software-as-a-Service (SaaS) businesses.
This is because it provides a normalized calculation of predictable monthly revenue.
If your business is predominantly SaaS, use MRR for financial forecasting, growth measurement, and momentum tracking.
This customer success metric offers consistent and accurate financial projections, allowing you to plan accordingly. Additionally, MRR serves as a critical indicator for businesses backed by venture capitalists, such as Y-Combinator
To calculate Monthly Recurring Revenue, multiply your Monthly Average Revenue per User (ARPU) by the total number of active users.
Average Revenue per User (ARPU) represents the average revenue received per user in a given timeframe.
And it’s popular among businesses in industries such as SaaS, digital media, social media, etc. This metric can provide valuable insights into your business’s profit generation capability, customer understanding, financial forecasting, etc.
To calculate ARPU, take your total revenue and divide it by the average number of users during a selected period.
Remember, ARPU operates on a monthly paid subscription model.
The formula to calculate ARPU is:
Total Revenue / Average Users = Average Revenue per User.
Net Dollar Retention is a customer success metric you can use to measure the change in revenue generated by existing customers. Use the metric to track recurring revenue changes over time due to upgrades, downgrades, and churn. NDR provides insights into your business’s overall health.
To calculate NDR, use the following formula:
(Starting MRR + expansion ”“ downgrades ”“ churn) / Starting MRR * 100
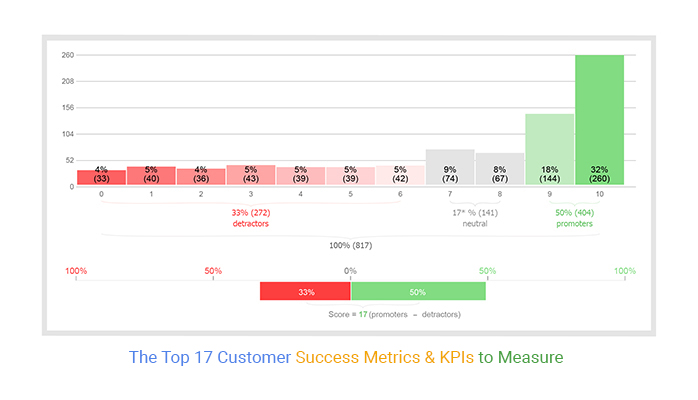
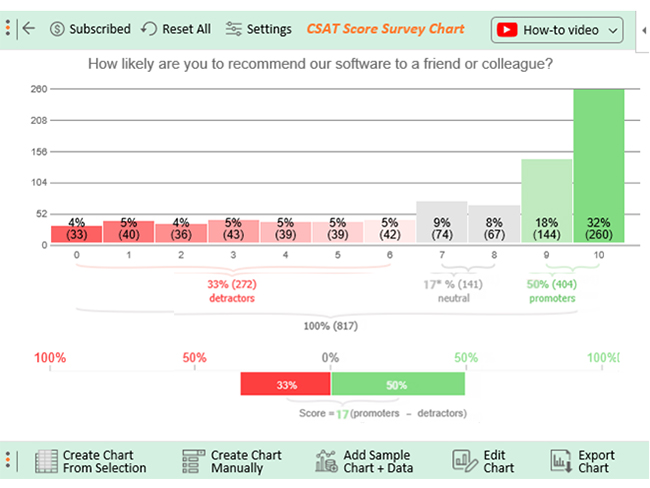
Net Promoter Score is a customer success metric you can use to measure customer satisfaction and loyalty.
NPS tracks the likelihood of customers recommending a product or service on a scale of 0 to 10.
The metric classifies customers as detractors (0-6), passives (7-8), and promoters (9-10).
Calculate NPS by subtracting the percentage of detractors from the percentage of promoters.
Promoters – Detractors = NPS
Customer Satisfaction Score tracks how satisfied customers are with your product or service.
It’s measured by asking customers to rate their satisfaction level on a scale of 1-5 or “not satisfied at all” to “extremely satisfied.”
To calculate CSAT, divide the number of satisfied customers by the total number of responders. And then, multiply by 100.
(Number of satisfied customers / Total number of responders) * 100
This customer success metric measures the percentage of customers who complete a desired action, like making a purchase, subscribing to a service, etc.
To calculate the conversion rate, divide the number of conversions by the total number of visitors. And then, multiply by 100%.
(Conversions / Total Number of Visitors) * 100% = Conversion Rate
Customer Health Score is a metric you can use to measure the success of a SaaS-based business.
It involves scoring customers based on their likelihood to grow, renew flat, or churn.
Each business may have different customer health scoring systems. However, assessing these scores is critical for customer success teams.
Without proper scoring, your customer success team may not know which customers to help, leading to the over-servicing accounts likely to churn anyway.
When established, monitored, and responded to correctly, this customer success metric can help your managers and teams minimize churn rate.
To track the metric effectively, a customer health score must be formulated.
Check out examples of CHS metric
How much time do users spend on your product?
How many users in a specific account use the product?
How many of your product or service’s key features are used?
Customer Lifetime Value (CLV) represents the expected total revenue or net profit that a single customer can bring to your company throughout the relationship duration.
In simpler terms, CLV shows the following:
Assessing CLV is crucial for investing in the right customers.
To calculate CLV, multiply the average purchase value by the average customer purchase frequency. And then, multiply the result by your average customer lifespan.
The resulting figure provides an estimated revenue that one customer is expected to bring to your business.
Check out the formula below.
(Average Purchase Value * Average Customer Purchase Frequency) * Average Customer Lifespan
Customer retention cost is one of the tested and proven customer success metrics that shows the total cost of retaining an existing client.
A loyal customer base is a cornerstone for financial stability and the long-term health of your business.
By tracking this metric, you can make smart decisions on how much you should spend on your marketing and maintaining loyal customers.
To calculate the customer retention cost, audit all your expenses related to customer success efforts.
These efforts include the expenses spent on payroll for customer success and customer service teams, engagement and adoption programs, etc.
To calculate the metric, add all these expenses and divide that value by the total number of customers.
The resulting number is the business’s customer retention cost.
Retention Expenses / Total Number of Customers
This metric provides valuable data and insights into why customers are negative or positive about a service or product.
Qualitative customer feedback can answer critical questions like why a customer has provided a low NPS score.
This is a customer success metric you can use to determine whether customer support inquiries can be resolved on the first contact.
And it can directly impact customer loyalty.
It can help you determine whether it is the support team or the product that hinders the solution from being settled on the first contact.
To measure the first contact resolution rate, understand the inner workings of your customer support team and customize the criteria.
Questions to ask are:
These questions may vary depending on your business structure.
Customer Effort Score is a customer success metric you can use to measure how long and difficult it is for a customer to perform a specific action with a product.
Examples of actions include setting up a product, signing up for a platform, getting customer support, etc.
Although this metric seems reliable, we recommend using it with a net promoter score survey for more objective answers and results.
To measure the Customer Effort Score (CES), ask your customers to rate the effort it took to perform a specific action, such as signing up for your product.
Then, calculate the metric by dividing the total sum of positive responses by the total number of responses.
Check out the formula below:
Total sum of positive responses / Total number of responses
If you struggle with presenting survey data in an organized and visually appealing manner, you’ll want to read further.
Excel may be useful for organizing data. However, it falls short when it comes to visualizing survey data.
That’s where ChartExpo comes in.
ChartExpo is a powerful third-party add-in for spreadsheet tool that provides top-quality visualizations for survey data.
The chart generator add-in is a game-changer for survey analysis. And this is because it produces stunning visualizations. The best part?
You can try the ChartExpo add-in for Excel for free with a 7-day trial. This will let you explore all the available charts and graphs, including sample data for each one.
After the trial period, use ChartExpo for a low monthly fee of $10.
How to Install ChartExpo in Excel?
ChartExpo charts and graphs are available both in Google Sheets and Microsoft Excel. Please use the following CTA’s to install the tool of your choice and create data visualizations in a few clicks in your favorite tool.


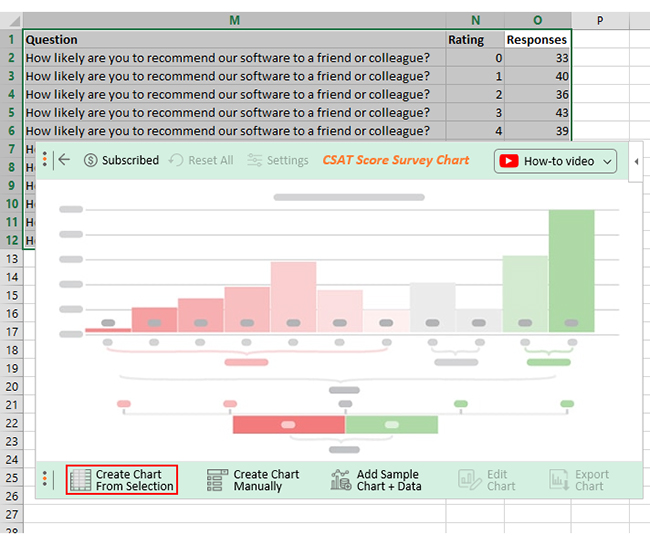
In the coming section, we’ll show you how to visualize survey data metrics, such as customer success metrics using survey-based charts in ChartExpo.
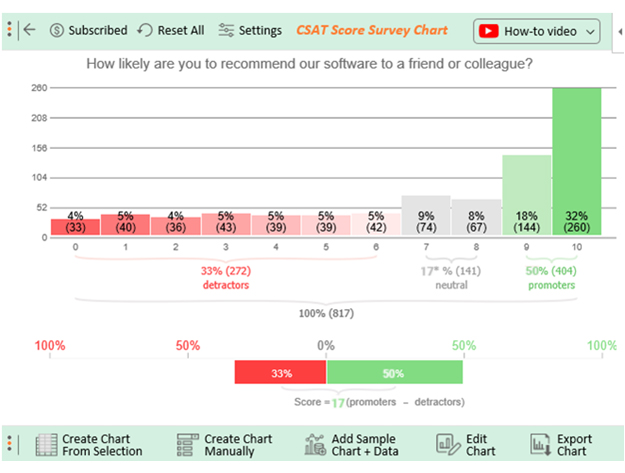
We’ll use the sample data below.
| Question | Rating | Responses |
| How likely are you to recommend our software to a friend or colleague? | 0 | 33 |
| How likely are you to recommend our software to a friend or colleague? | 1 | 40 |
| How likely are you to recommend our software to a friend or colleague? | 2 | 36 |
| How likely are you to recommend our software to a friend or colleague? | 3 | 43 |
| How likely are you to recommend our software to a friend or colleague? | 4 | 39 |
| How likely are you to recommend our software to a friend or colleague? | 5 | 39 |
| How likely are you to recommend our software to a friend or colleague? | 6 | 42 |
| How likely are you to recommend our software to a friend or colleague? | 7 | 74 |
| How likely are you to recommend our software to a friend or colleague? | 8 | 67 |
| How likely are you to recommend our software to a friend or colleague? | 9 | 144 |
| How likely are you to recommend our software to a friend or colleague? | 10 | 260 |


The most important customer success metric depends on your business and its goals. The common metrics include customer retention rate, net promoter score, customer lifetime value, and customer satisfaction score.
To measure the effectiveness of customer success metrics such as customer retention rate, churn rate, and customer satisfaction scores.
These metrics can help you evaluate how well your customer success efforts are working.
Customer success metrics are directly related to customer satisfaction and retention.
They include customer churn rate, customer lifetime value, customer satisfaction score (CSAT), net promoter score (NPS), and product adoption rate.
In conclusion, customer success metrics are crucial if your business aims to provide excellent customer service and satisfaction.
By tracking and analyzing the metrics, you can gain insights into the effectiveness of your customer success strategies and make informed decisions.
A third-party add-in like ChartExpo can greatly enhance the visualization and analysis of customer success metrics.
Why?
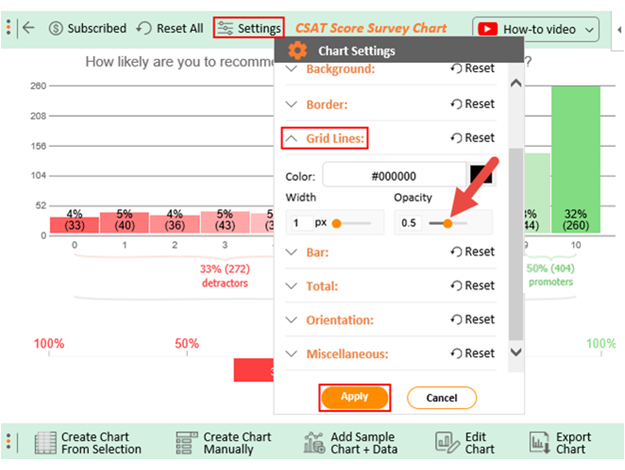
The Excel add-in offers a wide range of customizable charts specifically designed for survey data analysis, including the CSAT Score Survey Chart, NPS Score Survey Chart, etc.
These charts can help you to identify trends, patterns, and opportunities for customer success strategies’ improvement.
The benefits of using ChartExpo include easy integration with Excel and a user-friendly interface that requires no prior technical knowledge.
Besides, the Excel add-in offers a free 7-day trial that allows you to explore the different features before committing to a paid subscription.
Sign up for ChartExpo’s free trial today and take your customer success strategy to the next level.
How much did you enjoy this article?


Google Forms to Google Sheets keeps your data organized and current with every submission. Learn the steps, methods, and tips now!

Product survey questions reveal what customers truly think. Learn how to ask the right ones and act on the survey results. Read on!

Learn how the 5-Point Performance Rating Scale improves employee evaluations with clear, consistent, and fair performance reviews across teams.


