• Home
  • Tools dropdown img
    • Spreadsheet Charts

      • ChartExpo for Google Sheets
      • ChartExpo for Microsoft Excel
    • Power BI Charts

      • Power BI Custom Visuals by ChartExpo
    • Word Cloud

  • Charts dropdown img
    • Chart Category

      • Bar Charts
      • Circle Graphs
      • Column Charts
      • Combo Charts
      • Comparison Charts
      • Line Graphs
      • PPC Charts
      • Sentiment Analysis Charts
      • Survey Charts
    • Chart Type

      • Box and Whisker Plot
      • Clustered Bar Chart
      • Clustered Column Chart
      • Comparison Bar Chart
      • Control Chart
      • CSAT Survey Bar Chart
      • CSAT Survey Chart
      • Dot Plot Chart
      • Double Bar Graph
      • Funnel Chart
      • Gauge Chart
      • Likert Scale Chart
      • Matrix Chart
      • Multi Axis Line Chart
      • Overlapping Bar Chart
      • Pareto Chart
      • Radar Chart
      • Radial Bar Chart
      • Sankey Diagram
      • Scatter Plot Chart
      • Slope Chart
      • Sunburst Chart
      • Tornado Chart
      • Waterfall Chart
      • Word Cloud
    • Google Sheets
      Microsoft Excel
  • Services
  • Pricing
  • Contact us
  • Blog
  • Support dropdown img
      • Gallery
      • Videos
      • Contact us
      • FAQs
      • Resources
    • Please feel free to contact us

      atsupport@chartexpo.com

Categories
All Data Visualizations Data Analytics Surveys
Add-ons/
  • Google Sheets
  • Microsoft Excel
  • Power BI
All Data Visualizations Data Analytics Surveys
Add-ons
  • Google Sheets
  • Microsoft Excel
  • Power BI

We use cookies

This website uses cookies to provide better user experience and user's session management.
By continuing visiting this website you consent the use of these cookies.

Ok

ChartExpo Survey


Home > Blog > Data Analytics

Mastering Retail Industry KPIs: A Comprehensive Guide

Are you in the retail industry and wondering about the significance of retail industry KPIs?

You’ve come to the right place.

The retail industry thrives on data-driven insights, and retail industry KPIs are the compass guiding businesses toward success. They guide everything from inventory management to customer satisfaction initiatives.

Retail Industry KPIs

Therefore, understanding and utilizing retail industry KPIs is crucial for sustainable growth and profitability.

Statistics show that the majority of retail businesses consider KPIs instrumental in their decision-making processes. Moreover, companies that actively monitor their KPIs are more likely to experience profitable growth. This underscores the undeniable influence of retail industry KPIs on businesses’ bottom lines and overall sustainability.

However, the question arises: who should be using retail industry KPIs? The answer extends beyond traditional retail managers and analysts. In today’s data-driven environment, everyone from store associates to senior executives can benefit from using these KPIs.

This blog post aims to shed light on the universal importance of embracing data-driven decision-making. Keep reading to uncover the transformative power of retail industry KPIs in shaping the future of retail.

Table of Content:

  1. What are KPIs in Retail Industry?
  2. Why are Retail Metrics Important?
  3. Who Should Be Using Retail Industry KPIs?
  4. Top 10 KPIs in Retail
    1. Sales per Square Foot
    2. Gross Margin Return on Investment
    3. Customer Conversion Rate
    4. Average Transaction Value
    5. Inventory Turnover Ratio
    6. Sell-Through Rate
    7. Customer Retention Rate
    8. Shrinkage
    9. Stockout Rate
    10. Net Promoter Score
  5. 5 Retail KPI Examples
  6. How to Choose Right Retail Industry Metrics?
  7. How to Analyze Retail Industry KPIs?
  8. How to Use Retail KPIs?
  9. Best Practices for Retail Store KPIs
  10.  Retail Industry KPIs – FAQs
  11. Wrap Up

What are KPIs in Retail Industry?

Definition: Key Performance Indicators (KPIs) in the retail industry are quantifiable metrics utilized to gauge the effectiveness of diverse business processes. These indicators offer valuable insights into the performance and success of a retail operation.

Consistently tracking these retail industry KPIs enables data-driven decision-making, strategy optimization, and overall performance enhancement. Ultimately, this approach ensures a competitive edge in the dynamic retail landscape.

Why are Retail Metrics Important?

Retail industry Key Performance Indicators (KPIs) serve as a compass for evaluating and enhancing business performance. To be effective, these retail industry KPIs must incorporate essential elements that contribute to their meaningful application and interpretation.

  • Relevance: KPIs in retail must align with the retail business’s goals and objectives. Whether tracking sales, customer satisfaction, or inventory turnover, relevance ensures KPIs are tightly connected to what truly matters.
  • Measurability: The effectiveness of KPIs lies in their measurability. Clear, quantifiable metrics and KPIs enable you to track progress, identify trends, and make data-driven decisions. They provide a tangible yardstick for performance assessment.
  • Specificity: Specific KPIs offer clarity, leaving no room for ambiguity. Rather than vague indicators, precise metrics like “daily sales per square foot” or “conversion rate per promotion” provide actionable insights, driving focused improvements.
  • Timeliness: In the fast-paced retail environment, timely data is paramount. As a result, KPIs should offer real-time or near-real-time insights. This allows you to respond swiftly to market changes, consumer trends, and operational shifts.
  • Actionability: Effective KPIs prompt action. They should not just measure performance but also guide decisions and strategies. Actionable KPIs empower retail teams to make informed adjustments to enhance performance.
  • Benchmarking: Benchmarking against industry standards or competitors provides context to KPIs. This comparative analysis allows you to gauge performance, identify areas for improvement, and stay competitive in the market.
  • Balance: A well-rounded set of KPIs ensures a balanced view of retail performance. The metrics should cover various aspects like financial health, customer satisfaction, and operational efficiency. This provides a holistic perspective on your business.
  • Accessibility: Ease of access to KPI data is vital. Dashboards and reporting tools should make retail KPIs readily available to relevant stakeholders. Accessibility fosters transparency and ensures decision-makers have the information they need when needed.
  • Flexibility: The retail landscape evolves, and KPIs should adapt. Flexibility allows you to refine and add metrics, including advanced tools like Pyramid charts, as the industry changes. This ensures that KPIs remain relevant and valuable over time.

Who Should Be Using Retail Industry KPIs?

The use of retail KPIs extends across departments, ensuring a unified approach to achieving business objectives. They serve as the common language that aligns diverse teams toward the shared goal of retail success. Here are the groups of people who should harness retail KPIs for informed decision-making and operational excellence.

  1. Retail managers and executives: At the helm of retail operations, managers and executives utilize KPIs to monitor overall business performance. Metrics like sales growth, profit margins, and customer satisfaction provide insights essential for strategic decision-making.
  2. Store managers: Store managers focus on the day-to-day intricacies of retail. KPIs such as foot traffic, conversion rates, and average transaction value guide store-level decisions. This helps optimize the customer experience and maximize sales.
  3. Merchandising and inventory managers: For those managing inventory and merchandising, KPIs like inventory turnover, sell-through rates, and stockouts are invaluable. These metrics enable effective stock management, ensuring products align with customer demand.
  4. Marketing and sales teams: Marketing and sales teams thrive on KPIs like conversion rates, customer acquisition costs, and return on marketing investment. These metrics gauge the effectiveness of campaigns, helping them refine strategies for maximum impact.
  5. Finance and accounting departments: Financial health is the heartbeat of any retail business. Finance and accounting departments rely on KPIs like gross and net profit margins, ROI, and liquidity ratios. These metrics help to ensure fiscal responsibility and sustainability.
  6. Supply chain managers: Efficient supply chain management is critical in retail. KPIs like order fulfillment time and supplier performance aid supply chain managers in optimizing processes for seamless operations.
  7. Customer service teams: Customer satisfaction is paramount in retail. KPIs like the Net Promoter Score (NPS) help customer service teams monitor and enhance the customer experience.
  8. Investors and stakeholders: Investors and stakeholders seek a comprehensive understanding of a retail business’s performance. KPIs provide a transparent and measurable view, allowing them to assess the company’s health and potential for growth.

Top 10 KPIs in Retail

Tracking the right Key Performance Indicators (KPIs) in retail helps businesses optimize sales, manage inventory, and improve customer experience. Here are the top 10 retail KPIs every retailer should monitor:

1. Sales per Square Foot

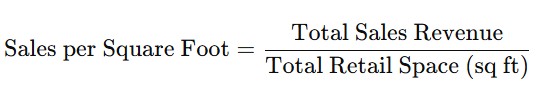
This metric measures how efficiently a store uses its space by calculating revenue per square foot. A higher value indicates better space utilization and product placement strategies.

Formula:

Sales per Square Foot Formula

2. Gross Margin Return on Investment (GMROI)

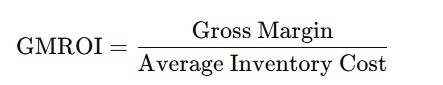
GMROI evaluates inventory profitability by analyzing the relationship between gross margin and inventory costs. It helps retailers determine how efficiently their stock contributes to overall profits.

Formula:

GMROI

3. Customer Conversion Rate

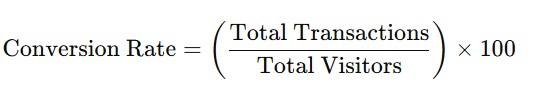
This KPI shows the percentage of store visitors who make a purchase. A low conversion rate may indicate issues with product selection, pricing, or customer experience.

Formula:

Customer Conversion Rate

4. Average Transaction Value (ATV)

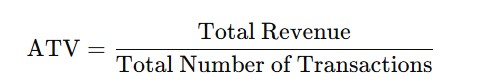
ATV measures the average amount spent per transaction. Retailers can increase ATV through upselling, bundling products, and optimizing pricing strategies.

Formula:

ATV

5. Inventory Turnover Ratio

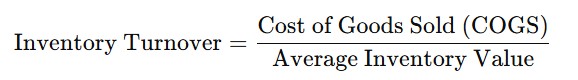
This metric tracks the frequency at which inventory is sold and restocked. A high turnover reflects strong demand, while a low turnover may signal excess stock or sluggish sales.

Formula:

Inventory Turnover Ratio

6. Sell-Through Rate

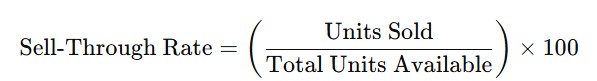
Sell-through rate measures the percentage of inventory sold compared to the total stock available. It helps retailers understand which products perform well and which need adjustments.

Formula:

Sell-Through Rate

7. Customer Retention Rate

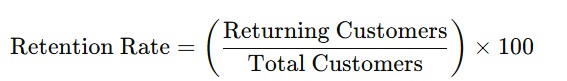
This KPI tracks the percentage of returning customers. High retention rates suggest strong customer loyalty and effective engagement strategies.

Formula:

Customer Retention Rate

8. Shrinkage

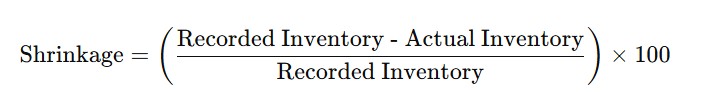
Shrinkage accounts for inventory loss due to theft, damage, or administrative errors. Monitoring shrinkage helps improve security measures and operational accuracy.

Formula:

Shrinkage

9. Stockout Rate

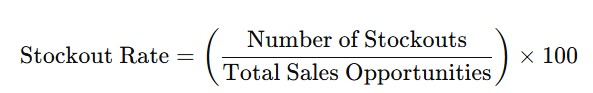
The stockout rate tracks how frequently products run out of stock. A high rate can result in missed sales opportunities and unhappy customers.

Formula:

Stockout Rate

10. Net Promoter Score (NPS)

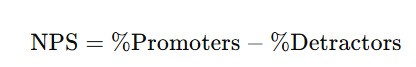
NPS gauges customer satisfaction by evaluating the likelihood of shoppers recommending a store. A high score indicates strong brand loyalty and a positive customer experience.

Formula:

NPS

5 Retail KPI Examples

  1. Foot Traffic – Measures the number of customers visiting the store.
  2. Gross Profit Margin – Indicates the profitability of products after deducting costs.
  3. Return Rate – Tracks the percentage of products returned by customers.
  4. Basket Size – Measures the average number of items per transaction.
  5. Employee Productivity – Evaluates sales contribution per employee.

How to Choose Right Retail Industry Metrics?

1. Align Metrics with Business Goals

Your KPIs should directly reflect your business objectives. If the focus is on boosting sales, prioritize metrics like sales per square foot and conversion rates. If customer retention is the goal, track customer lifetime value (CLV) and repeat purchase rate.

2. Consider Your Retail Model

Different retail businesses require different metrics.

  • Brick-and-Mortar Stores: Foot traffic, inventory turnover, and average transaction value.
  • E-commerce Stores: Website conversion rate, cart abandonment rate, and customer acquisition cost (CAC).
  • Omnichannel Retailers: Multi-channel conversion rates, fulfillment efficiency, and stockout rates.

3. Focus on Actionable Insights

Avoid vanity metrics that don’t drive decision-making. Instead, choose KPIs that provide insights you can act on, such as inventory shrinkage, which helps reduce losses, or sell-through rate, which guides stock replenishment.

4. Measure Customer Experience

Customer satisfaction directly impacts revenue and loyalty. Track metrics like Net Promoter Score (NPS) to assess how likely customers are to recommend your store, and customer satisfaction score (CSAT) to gauge their overall shopping experience.

5. Monitor Financial Health

To ensure profitability, track metrics such as gross profit margin, operating expenses, and cost of goods sold (COGS). These help maintain a healthy balance between revenue and expenses.

How to Analyze Retail Industry KPIs?

Evaluating retail industry KPIs is akin to deciphering a complex code that holds the key to success. From defining the most relevant metrics to identifying avenues for improvement, the process demands unwavering attention. And the real challenge lies in transforming this sea of data into actionable insights.

Here’s where data visualization emerges as the guiding light. It allows you to distill intricate KPIs into clear, compelling visuals that unveil insights at a glance. Yet, Excel’s limitations in creating dynamic visualizations often obscure the true potential of the data, hindering comprehensive analysis.

But don’t worry: we have ChartExpo.

ChartExpo transcends Excel’s visualization constraints, empowering you to unleash the full power of your data. Its appealing, insightful visualizations pave the way for informed strategic decisions and sustainable growth.

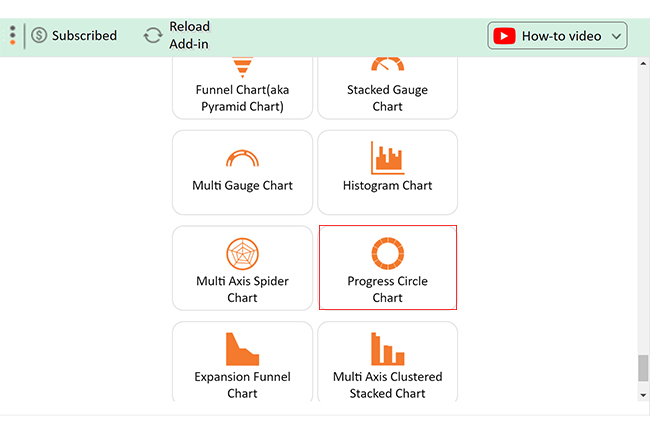
Let’s learn how to Install ChartExpo in Excel.

  1. Open your Excel application.
  2. Open the worksheet and click the “Insert” menu.
  3. You’ll see the “My Apps” option.
  4. In the Office Add-ins window, click “Store” and search for ChartExpo on my Apps Store.
  5. Click the “Add” button to install ChartExpo in your Excel.

ChartExpo charts are available both in Google Sheets and Microsoft Excel. Please use the following CTA’s to install the tool of your choice and create beautiful visualizations in a few clicks in your favorite tool.

Example:

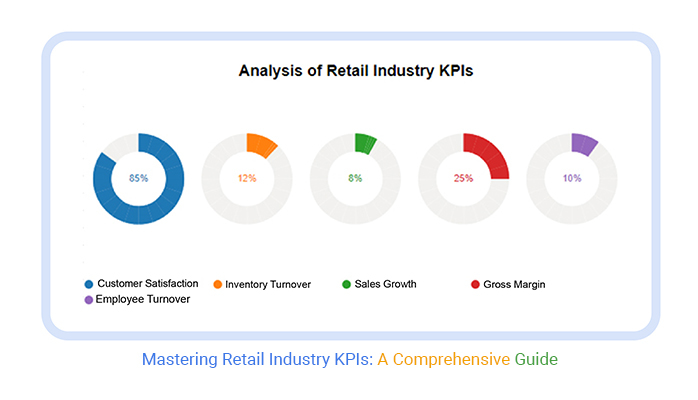
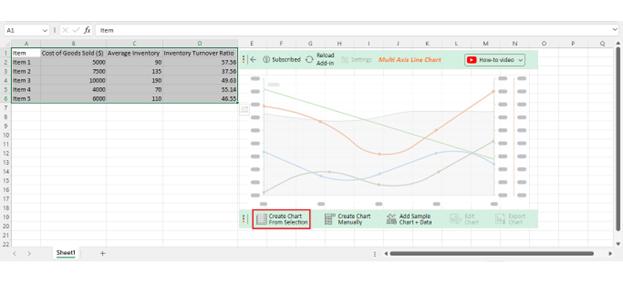
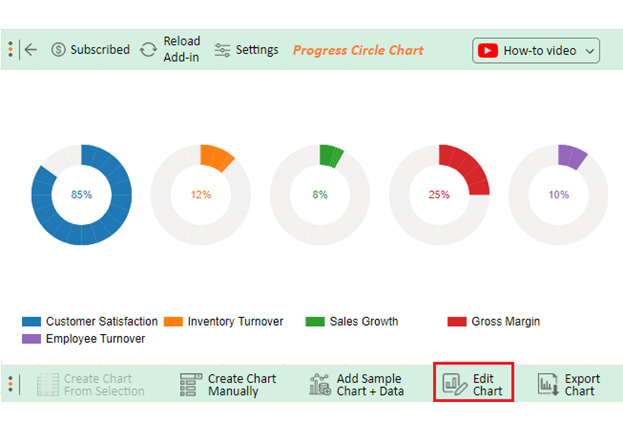
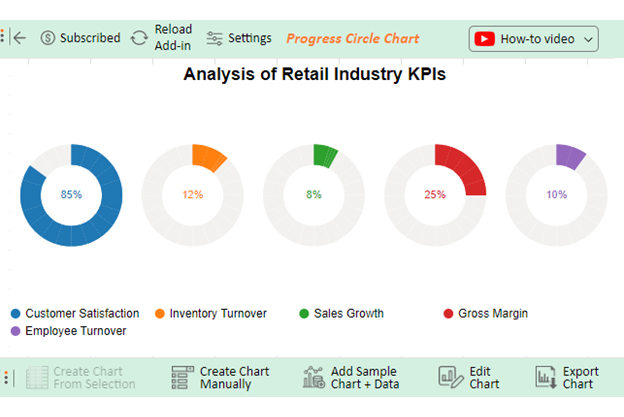
The table below contains KPI examples in retail data.

Retail Industry KPIs Percentage (%)
Customer Satisfaction 85
Inventory Turnover 12
Sales Growth 8
Gross Margin 25
Employee Turnover 10

Let’s visualize this data in Excel using ChartExpo to help us with the evaluation process.

  • To get started with ChartExpo, install ChartExpo in Excel.
  • Now Click on My Apps from the INSERT menu.
insert chartexpo in excel
  • Choose ChartExpo from My Apps, then click Insert.
open chartexpo in excel
  • Once it loads, scroll through the charts list to locate and choose the “Progress Circle Chart”.
search progress circle chart in excel
  • Click the “Create Chart From Selection” button after selecting the data from the sheet, as shown.
Create Chart From Selection ce529
  • ChartExpo will generate the visualization below for you.
Retail Industry KPIs Design Template
  • If you want to add anything to the chart, click the Edit Chart button:
  • Click the pencil icon next to the Chart Header to change the title.
  • It will open the properties dialog. Under the Text section, you can add a heading in Line 1 and enable Show.
  • Give the appropriate title of your chart and click the Apply button.
Apply Tittle on Chart ce529
  • Change the Customer Satisfaction legend shape into a Circle.
Change Customer Satisfaction legend shape ce529
  • Click the “Save Changes” button to persist the changes made to the chart.
Save Changes ce529
  • Your final Progress Circle Chart will look like the one below.
Final Retail Industry KPIs

Insights

  • Customer approval and loyalty are at 85%, showcasing high customer satisfaction.
  • Efficient stock management is evident, with a 12% inventory turnover rate.
  • Steady expansion is reflected in a modest 8% sales growth.
  • A 25% gross margin highlights effective cost control.
  • A 10% employee turnover rate indicates potential workforce satisfaction or organizational culture issues.

How to Use Retail KPIs?

1. Set Clear Objectives

Before tracking KPIs, define your business goals. Are you focusing on increasing sales, improving customer retention, or optimizing inventory management? Choose KPIs that align with these objectives.

2. Collect and Analyze Data

Regularly track your KPIs using point-of-sale (POS) systems, e-commerce analytics, or inventory management software. Analyze historical data to identify patterns and areas for improvement.

3. Compare Against Industry Benchmarks

Benchmarking your KPIs against industry standards helps assess performance and competitiveness. For example, if your inventory turnover ratio is lower than the industry average, it may indicate overstocking or slow-moving products.

4. Take Action on Insights

Use KPI data to make informed business decisions.

  • Low conversion rate? Improve store layout or optimize the online shopping experience.
  • High stockout rate? Adjust inventory replenishment strategies to avoid lost sales.
  • Low NPS score? Enhance customer service and engagement.

5. Monitor and Adjust Regularly

Retail environments change quickly, so continuously tracking and adjusting KPIs is crucial. Conduct weekly or monthly reviews to ensure strategies are working and update goals as needed.

Best Practices for Retail Store KPIs

1. Choose Relevant KPIs

Select KPIs that align with your store’s goals. For example:

  • Boosting sales? Track Sales per Square Foot and Conversion Rate.
  • Improving customer loyalty? Monitor Net Promoter Score (NPS) and Repeat Purchase Rate.
  • Managing inventory? Use Stock Turnover Ratio and Sell-Through Rate.

2. Set Measurable and Achievable Targets

Define clear benchmarks for each KPI. For instance, aim for an inventory turnover ratio of 5-10 to ensure optimal stock movement.

3. Use Real-Time Data Tracking

Leverage POS systems, inventory management software, and customer analytics tools to track KPIs in real time. This enables quick decision-making and trend analysis.

4. Compare with Industry Standards

Regularly benchmark your KPIs against industry averages to identify areas for improvement and stay competitive.

5. Focus on Actionable Insights

Avoid vanity metrics and use KPI data to drive improvements. If your customer conversion rate is low, consider adjusting pricing, store layout, or marketing strategies.

6. Monitor and Adjust Regularly

Retail trends change frequently. Conduct weekly or monthly KPI reviews to adapt strategies and optimize store performance.

Retail Industry KPIs – FAQs

What are the 6 KPIs for retail?

Key Performance Indicators (KPIs) for retail include:

  • Sales conversion rate.
  • Average transaction value (ATV).
  • Inventory turnover.
  • Gross margin.
  • Inventory turnover.
  • Customer satisfaction score.

These metrics drive strategic decisions, optimizing sales, inventory, and customer relationships.

What is the most important KPI in retail?

The most crucial KPI in retail is the sales conversion rate. It reflects the effectiveness of turning potential customers into buyers. This provides a real-time measure of how well a store is performing in driving sales and maximizing revenue.

Who should be using retail KPIs?

Retail KPIs are essential for various roles:

  • Retail managers and executives for strategic decisions.
  • Store managers for day-to-day operations.
  • Marketing and sales teams for campaign effectiveness.
  • Finance and accounting for financial health.
  • Investors and stakeholders for business assessment and growth potential.

Wrap Up

The use of retail industry KPIs extends across various roles and responsibilities, making them essential for various stakeholders.

Store managers leverage these indicators to fine-tune day-to-day operations, ensuring optimal efficiency and elevating customer satisfaction levels. Sales teams rely on KPIs as compass points, aiding them in tracking targets and driving revenue growth.

Supply chain managers find value in KPIs for inventory control, facilitating streamlined order fulfillment and logistical efficiency. The financial teams within retail organizations turn to KPIs for budgeting precision, accurate forecasting, and continuous profitability monitoring.

For investors and stakeholders, KPIs are barometers. They use them to gauge the overall health and potential growth trajectory of a retail business. Furthermore, industry analysts rely on KPIs for assessing market trends and benchmarking against competitors. Then, deliver valuable insights to the wider business community.

In essence, retail industry KPIs transcend organizational boundaries. They offer a universal language that unifies diverse roles and departments within the retail ecosystem. It doesn’t matter whether you are on the sales floor, in the boardroom, or analyzing market trends remotely. Retail industry KPIs will help you measure, understand, and optimize performance in the retail sector’s dynamic landscape.

Net Promoter, NPS, NPS Prism, and many other terms related to NPS are registered trademarks of Bain & Company Inc., Satmetrix Systems Inc., and Fred Reichheld.

How much did you enjoy this article?

PBIAd1
Start Free Trial!
133903

Related articles

next previous
Data Analytics31 min read

Data Analysis Without Nonsense: Fix the Right Problem, Fast

Data analysis can mislead when metrics look right but outcomes fail. Learn how to spot red flags, fix failures, and make better decisions. Read on!

Data Analytics29 min read

Variance Analysis Isn’t a Math Problem, It’s a Trust Problem

Variance analysis helps identify what went wrong, who owns it, and what to do next. Use it to drive decisions, not just reports. Learn more!

Data Analytics10 min read

Supplier Comparison Template: Download It Now

A supplier comparison template streamlines vendor evaluation by comparing cost and quality. Click here to learn its benefits and how to analyze them.

Data Analytics32 min read

Ecommerce Analytics: How to Fix What It Often Gets Wrong

Ecommerce analytics often lead to mixed signals and costly misreads. Fix attribution gaps, align teams, and act on the right data. Get started now!

Data Analytics30 min read

When Sales Funnel Breaks: Failures, Fixes, & Funnel Debt

Is your sales funnel hiding costly gaps? Learn how pipeline stalls, false metrics, and handoff chaos could be draining revenue. Get started now!

ChartExpo logo

Turn Data into Visual
Stories

CHARTEXPO

  • Home
  • Gallery
  • Videos
  • Services
  • Pricing
  • Contact us
  • FAQs
  • Privacy policy
  • Terms of Service
  • Sitemap

TOOLS

  • ChartExpo for Google Sheets
  • ChartExpo for Microsoft Excel
  • Power BI Custom Visuals by ChartExpo
  • Word Cloud

CATEGORIES

  • Bar Charts
  • Circle Graphs
  • Column Charts
  • Combo Charts
  • Comparison Charts
  • Line Graphs
  • PPC Charts
  • Sentiment Analysis Charts
  • Survey Charts

TOP CHARTS

  • Sankey Diagram
  • Likert Scale Chart
  • Comparison Bar Chart
  • Pareto Chart
  • Funnel Chart
  • Gauge Chart
  • Radar Chart
  • Radial Bar Chart
  • Sunburst Chart
  • see more
  • Scatter Plot Chart
  • CSAT Survey Bar Chart
  • CSAT Survey Chart
  • Dot Plot Chart
  • Double Bar Graph
  • Matrix Chart
  • Multi Axis Line Chart
  • Overlapping Bar Chart
  • Control Chart
  • Slope Chart
  • Clustered Bar Chart
  • Clustered Column Chart
  • Box and Whisker Plot
  • Tornado Chart
  • Waterfall Chart
  • Word Cloud
  • see less

RESOURCES

  • Blog
  • Resources
  • YouTube
SIGN UP FOR UPDATES

We wouldn't dream of spamming you or selling your info.

© 2025 ChartExpo, all rights reserved.