Categories
Gemini in Google Sheets—have you tried it yet? Chances are, if you work with data, automation, or reports, you’ve heard the buzz. Google’s AI integration is no longer hype. It’s here, and it’s working with the spreadsheets many professionals use.
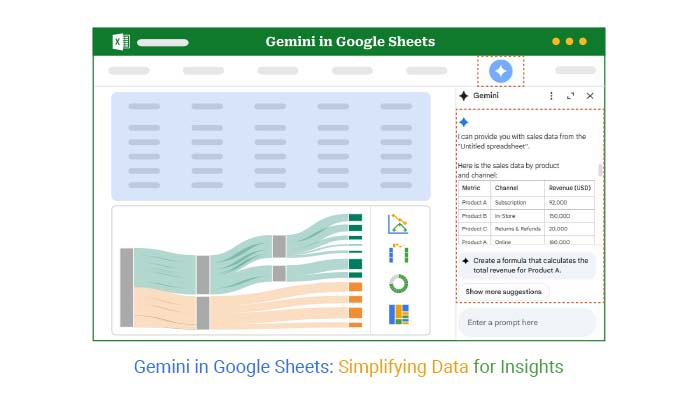


Gemini in Google Sheets blends artificial intelligence with data processing. The result? Faster insights, cleaner analysis, and more efficient work.
Think about this: over 2 billion people use Google Workspace products every month. That includes Google Sheets, a platform that has become essential for finance teams, marketers, analysts, and entrepreneurs. With Gemini in Google Sheets, you can automate tasks, generate formulas, and analyze trends using natural language.
This blog will walk you through how to make the most of Gemini. But that’s not all. You’ll also see how tools like Google Sheets, artificial intelligence, and Google Charts complement it. Whether you’re building models or automating workflows, the future of spreadsheets is here—and it’s smarter. Expect real examples, quick tips, and a conversational guide.
Here is where it gets interesting: You won’t need to be a coder or data scientist to follow along. By the end, you’ll know how to bring automation and AI into your sheets in a practical way.
Ready to start?
Let’s explore Gemini and see what your spreadsheet can do next.
First…
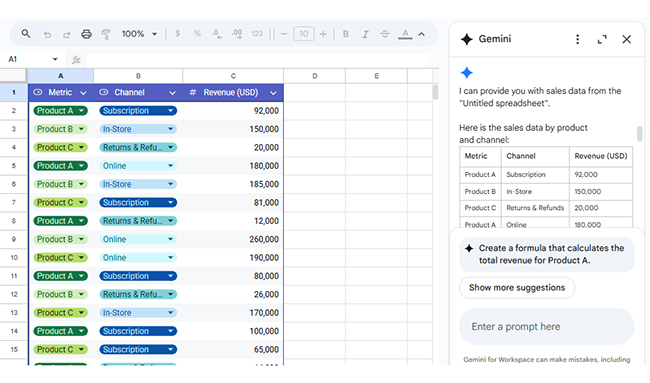
Definition: Gemini in Google Sheets is Google’s AI tool built directly into spreadsheets. It helps you ask questions, clean data, and generate formulas using simple text prompts. Think of it as your intelligent assistant inside Sheets.
Paired with tools like data visualization and Google Charts, Gemini makes working with numbers faster and more intuitive. You don’t need advanced skills. Type your request, and Gemini will handle the rest. It turns raw data into smart actions—instantly.
Are you tired of juggling formulas and filters? You’re not alone. Many users want more from their spreadsheets, without spending hours figuring things out. That’s where Gemini in Google Sheets changes the game. It gives your data a smarter voice.
How?
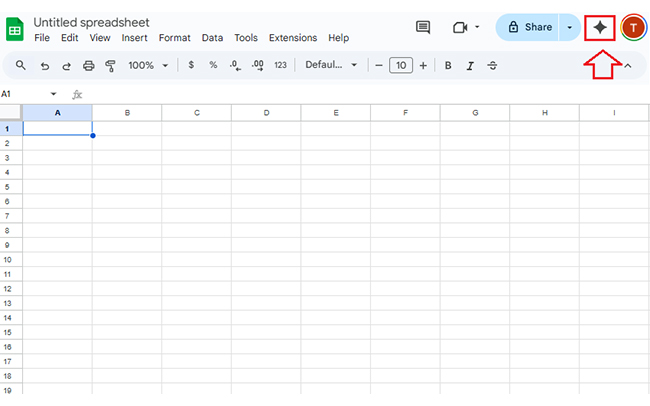
Getting started with Gemini in Google Sheets feels almost magical, thanks to its intuitive interface and minimal learning curve. You don’t need to be a spreadsheet genius. You need curiosity and a prompt.
Here’s how to bring your data to life in three simple steps:
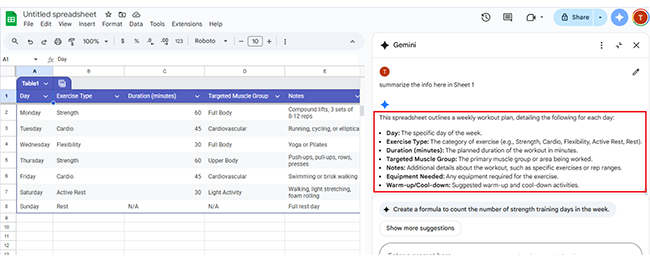
Think spreadsheets are dull and repetitive? Think again. With Gemini in Google Sheets, you’re working with an intelligent assistant that gets what you’re trying to do. It turns messy data into something useful—and fast. Whether you’re planning, calculating, or cleaning things up, Gemini takes the stress out of spreadsheets. Here’s how:
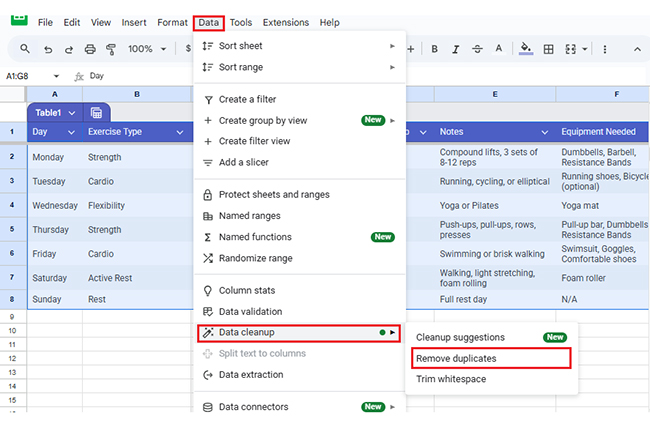
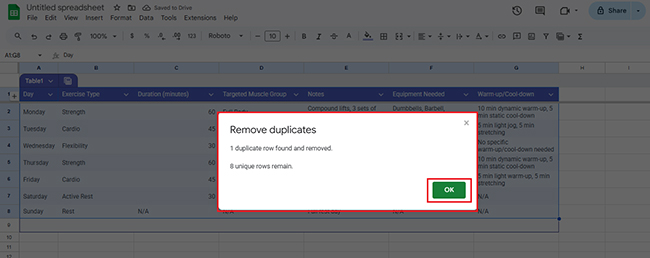
Select a range; Gemini finds duplicates fast—no manual search, no hassle.
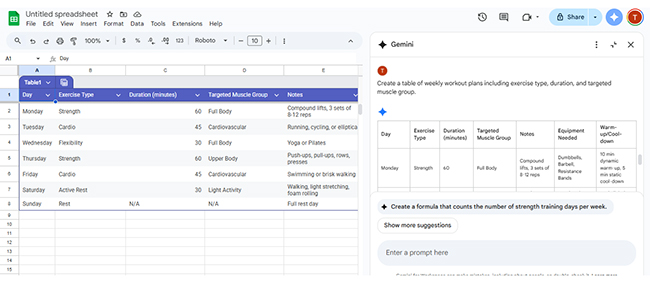
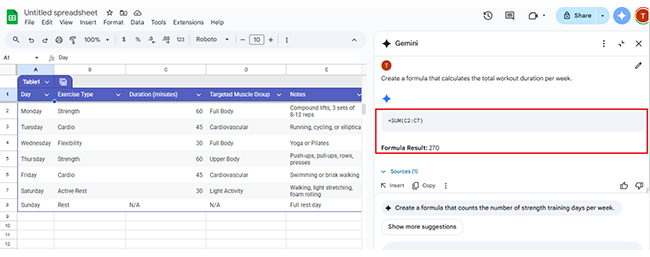
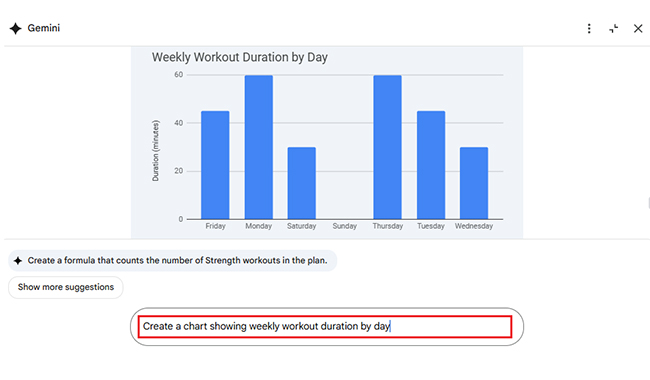
Charts don’t have to be hard. With Gemini in Google Sheets, they’re instant. Type a short prompt like “Show workout duration by day”, and Gemini will build the chart. It reads your data, finds what matters, and delivers clean visuals fast.
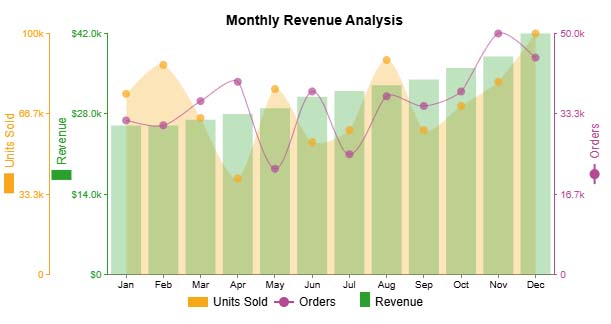
Numbers matter—but visuals tell the story faster. If you want real insights, you need charts that go beyond bars and pie slices. That’s where ChartExpo comes in. It has visuals that work beautifully with Gemini in Google Sheets. Here are the top charts you can use to bring your data to life in ways spreadsheets alone can’t:
Have you ever tried making sense of a spreadsheet that looks like a bowl of alphabet soup? We’ve all been there. Google Sheets is great for organizing data, but when it comes to visuals, it often falls short.
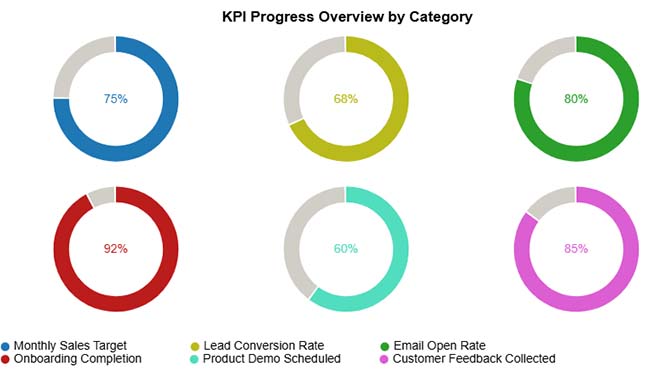
Data analysis without data visualization is like cooking without tasting. You might get it right, but chances are you won’t. That’s where Gemini in Google Sheets steps in by adding intelligence to your data, allowing you to include a progress bar in Google Sheets for clear, actionable insights.
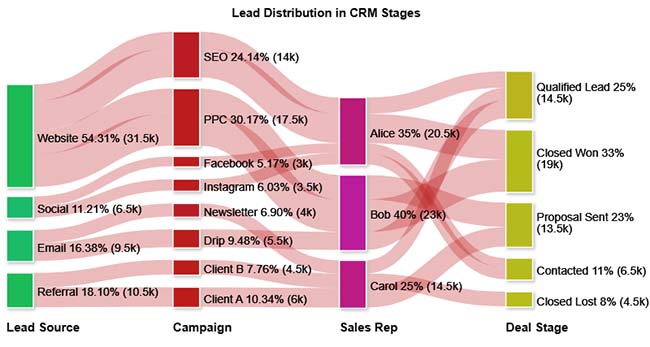
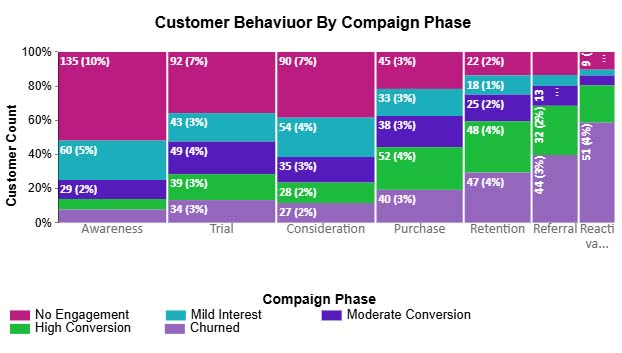
But when you need powerful visuals like a Scatter plot to uncover trends, patterns, and outliers, ChartExpo makes all the difference. It turns dull rows into clear, meaningful visuals that actually tell a story.
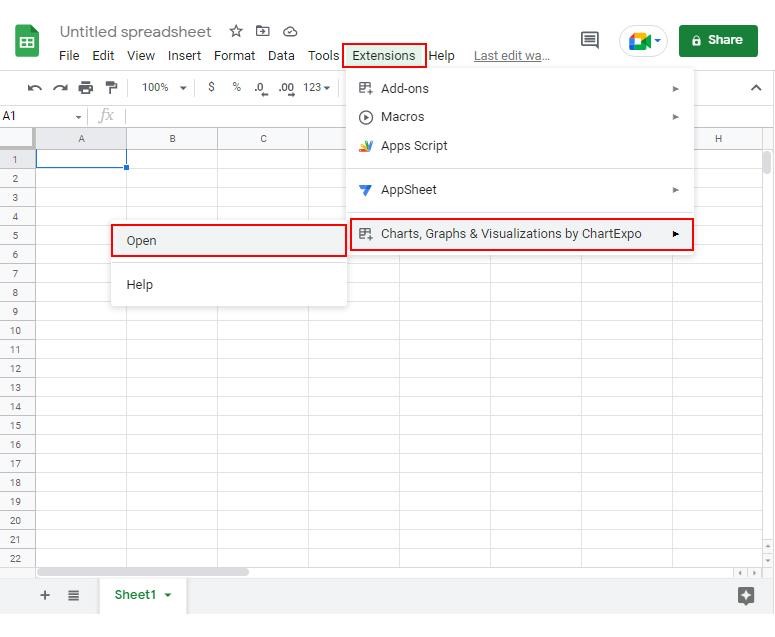
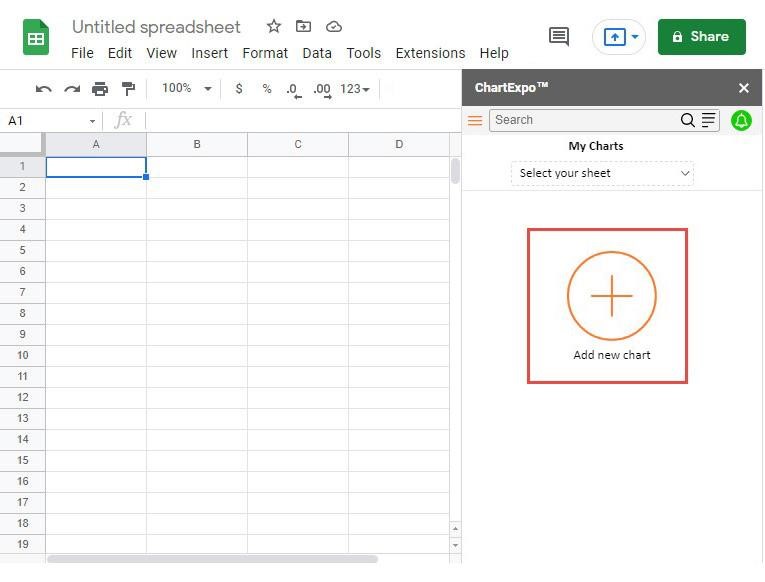
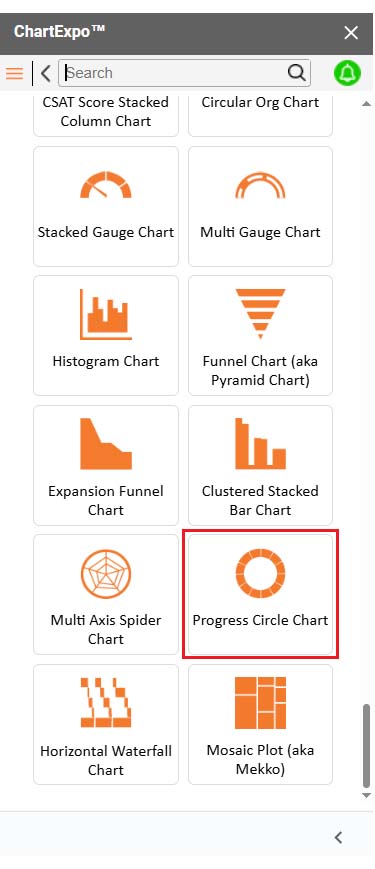
How to Install ChartExpo in Google Sheets?
ChartExpo charts are available both in Google Sheets and Microsoft Excel. Please use the following CTAs to install the tool of your choice and create beautiful visualizations in a few clicks in your favorite tool.
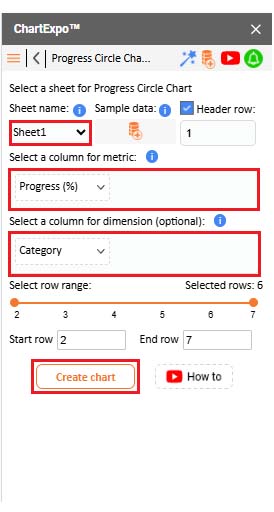
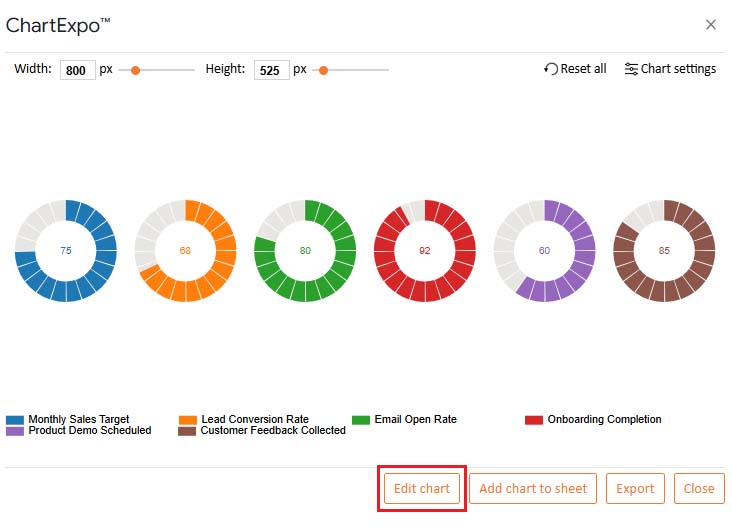
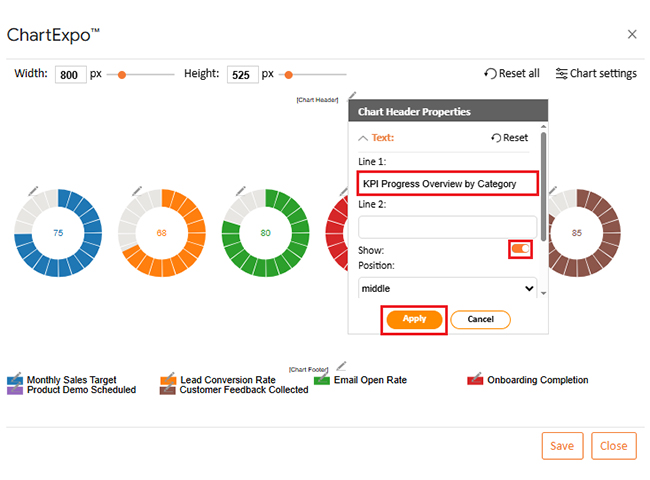
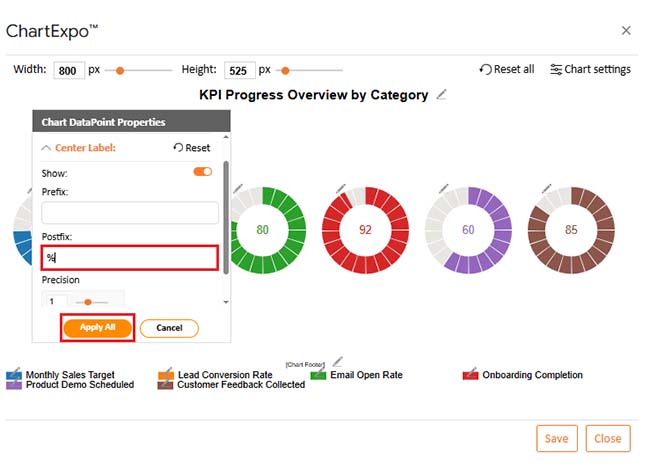
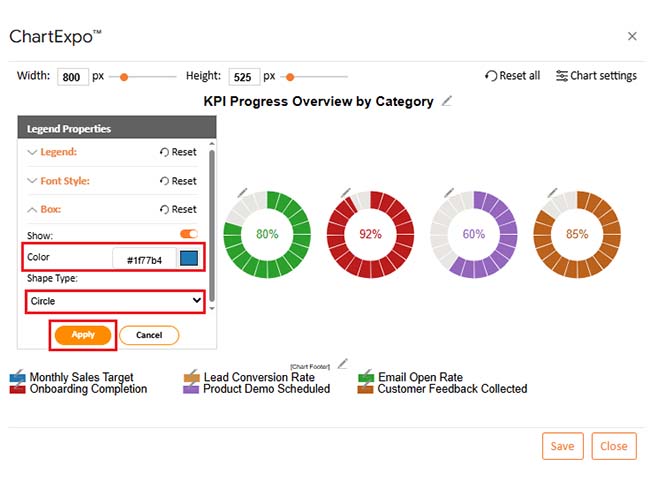
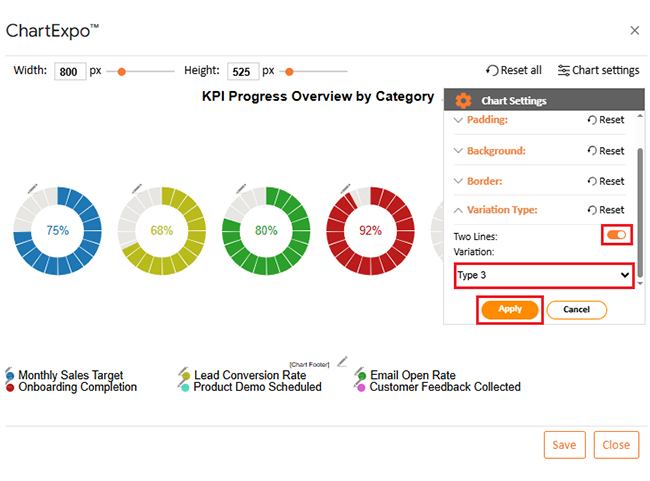
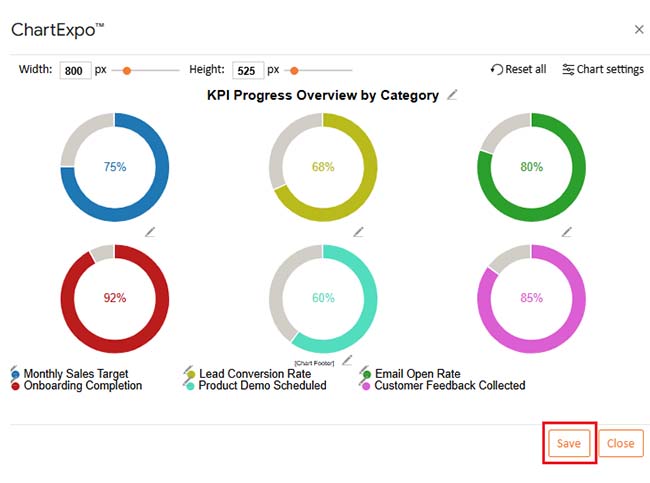
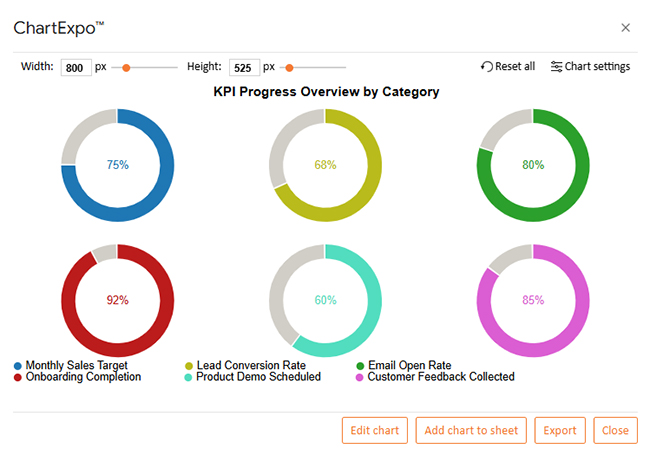
Let’s learn how to analyze spreadsheets in Google Sheets using ChartExpo.
| Category | Progress (%) |
| Monthly Sales Target | 75 |
| Lead Conversion Rate | 68 |
| Email Open Rate | 80 |
| Onboarding Completion | 92 |
| Product Demo Scheduled | 60 |
| Customer Feedback Collected | 85 |
Spreadsheets don’t have to feel old-school. With Gemini in Google Sheets, they become smarter, faster, and way more helpful. You don’t need to be a tech expert. You need a prompt.
Here’s what makes Gemini a game-changer:
Gemini is clever, but it gets even better when you know how to work with it. Think of it as your spreadsheet co-pilot. You give the direction, and it does the driving. To get the smoothest ride, follow these best practices:
Yes, you can use Gemini in Google Sheets. It’s built right into Google Workspace. You don’t need to download anything. Just click the Gemini icon or use the “Help me organize” option.
Gemini in Google Sheets brings smart assistance into your everyday workflow. It understands your goals and acts fast—no more endless scrolling or guessing formulas. You ask, it delivers.
Whether you’re managing Google Sheets CRM templates or tracking sales data, Gemini makes it easier. You can sort leads, build reports, and find trends—all by typing simple prompts. It’s ideal for anyone working with clients or teams.
Need to handle financials? Gemini can help organize your Google Sheets amortization schedule. Ask it to calculate loan payments or summarize totals. It’s faster and more accurate than doing it manually.
Want to learn how to use Google Spreadsheets effectively? Start with Gemini. It takes care of the setup and analysis. You’ll be learning by doing, with an innovative tool guiding you.
You don’t need advanced skills. You need clear requests. Gemini will clean, calculate, and visualize data with less effort. Moreover, Gemini turns Google Sheets into a thinking partner. It saves time, reduces errors, and helps you work smarter. Give it a try—and let your spreadsheets work for you.
To level up your visuals, install ChartExpo for stunning, insightful charts in seconds.
How much did you enjoy this article?


SUMPRODUCT in Google Sheets handles multi-condition calculations without extra columns. Master its syntax, uses, and errors. Read on!

An annual budget template in Google Sheets organizes your yearly finances, tracks every dollar, and reveals spending patterns. Read on!

Learn the best graph to show profit and loss with practical examples and use cases. Discover how to visualize your business data, track trends, and make smarter financial decisions.


