• Home
  • Tools dropdown img
    • Spreadsheet Charts

      • ChartExpo for Google Sheets
      • ChartExpo for Microsoft Excel
    • Power BI Charts

      • Power BI Custom Visuals by ChartExpo
    • Word Cloud

  • Charts dropdown img
    • Chart Category

      • Bar Charts
      • Circle Graphs
      • Column Charts
      • Combo Charts
      • Comparison Charts
      • Line Graphs
      • PPC Charts
      • Sentiment Analysis Charts
      • Survey Charts
    • Chart Type

      • Box and Whisker Plot
      • Clustered Bar Chart
      • Clustered Column Chart
      • Comparison Bar Chart
      • Control Chart
      • CSAT Survey Bar Chart
      • CSAT Survey Chart
      • Dot Plot Chart
      • Double Bar Graph
      • Funnel Chart
      • Gauge Chart
      • Likert Scale Chart
      • Matrix Chart
      • Multi Axis Line Chart
      • Overlapping Bar Chart
      • Pareto Chart
      • Radar Chart
      • Radial Bar Chart
      • Sankey Diagram
      • Scatter Plot Chart
      • Slope Chart
      • Sunburst Chart
      • Tornado Chart
      • Waterfall Chart
      • Word Cloud
    • Google Sheets
      Microsoft Excel
  • Services
  • Pricing
  • Contact us
  • Blog
  • Support dropdown img
      • Gallery
      • Videos
      • Contact us
      • FAQs
      • Resources
    • Please feel free to contact us

      atsupport@chartexpo.com

Categories
All Data Visualizations Data Analytics Surveys
Add-ons/
  • Google Sheets
  • Microsoft Excel
  • Power BI
All Data Visualizations Data Analytics Surveys
Add-ons
  • Google Sheets
  • Microsoft Excel
  • Power BI

We use cookies

This website uses cookies to provide better user experience and user's session management.
By continuing visiting this website you consent the use of these cookies.

Ok

ChartExpo Survey


Home > Blog > Google Sheets

Google Finance in Google Sheets for Smarter Visuals

What is Google Finance in Google Sheets? Is it a tool that simplifies financial tracking and analysis? Yes. This feature brings live stock market data directly into your spreadsheet.

Google Finance in Google Sheets allows you to access real-time market information. It includes stock prices, historical data, and currency exchange rates. You can track investments and analyze trends seamlessly by linking financial data with a spreadsheet. Whether you’re an investor, accountant, or a student learning finance, this feature fits various needs.

Google Finance in Google Sheet

Financial markets move quickly. Using Google Finance in Google Sheets keeps you updated with live data. You can compare historical trends and assess performance without switching platforms. The convenience it offers saves time and boosts accuracy.

Adding a financial tracking capability makes it even more versatile. For small businesses or individuals, it eliminates the need for costly financial software.

Imagine creating a personalized portfolio tracker in minutes. With easy-to-use formulas, Google Finance makes that possible. The tool empowers you to make informed financial decisions. It’s not just data; it’s actionable insights at your fingertips.

Let’s learn more about this tool.

Table of Contents:

  1. What is Google Finance in Google Sheets?
  2. What is Google Finance Function Syntax in Google Sheets?
  3. How to Use Google Finance in Google Sheets?
  4. How to Analyze Google Finance Sheet?
  5. What are the Practical Applications of Google Finance on Google Sheets with Examples?
  6. What are the Benefits of Using Google Finance on Google Sheets?
  7. Wrap Up

First…

What is Google Finance in Google Sheets?

Definition: Google Finance in Google Sheets is a tool for accessing live financial data. It lets you directly track stock prices, currency rates, and historical trends in a spreadsheet. With simple formulas, you can monitor investments or analyze market changes.

Google Finance updates data in real-time, ensuring accuracy and timeliness. This feature is ideal for professionals and individuals, and it is free and easy to use. It enhances financial planning and decision-making by integrating valuable market insights into your daily workflow.

What is Google Finance Function Syntax in Google Sheets?

The Google Finance function in Google Sheets is simple yet powerful. It is designed to help you track and analyze market trends. In seconds, you can pull stock prices, company information, and even historical data. It’s a great way to stay informed without switching between multiple platforms.

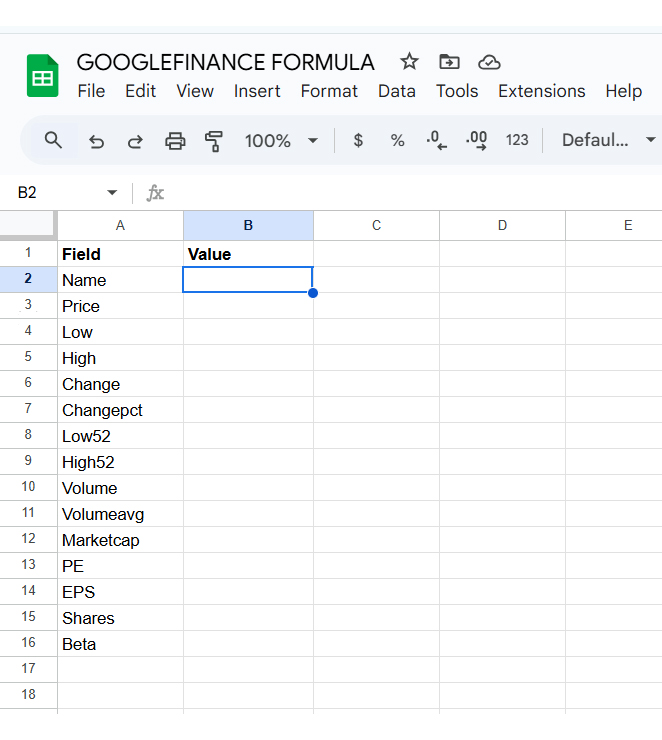
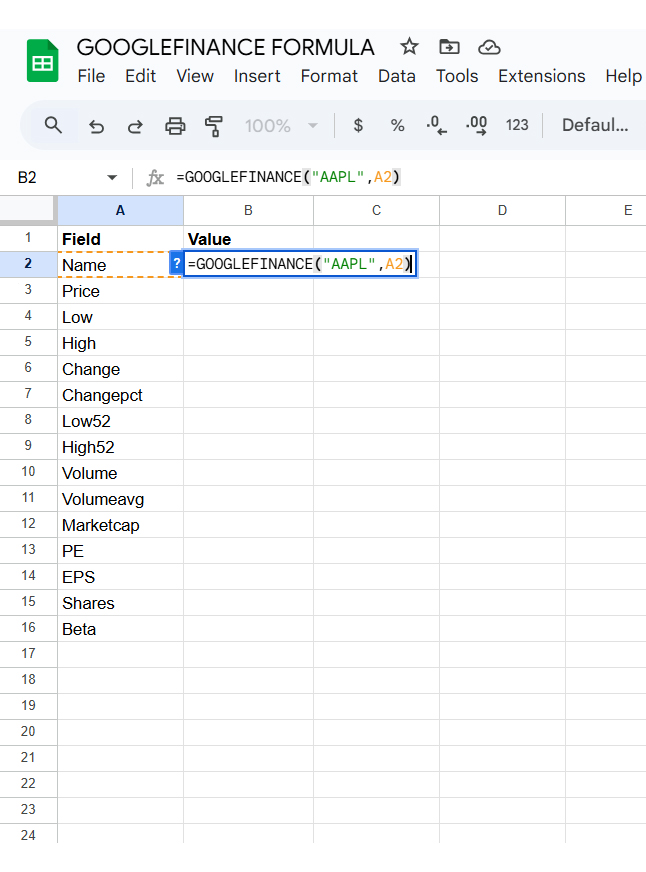
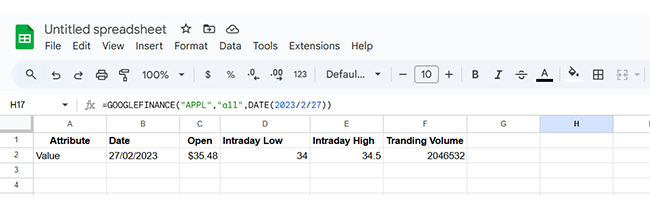
Here’s the syntax explained:

GOOGLE FINANCE(ticker, [attribute], [start_date], [end_date], [interval])

  • Ticker: This is the stock symbol or ticker for which you want data. For example, “GOOG” for Alphabet (Google).
  • Attribute: Defines what type of data you need. Use “price” for the current price or “volume” for the trading volume.
  • Start date: The date when you want data to begin. Example: “2023-01-01”.
  • End date: The date when you want data to end. Optional if you need current data only.
  • Interval: Defines frequency, such as “daily” or “weekly”.

How to Use Google Finance in Google Sheets?

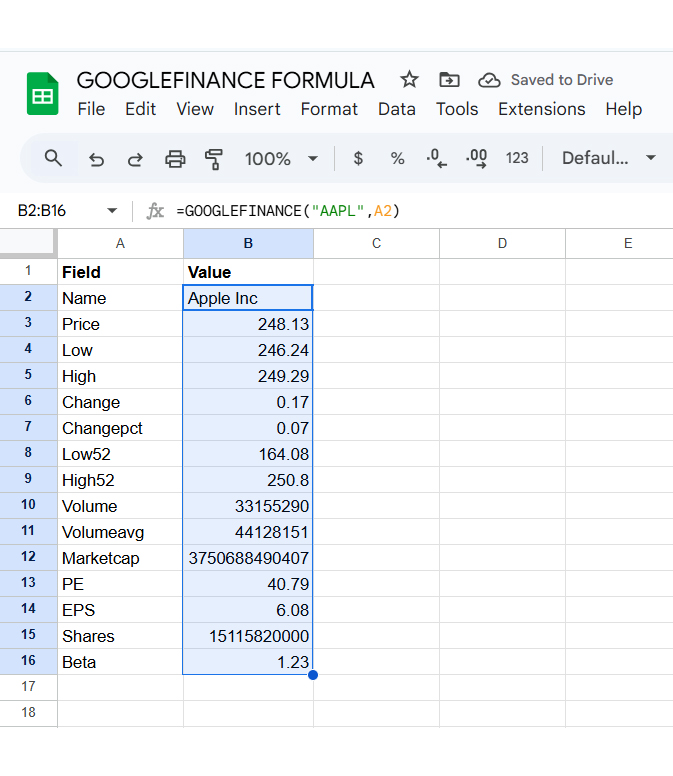
Imagine having a personal finance assistant who delivers reports on financial analysis by fetching stock prices, exchange rates, and historical data in seconds. That’s precisely what Google Sheets’ GOOGLEFINANCE function offers! This tool is a game-changer for anyone looking to track and analyze financial data seamlessly without switching tabs.

Here’s how you can make the most of this amazing feature.

  1. Obtain Stock Information
    • Syntax: GOOGLE FINANCE(ticker, [attribute])
    • For example, if you’re interested in Apple Inc. (ticker: “AAPL”), you can use the formula as follows: =GOOGLEFINANCE(“AAPL,” “price”).
    • This pulls Apple’s current stock price directly into your spreadsheet. Here’s how it appears in its simplest form: GOOGLEFINANCE (ticker, [attribute]):
Googlefinanace for Learning Google Finance in Google Sheet
    • Now, input this formula into a cell.
Input Fprmula into Cell for Learning Google Finance in Google Sheet
    • Google Sheets will fetch the corresponding stock details.
Google Sheets will Fetch Corresponding Stock Details for Learning Google Finance in Google Sheet
  1. Fetch historical stock data for a specific day. For detailed historical data:
    • Syntax: GOOGLE FINANCE(ticker, [attribute], [start_date])
    • Example: Using =GOOGLEFINANCE(“AAPL,” “all,” DATE(2023,2,27)) retrieves multiple metrics like open, high, low, and close prices for a specific date.
Syntax Google Finance for Learning Google Finance in Google Sheet
    • The result includes multiple columns for the date and each attribute. If the data spills over existing cells, you may encounter a #REF! Error. This indicates that the function needs empty cells to display its output.
  1. Analyze stock data over a time period using the formula below:
    • GOOGLE FINANCE(ticker, [attribute], [start_date], [end_date], [interval])
    • Example: =GOOGLEFINANCE(“AAPL”, “price”, DATE(2022,6,1), DATE(2022,12,31), “weekly”) provides weekly prices.
    • Calculate Year-to-Date (YTD) stock performance. Finding YTD performance isn’t directly supported for stock tickers, as the “return” attribute works only for mutual funds. But you can calculate it manually with this formula: =(GOOGLE FINANCE(ticker,”price”)/INDEX(GOOGLE FINANCE(ticker,”close”,”01/01″, today()),2,2))-1
    • Replace the ticker with your desired stock symbol. This formula will calculate YTD performance by comparing the latest price to the closing price on January 1.

How to Analyze Google Finance Sheet?

Data analysis thrives on clarity, and visualization is its shining star. Google Sheets offers tools like Google Finance for financial data, but creating insightful visuals can be tricky. Google Sheets often stumbles with advanced data visualization.

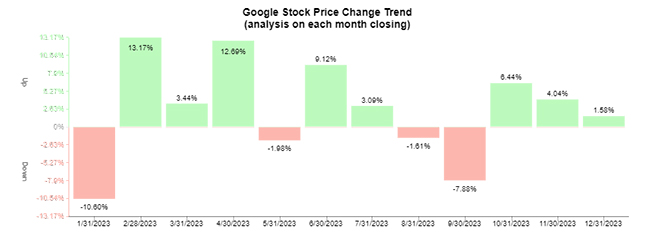
Enter ChartExpo—a simple, innovative add-on that transforms data into stunning visuals. It bridges the gap and elevates your analysis game.

ChartExpo takes your data visualization to the next level. It’s not just about charts; it’s about telling impactful stories. Here’s why it stands out:
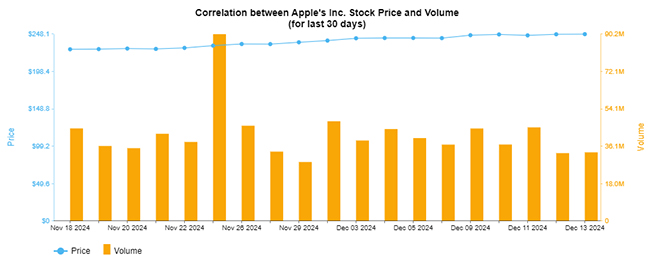
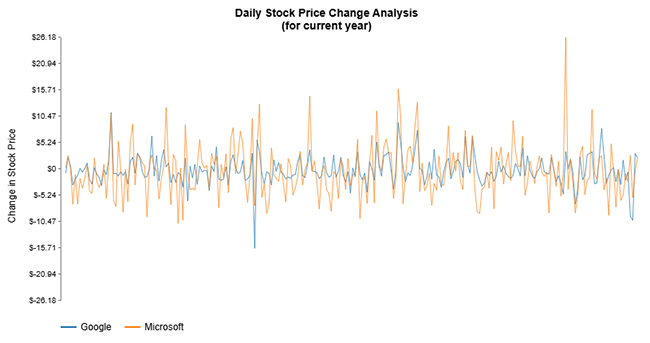
  • Diverse chart types: Access numerous unique and creative chart options.
  • Ease of use: No coding or advanced skills required—just a few clicks, and you’re there.
  • Interactive features: Bring your data to life with visuals that respond to your exploration.
  • Cost-effective: Affordable and worth every penny for the insights it delivers.

The charts and graphs below are created in Google Sheets using ChartExpo:
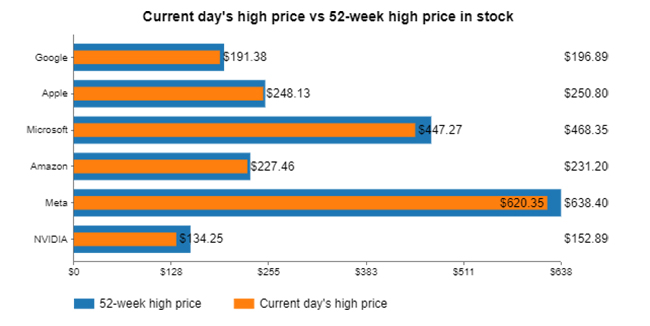
Dual Axis Line Chart

Dual Axis Line Chart for Learning Google Finance in Google Sheet

Multi Series Line Chart

Multi Series Line Chart for Learning Google Finance in Google Sheet

Progress Circle Chart

Progress Circle Chart for Learning Google Finance in Google Sheet

Sentiment Trend Chart

Sentitment Trend Chart for Learning Google Finance in Google Sheet

Overlapping Bar Chart

Overlapping Bar Chart for Learning Google Finance in Google Sheet

Let’s learn how to install ChartExpo in Google Sheets.

  1. To start using ChartExpo, download it directly from the Google Sheets program. To do this, select Extensions from the top toolbar.
  2. A menu will appear. Click the Get add-ons option.
  3. Search for ChartExpo, and click on Charts, Graphs & Visualizations by ChartExpo when it appears in the results.
  4. Click the Install button. You will have to confirm your Google account and accept some permissions.

ChartExpo charts are available both in Google Sheets and Microsoft Excel. Please use the following CTAs to install the tool of your choice and create beautiful visualizations in a few clicks in your favorite tool.

Example

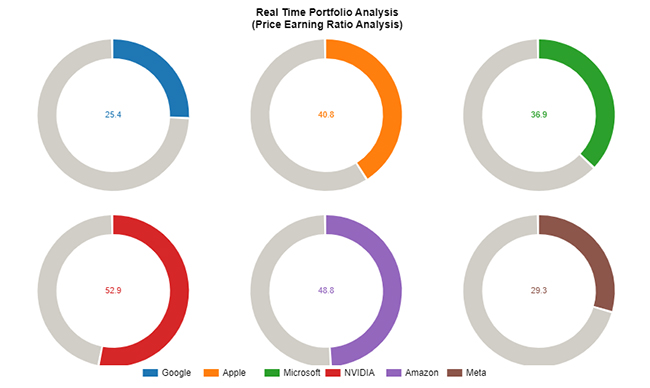
Let’s create a chart from the sample data below and analyze it using ChartExpo. This process will help in analyzing and interpreting data, uncovering key patterns and insights for informed decision-making.

Company Price Earnings Ratio
Google 25.39
Apple 40.79
Microsoft 36.92
NVIDIA 52.9
Amazon 48.75
Meta 29.26
  • To get started with ChartExpo, install ChartExpo in Google Sheets.
  • Go to Extensions > Charts, Graphs & Visualizations by ChartExpo > Open.
open chartexpo in google sheets
  • To access the charts library, click the Add new chart button.
add new chart in google sheets
  • Once ChartExpo is loaded. Click on “Progress Circle Chart”.
search progress circle chart in google sheets
  • First, insert the data table into the sheet. Then, select the Sheet name from the drop-down menu in the ChartExpo section.
  • Select the metric column; metric is the numeric column in your data sheet.
  • Select the dimensions column; the dimension is the categorical column in your datasheet that contains text information.
  • Click the Create chart button to complete the process.
Click Create Chart for Learning Google Finance in Google Sheet
  • Your tabular data will turn into a Progress Circle Chart, as shown below.
  • Click the Edit chart button to make custom changes.
Edit Chart for Learning Google Finance in Google Sheet
  • To change the title of the chart, click the pencil icon next to the Chart Header.
  • It will open the properties dialog. Under the Text section, you can add a heading in Line 1 and enable the Show option. Give the appropriate title of your chart and click the Apply button.
Add Chart Header for Learning Google Finance in Google Sheet
  • You can change the variation type by clicking on Chart settings as follows:
Change Variation Type by Clicking on Chart Settings for Learning Google Finance in Google Sheet
  • Set the label precision to 2.
Set Label Precision to 2 for Learning Google Finance in Google Sheet
  • Click the “Save” button:
Click Save Button for Learning Google Finance in Google Sheet
  • Your final chart will appear as shown below.
Final Google Finance in Google Sheet

Insights

  • NVIDIA: Highest price-to-earnings (P/E) ratio at 52.90.
  • Google: Lowest P/E ratio in the portfolio.
  • Others: P/E ratios fall between these two values.

Unveil Financial Patterns Using Google Finance in Google Sheets for Charts:

  1. Open your Google Sheets Application.
  2. Install ChartExpo Add-in for Google Sheets from Google Workspace Marketplace.
  3. Select the Progress Circle Chart from the list of charts.
  4. Fill in the necessary fields.
  5. Click on the “Create Chart” button.
  6. Customize your chart properties to add header, axis, legends, and other required information.
  7. Export your chart and share it with your audience.

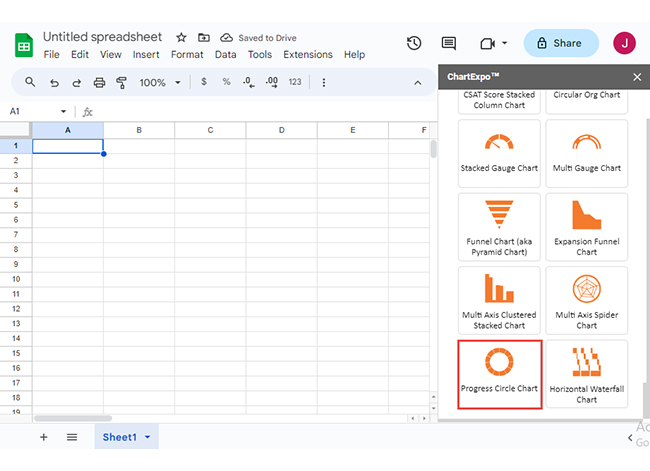
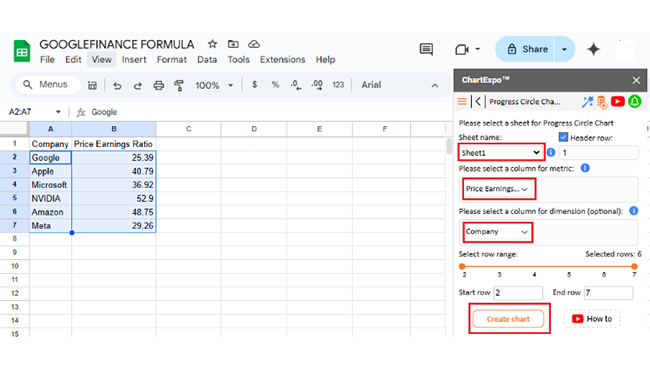
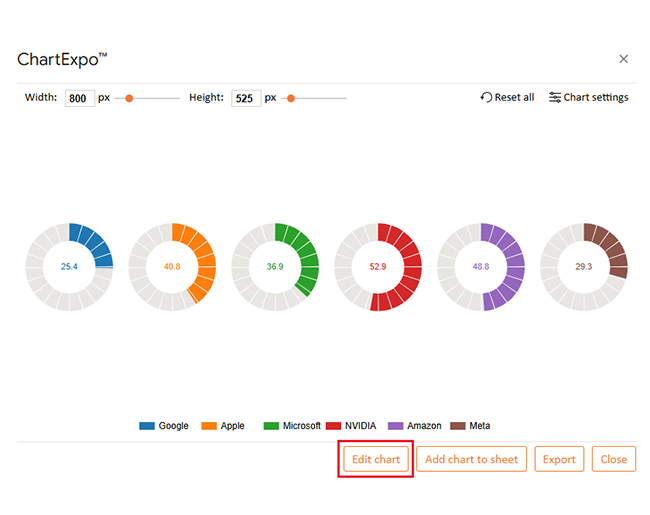
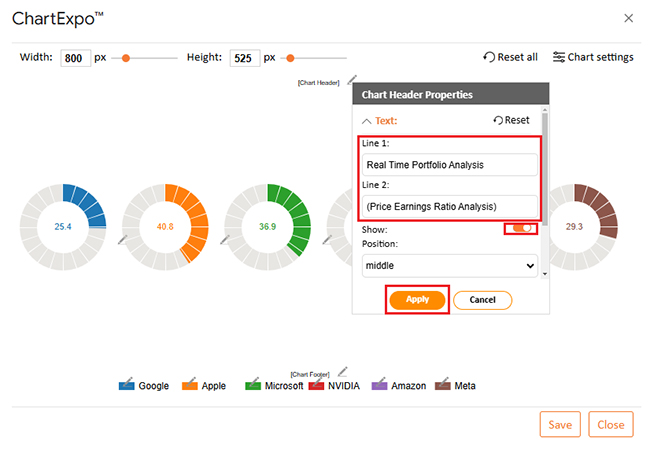
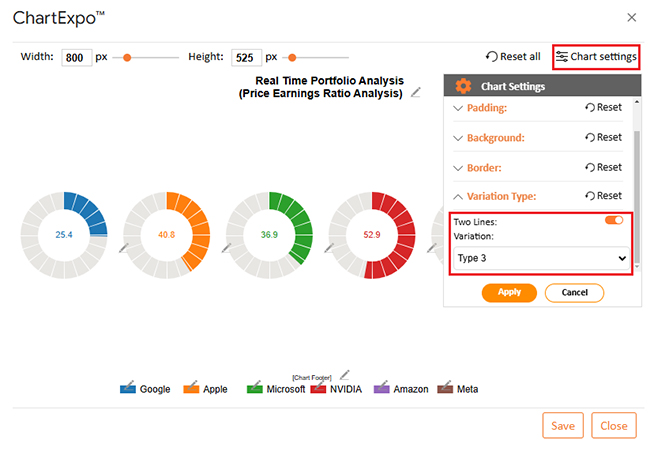
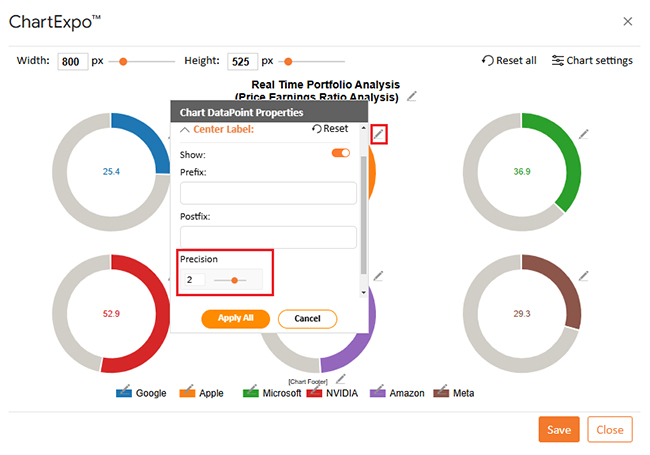
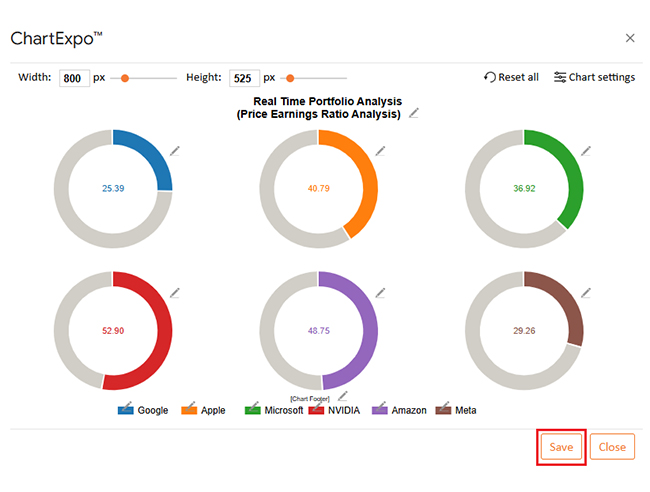
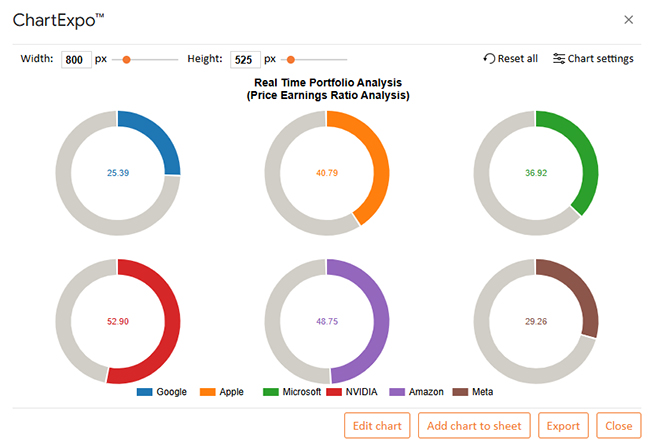
The following video will help you to create a Progress Circle Chart in Google Sheets.

What are the Practical Applications of Google Finance on Google Sheets with Examples?

Imagine having all your financial insights—real-time stock prices, historical trends, and portfolio performance—right at your fingertips. You can effortlessly turn data into decisions with Google Finance in Google Sheets. Here’s how you can put it to work:

  • Track stock prices: Get live updates on the stocks you care about most. Create a dashboard that refreshes automatically, informing you of real-time market movements.
  • Historical data analysis: Explore past performance to identify trends and patterns. Use historical data to uncover insights and make more informed investment decisions.
  • Portfolio management: Organize and manage your investments in one place. Combine real-time stock prices with your portfolio holdings to see how your investments perform.
  • Currency conversion: Handle global investments like an expert. Convert foreign currencies using live exchange rates to get accurate valuations of your international assets.
  • Dividend tracking: Stay on top of your passive income. Monitor dividend payouts and estimate future earnings based on your stock holdings.

What are the Benefits of Using Google Finance on Google Sheets?

Google Finance on Google Sheets is more than a tool—it’s a game-changer. It helps you simplify, streamline, and supercharge how you manage your financial data. Here’s why it’s a must-have for anyone serious about their money:

  • Real-time data: Stay ahead of the curve with live stock prices and market updates. No more refreshing pages or switching tabs—your spreadsheet does it all.
  • Automation: Wave goodbye to manual updates. Automate data fetching, calculations, and tracking so you can focus on decision-making instead of data entry.
  • Customizable analysis: Tailor your financial insights to your needs with best-designed dashboards. Build customized visuals, run precise calculations, and create charts that provide unparalleled clarity and actionable insights.
  • Historical data: Dig deep into the past to uncover trends. Access historical prices, evaluate performance, and use the data to make data-driven decisions.
  • Cost-efficient: Why pay for expensive software? Google Sheets is free and comes packed with tools that rival premium financial apps.
  • Easy collaboration: Share your financial insights with just a few clicks. Collaborate with teammates, advisors, or partners in real-time.
  • Portfolio tracking: Track your investments like a pro. Combine stock prices with your holdings to see your portfolio’s performance at a glance.
  • Accessible anywhere: Whether on your desktop, tablet, or phone, your financial data is always within reach. Stay connected no matter where you are.
  • Versatility: From tracking stocks to monitoring dividends or currency conversions, Google Sheets adapts to your unique needs.

FAQs

What is the alternative to Google Finance in Google Sheets?

An alternative to Google Finance in Google Sheets is using APIs or third-party add-ons. Tools like Yahoo Finance API or services such as Alpha Vantage provide financial data. They offer flexibility and can integrate seamlessly for broader analysis.

How to make a Finance spreadsheet in Google Sheets?

Creating a finance spreadsheet in Google Sheets is simple.

  • List your financial categories, such as income, expenses, and savings.
  • Use formulas for calculations and Google Finance for stock data.
  • Add charts for visuals.
  • Customize it to fit your goals.

Is it safe to use Google Sheets for finances?

Yes, Google Sheets is generally safe for managing finances. It uses encryption to protect data. However, avoid storing sensitive information like credit card numbers. Also, use secure sharing settings and enable two-factor authentication for added security.

Wrap Up

Google Finance in Google Sheets is a game-changer for tracking financial data. It simplifies the process by pulling real-time market data directly into your spreadsheet. Investors, analysts, and finance enthusiasts can use it with ease.

This feature allows you to monitor stocks, mutual funds, and currencies. All you need is the =GOOGLEFINANCE() function. It’s customizable, making it easy to focus on the data you need most.

One significant advantage is the ability to automate updates. As markets shift, your spreadsheet reflects those changes, saving time and reducing annual data input errors.

Despite its usefulness, Google Finance has limitations. It doesn’t support all financial metrics, and you might need alternative tools or integrations for deeper insights.

Combining Google Sheets with other solutions is smart for powerful analysis. ChartExpo, for instance, complements Google Finance with advanced data visualizations. Together, they provide better insights and decision-making tools.

Conclusively, Google Finance in Google Sheets is reliable and accessible. Start using it today with ChartExpo to gain a solid understanding of financial trends.

How much did you enjoy this article?

GSAd2
Start Free Trial!
145669

Related articles

next previous
Google Sheets10 min read

Google Sheets Amortization Schedule with Clear Visuals

A Google Sheets Amortization Schedule tracks loan payments, interest, and balances. Learn how to create your schedule for better loan management.

Google Sheets11 min read

Google Sheet Profit and Loss Template for Financial Success

Google Sheet profit and loss template simplifies tracking income and expenses. Learn tips and steps for using this template for better financial management.

Google Sheets11 min read

Sales Tracking Spreadsheet for Better Insights

A Spreadsheet for Sales Tracking organizes data, tracks performance, and analyzes trends. This guide covers its benefits, templates, and visualization tips.

Google Sheets11 min read

How to Create a Chart in Google Sheets in Few Steps?

Learn step-by-step how to create a chart in Google Sheets to visualize your data clearly and effectively, even if you're a beginner.

Google Sheets14 min read

How to Use Google Spreadsheet for Insightful Results

Learn how to use Google Sheets for data management. You’ll discover tips on adding data, using formulas, creating charts, and more to streamline your work.

ChartExpo logo

Turn Data into Visual
Stories

CHARTEXPO

  • Home
  • Gallery
  • Videos
  • Services
  • Pricing
  • Contact us
  • FAQs
  • Privacy policy
  • Terms of Service
  • Sitemap

TOOLS

  • ChartExpo for Google Sheets
  • ChartExpo for Microsoft Excel
  • Power BI Custom Visuals by ChartExpo
  • Word Cloud

CATEGORIES

  • Bar Charts
  • Circle Graphs
  • Column Charts
  • Combo Charts
  • Comparison Charts
  • Line Graphs
  • PPC Charts
  • Sentiment Analysis Charts
  • Survey Charts

TOP CHARTS

  • Sankey Diagram
  • Likert Scale Chart
  • Comparison Bar Chart
  • Pareto Chart
  • Funnel Chart
  • Gauge Chart
  • Radar Chart
  • Radial Bar Chart
  • Sunburst Chart
  • see more
  • Scatter Plot Chart
  • CSAT Survey Bar Chart
  • CSAT Survey Chart
  • Dot Plot Chart
  • Double Bar Graph
  • Matrix Chart
  • Multi Axis Line Chart
  • Overlapping Bar Chart
  • Control Chart
  • Slope Chart
  • Clustered Bar Chart
  • Clustered Column Chart
  • Box and Whisker Plot
  • Tornado Chart
  • Waterfall Chart
  • Word Cloud
  • see less

RESOURCES

  • Blog
  • Resources
  • YouTube
SIGN UP FOR UPDATES

We wouldn't dream of spamming you or selling your info.

© 2025 ChartExpo, all rights reserved.