Categories
Fixed income vs. equity: a classic financial showdown that has sparked countless investor debates. It’s the ultimate battle of stability versus growth, caution versus risk-taking.


I am here to guide you through this epic clash of investment options.
On one hand, you have a fixed income, the steady and reliable cousin of the investment world. It’s all about bonds, loans, and guaranteed returns. You know exactly what you’re getting, and that can be a comforting thought.
On the other hand, you have equity, the wild and unpredictable rebel of the financial universe. It’s all about stocks, ownership, and the potential for massive gains (or crushing losses).
So, how do you compare these two formidable foes?
It all comes down to your risk appetite, investment goals, and time horizon.
Are you the cautious tortoise who values stability? Or the adventurous hare who craves growth? Only you can decide which path to take.
Now, let’s dive in and demystify fixed income vs. equity.
Definition: Fixed income refers to an investment security that pays a predetermined, fixed interest or dividend at regular intervals. These investments typically include bonds and certificates of deposit (CDs). The fixed nature of the income distinguishes it from variable income. It provides a predictable stream of payments to investors.
Fixed-income securities are known for their relative stability and lower risk than equities. This makes them attractive to conservative investors seeking regular income and capital preservation.
Moreover, the fixed-income market plays a crucial role in the broader financial landscape. It offers a range of investment options with varying maturities, yields, and risk profiles to suit investors’ preferences, allowing them to analyze return on investment capital effectively.
Definition: In finance and investing, equity represents ownership or interest in an asset or company. It signifies the residual interest after deducting liabilities from assets, reflecting the net worth.
In the context of stocks, equity refers to ownership shares that confer ownership in a company. Equity holders have a claim on the company’s assets and earnings.
Equity is a key component of a company’s balance sheet, encompassing common stock, preferred stock, and retained earnings. It serves as a measure of ownership value and is crucial for assessing a company’s financial health.
Equity is dynamic. It can change based on market conditions, asset values, and the financial performance of companies or properties. Therefore, understanding equity is fundamental for managing your financial portfolios and aligning them with your long-term financial goals.
| Aspect | Fixed Income Market | Equity Market |
| Market Size | Larger, due to government and corporate bond issuance | Smaller but growing with market capitalization |
| Risk Level | Lower risk, stable returns | Higher risk, the potential for high returns |
| Return Potential | Predictable, lower returns | Volatile, higher growth potential |
| Investment Type | Bonds, treasury securities, corporate debt | Stocks of publicly traded companies |
| Market Role | Provides income stability and funding for governments & corporations | Drives economic growth and wealth creation |
Fixed-income securities are debt instruments that offer returns through regular, fixed-interest payments to investors.
Equity securities are financial assets that represent ownership shares in a corporation.
Keep reading to discover the contrasting wonders that lie within fixed income vs. equity. Key differences, risks, stability, and potential returns
Fixed-income investments, such as bonds, offer a predetermined, fixed interest or dividend at regular intervals. These payments are contractual and provide a predictable stream of income.
In contrast, equity investments, particularly stocks, involve ownership in a company. The returns are variable and depend on company performance and market research. Equity returns may come from capital appreciation (increase in stock price) or dividends.
Risks of Fixed-income: Securities are less risky than equities. The fixed nature of interest payments and the return of principal at maturity provide stability.
Risks of equities: Pose higher risks due to market volatility. The prices of stocks are subject to fluctuations, directly influencing the value of the investment. Moreover, equity holders also face the risk of company performance affecting stock value.
Fixed-income investors are creditors or lenders to the issuer holding a debt instrument. They have a contractual relationship and do not hold ownership stakes in the company.
On the other hand, equity investors in the dynamic of fixed income vs. equity, own a share of the company. They have voting rights and can participate in decision-making processes at shareholder meetings.
Fixed-income investments provide a stable and predictable income stream. Bondholders receive regular interest payments, and the return of principal at maturity adds to this stability.
Equity income, in the form of dividends, is not guaranteed. Also, it can vary based on company performance and decisions by the board of directors.
Fixed-income securities have a specified maturity date when the principal is repaid.
On the other hand, equities do not have a maturity date; investors can hold stocks indefinitely. This distinction impacts the investment horizon and planning for investors in fixed income vs. equity.
In a company’s capital structure, fixed-income securities represent debt and are considered senior to equity. Bondholders have priority in repayment in case of bankruptcy.
Conversely, equity represents ownership and is subordinate to debt in the capital structure. Equity holders receive residual value after debt obligations are met.
Let’s unravel the complexities and dance through the nuances of comparing fixed income vs. equity investments.
Fixed income vs. equity investments differ significantly in their risk and return profiles. Fixed-income securities like bonds generally offer a more predictable income stream. This is in the form of interest payments and the return of principal at maturity. Thus, they have a lower-risk investment compared to equities.
Conversely, equities signify ownership in a company and are susceptible to market shifts. Although equities offer the prospect of higher returns, they are accompanied by greater volatility and higher risk levels.
Fixed-income investments are known for their income-generating capabilities. Bondholders receive periodic interest payments, providing a steady income stream. This can be appealing to investors seeking reliable cash flow.
In contrast, equities typically generate income through dividends. These dividends are not guaranteed and may vary based on the company’s performance and decisions.
Equities have capital appreciation potential as their value can increase based on the company’s growth and profitability. Investors in stocks may benefit from both dividends and stock price appreciation.
Fixed-income securities, while offering stability, may not provide the same level of capital appreciation potential.
Equity investments confer ownership rights in a company, giving shareholders certain privileges like voting on corporate matters. Investors holding a significant portion of a company’s equity may influence key decisions.
Fixed-income investors, however, are creditors and do not have ownership stakes or voting rights.
Different market dynamics and economic conditions can influence the performance of fixed-income and equity investments. Interest rates, inflation, and credit risk often impact fixed-income securities.
Conversely, equities are sensitive to factors like company earnings, industry trends, and market sentiment. Understanding these dynamics is crucial to making informed decisions based on risk tolerance and investment objectives.
A government issues a 10-year U.S. Treasury bond with a 5% annual coupon rate. Investors who buy this bond will receive fixed interest payments of 5% every year and get back the principal amount at the end of 10 years. This provides predictable income and lower risk.
An investor buys 100 shares of Apple Inc. at $150 per share. If Apple’s stock price increases to $180, the investor earns a capital gain of $30 per share. Additionally, if Apple pays a dividend of $2 per share, the investor also earns $200 in dividends.
A common rule for calculating equity vs. fixed-income allocation by age is the “100 Minus Age Rule” (or its variations).
Formula:
Equity Allocation=100−Your Age
Fixed Income Allocation=Your Age
Example:
Data analysis, my friend, is no stroll through the park. It’s a complex endeavor where numbers dance and insights hide.
But fear not, for there’s a way to turn it into a delightful adventure – data visualization. Data visualization brings clarity and understanding to vast information, unlocking the hidden treasures within your data.
However, Excel, although a mighty tool for analysis, falls short in visualization. This is where ChartExpo comes into play, guiding you through data analysis with finesse and flair.
Let’s learn how to install ChartExpo in Excel.
ChartExpo charts are available both in Google Sheets and Microsoft Excel. Please use the following CTA’s to install the tool of your choice and create beautiful visualizations in a few clicks in your favorite tool.
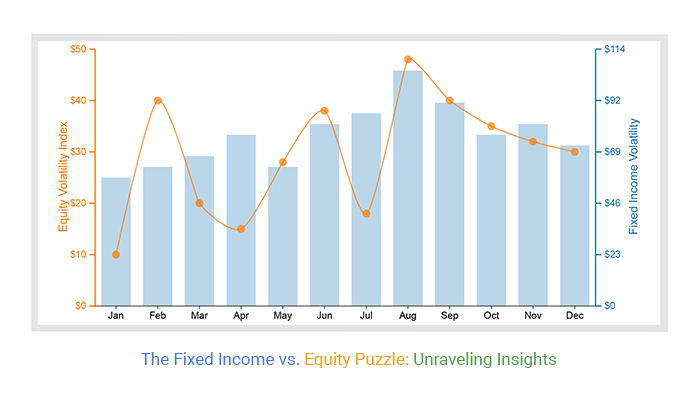
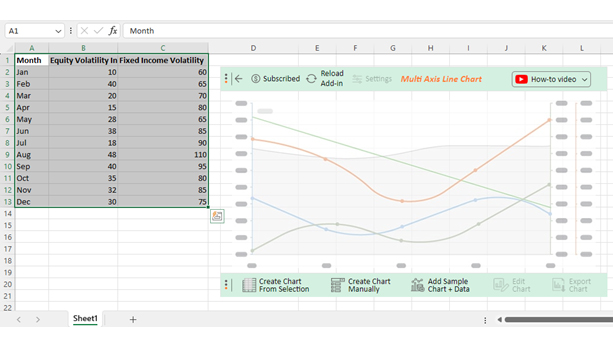
Let’s say you want to analyze the yearly equity volatility index vs fixed income volatility data below.
| Month | Equity Volatility Index | Fixed Income Volatility |
| Jan | 10 | 60 |
| Feb | 40 | 65 |
| Mar | 20 | 70 |
| Apr | 15 | 80 |
| May | 28 | 65 |
| Jun | 38 | 85 |
| Jul | 18 | 90 |
| Aug | 48 | 110 |
| Sep | 40 | 95 |
| Oct | 35 | 80 |
| Nov | 32 | 85 |
| Dec | 30 | 75 |
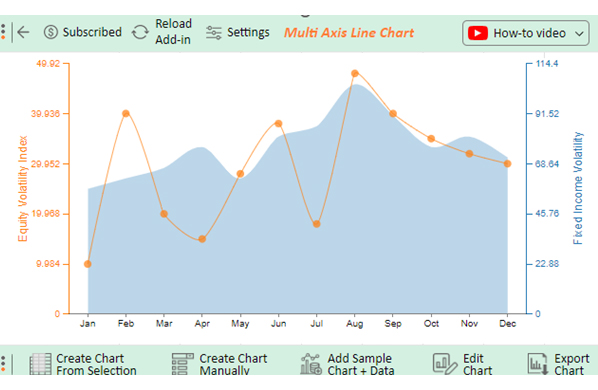
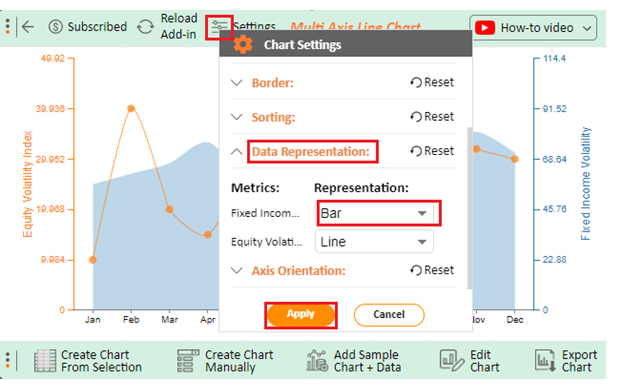
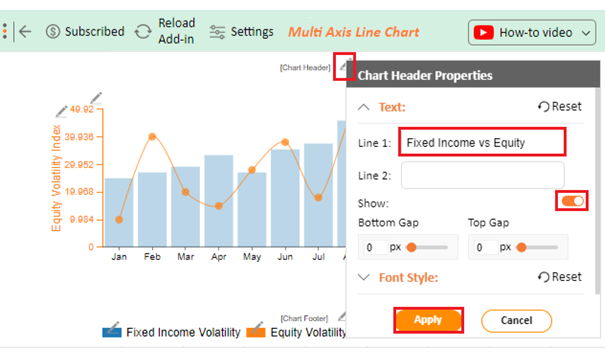
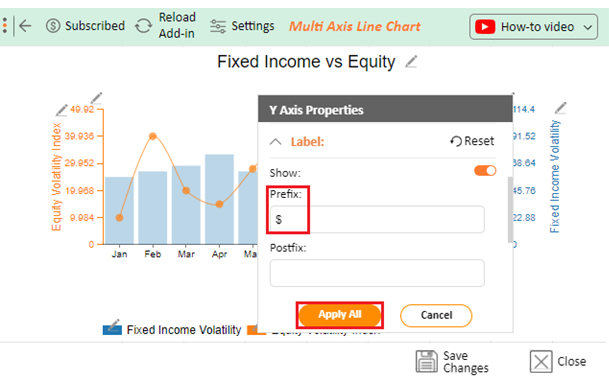
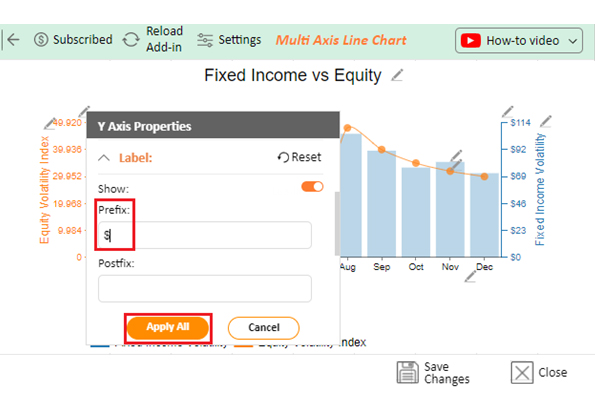
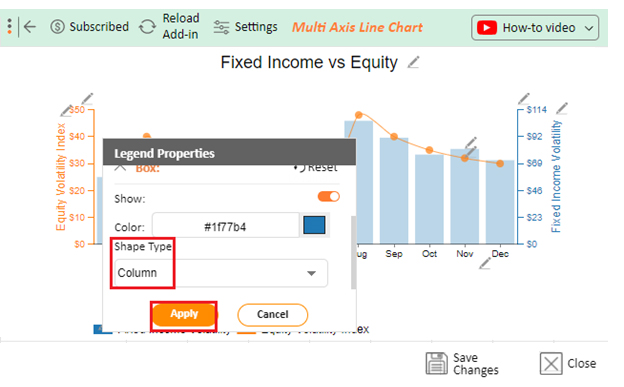
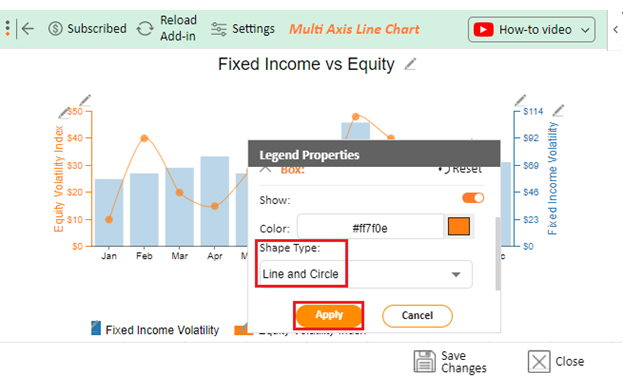
Follow these steps to create a visualization with ChartExpo and make insights dance on your screen.


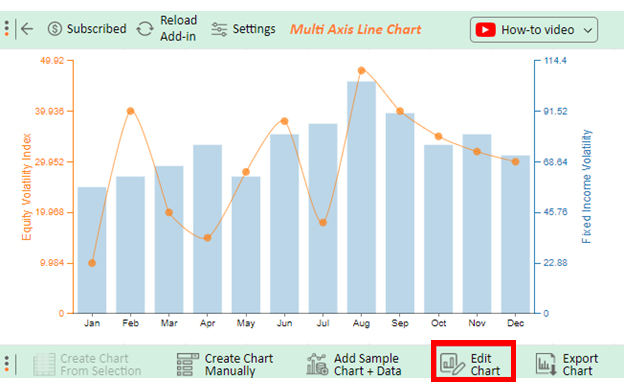
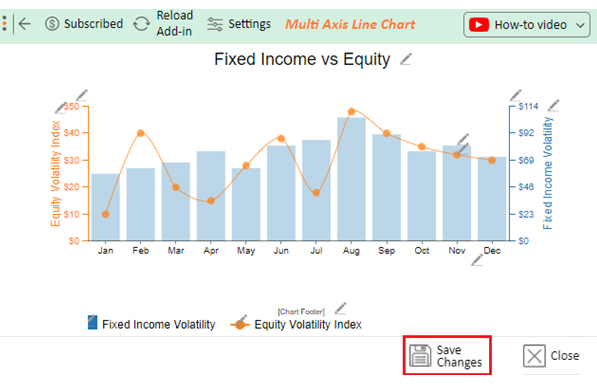
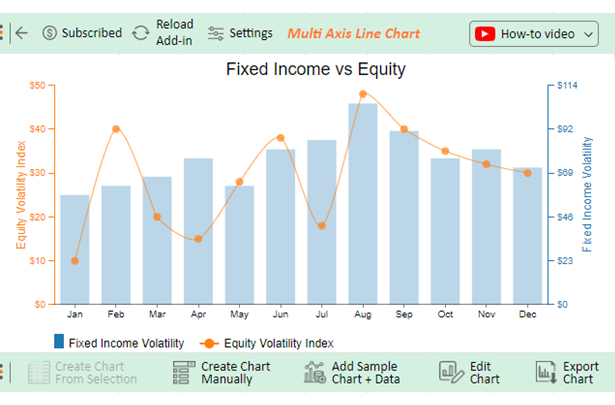
Peaks in equity volatility occurred in February and August, indicating increased market fluctuations. On the other hand, fixed income volatility remained generally steady, experiencing a notable uptick in August.
The relationship between equity and fixed income lies in their role within an investment portfolio and how they interact in financial markets:
Fixed income’s predictable income stream from interest payments and return of principal at maturity makes it less risky. This stability shields investors from the market volatility associated with the ownership and fluctuating values of equities.
Choosing between equity and fixed income depends on individual financial goals and risk tolerance. Equities offer the potential for higher returns but come with greater risk. Fixed income provides stability and predictable income, making it suitable for conservative investors. Or those seeking steady cash flow.
Equity represents ownership in a company, commonly in the form of stocks. Equity holders, known as shareholders, have a claim on the company’s assets and earnings. The value of equity fluctuates with the company’s performance and market conditions.
Navigating the realms of fixed income and equity investments involves balancing risks and rewards.
Fixed income offers stability, dependable income, and reduced volatility, appealing to risk-averse investors. In contrast, equity presents the opportunity for greater returns but with higher market volatility and uncertainty.
Moreover, understanding the distinct characteristics of fixed income and equity is crucial for informed decision-making. To create a well-rounded investment portfolio, you must assess your preferences, time horizon, and market outlook. Whether you opt for the steady rhythm of fixed income or dance with the dynamic moves of equity doesn’t matter. The key lies in aligning investment choices with individual objectives.
Ultimately, comparing fixed income vs. equity is a personalized exploration with no one-size-fits-all answer. It’s about crafting an investment strategy that suits your financial aspirations, risk appetite, and long-term objectives.
ChartExpo transforms complex financial data into visually engaging insights. It makes comparing fixed income vs. equity a fascinating financial exploration and decision-making journey.
Don’t let your data be a wallflower! Spice it up with ChartExpo.
How much did you enjoy this article?


Calculate accounts receivable turnover ratio to measure credit collection speed, improve cash flow, and strengthen your financial strategy. Read on!

Change Management KPIs are the key to tracking adoption, performance, and ROI during transitions. Find out which metrics matter. Read on!

Data collection methods and techniques determine the quality of every insight you act on. Explore key approaches for gathering reliable data. Read on!


