Categories
By ChartExpo Content Team
Data tells a story. But without the right questions, that story stays untold. Demographic survey questions turn raw responses into insights, helping businesses, researchers, and policymakers understand the people they serve.
Every decision—product launches, marketing campaigns, hiring strategies—relies on knowing who your audience is. Demographic survey questions break down age, income, education, and more, revealing patterns that shape industries.


Asking demographic survey questions isn’t about collecting numbers. It’s about finding meaning. A well-structured survey doesn’t just gather data—it uncovers trends, predicts behavior, and improves engagement.
Miss the mark, and you risk incomplete or misleading results.
First…
Demographic survey questions are designed to gather specific data points about the characteristics of survey participants. This data helps paint a clearer picture of who the respondents are, segmenting them based on various demographic factors.
These factors often include age, gender, race, education, employment status, and household income.
Demographic survey questions play a pivotal role in data gathering by providing insights that help in understanding the composition of a population. These insights are essential for making data-driven decisions, whether in academic research, market analysis, or policy making.
Collecting demographic data ensures that the voices of all community segments are heard and considered.
Businesses use demographic survey questions to divide markets into specific segments. This market segmentation allows companies to develop targeted marketing strategies that appeal to specific groups.
By understanding the demographic makeup of their customer base, businesses can create more effective and efficient marketing campaigns.
The effectiveness of demographic survey questions hinges on their design. The right questions can yield meaningful insights that drive better decision-making.
Asking precise, relevant questions helps organizations gather data that is truly reflective of their target demographics, which in turn enhances the accuracy of their research or marketing strategies.
Identifying clear goals is vital for effective data collection. What specific information do you need? Are you assessing market trends or understanding customer preferences? Setting these targets early helps tailor your questions to fetch the most relevant data.
For instance, if age-related trends are your focus, ensure your questions accurately capture age groups that align with your analysis needs. This strategic approach not only streamlines the process but also enhances the accuracy of your insights.
Choosing the right questions is more than just listing demographics. It’s about aligning these queries with your business goals. If your objective is to enhance product offerings for a specific age group, your questions should delve into the preferences and customer behaviors of that group.
This alignment ensures the data you collect directly informs your business strategies, making your actions more targeted and effective.
One common mistake is asking overly broad or irrelevant questions. This not only confuses respondents but also dilutes your data quality. To avoid this, focus on questions that are directly linked to your goals.
Another error is using complex or technical language that can alienate respondents. Stick to clear and simple language to ensure everyone understands and can provide accurate answers.
Lastly, ensure your questions are unbiased and inclusive, reflecting a diverse range of perspectives which enriches the data’s reliability and applicability.
Age questions gather vital data, revealing generational impacts on markets and trends. Surveys categorize age into ranges, simplifying analysis. These ranges help identify preferences and habits distinct to age groups.
Marketers use this data to tailor strategies, ensuring relevance across diverse age demographics.
What is your age group?
Which generational category best describes you?
Gender identity questions must be inclusive, recognizing a spectrum of identities beyond the binary choices. Modern surveys typically offer multiple options or an open-ended response to respect all identities.
This inclusivity not only respects respondents but also enriches the data’s quality, reflecting true diversity in consumer bases.
What is your gender identity?
Which pronouns do you use?
Questions on ethnicity and race require sensitivity but are essential for understanding diverse backgrounds. These questions should allow multiple selections, reflecting mixed heritage accurately.
Data from these questions helps organizations address and support diversity, ensuring services and products are relevant to all ethnic groups.
Which race/ethnicity best describes you?
Income brackets in surveys determine economic status and spending ability. Correctly set brackets ensure data captures economic diversity effectively. This data guides businesses in product pricing and marketing, aligning offers with the financial reach of different demographics.
What is your total annual household income before taxes?
Education level questions predict engagement and purchasing patterns. Higher education often correlates with greater spending power and specific consumer behavior. Understanding educational backgrounds helps tailor educational products and job-related services.
What is the highest level of education you have completed?
Employment status reveals economic engagement and stability. Options like full-time, part-time, or unemployed provide insights into economic conditions and potential markets. This information is crucial for services and products aimed at specific employment categories.
What is your current employment status?
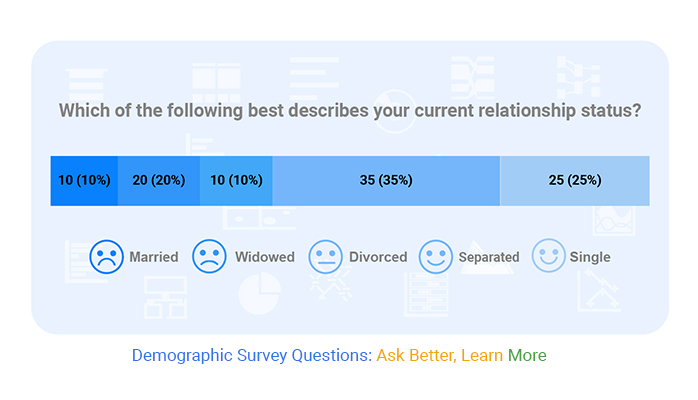
Marital status affects spending habits and priorities. Single, married, or divorced options can predict different spending and saving patterns, influencing product and service marketing strategies.
What is your current marital status?
The number of dependents directly impacts financial priorities and available income. This question helps businesses understand household responsibilities, tailoring products to meet family-based needs.
How many dependents (children, elderly family members, or others you financially support) do you have?
None
Larger households may have different needs and spending habits than smaller ones. Knowing household size can guide bulk purchasing promotions and family-sized product offerings.
How many people, including yourself, live in your household?
Country of residence highlights regional market differences. This information tailors marketing strategies to fit cultural and economic contexts specific to each country.
Country of Residence Survey Question
In which country do you currently reside?
(Open-ended or dropdown list of countries)
Living in urban or rural areas influences access to services and infrastructure. This data helps companies adjust their delivery services and product offerings to suit different living conditions.
Which best describes the area where you currently live?
State or ZIP code data pinpoints local preferences and needs. This hyper-local information supports businesses in developing targeted local marketing strategies and product distributions.
What is your current ZIP code?
(Open-ended response)
Offering surveys in primary languages ensures higher accuracy and engagement. This adaptation respects linguistic diversity, improving response rates and data quality.
What is your primary language (the language you use most at home)?
(Open-ended response or dropdown list of common languages)
Which additional languages do you speak fluently? (Select all that apply)
Religion can deeply influence lifestyle choices and consumer behavior. Understanding religious affiliations helps tailor products to meet cultural sensitivities and needs.
What is your religious affiliation?
Although sensitive, political affiliation questions can unlock insights into consumer values and priorities, aiding in brand alignment and targeted campaigning.
Which political ideology best represents your views?
Knowing the industry of employment reveals economic trends and sector-specific needs. This information helps tailor professional services and products.
Which industry do you currently work in?
Work experience reflects professional stability and career progression. This data assists in understanding professional development needs and targeting career-related products.
How many years of total work experience do you have?
How long have you been with your current employer?
Job titles and responsibilities indicate decision-making power and professional influence. Detailed insights assist in B2B marketing and professional service offers.
What is your current job title?
(Open-ended response)
Which of the following best describes your job level?
Internet access data is crucial, impacting survey participation and digital product reach. This information guides digital inclusivity strategies.
How reliable is your internet connection?
What type of internet connection do you primarily use at home?
Knowing whether respondents use smartphones or desktops guides app and website design, ensuring optimal user experience across devices.
Which device do you primarily use to access the internet?
Social media engagement levels reveal where different demographics are most active online, guiding targeted social media marketing strategies.
Which social media platforms do you use regularly? (Select all that apply)
How often do you use social media?
The CSAT survey chart is pivotal in assessing satisfaction across different demographics. It visually represents satisfaction levels, often using a Likert scale. This scale might range from ‘Very Unsatisfied’ to ‘Very Satisfied’. Analyzing this data helps businesses tailor their services to meet diverse customer needs.
When demographic variables like age or location are cross-analyzed with CSAT scores, patterns emerge that can guide customer experience strategies.
For example, younger demographics may show higher satisfaction with digital services than older groups. These insights direct where to focus improvement efforts or marketing strategies to boost satisfaction.
Likert scale charts are instrumental in measuring attitudes in demographic surveys. They typically involve statements rated on a scale, such as 1 to 5, where respondents indicate their level of agreement. This method is widely used due to its simplicity and effectiveness in capturing subtle nuances in attitudes.
When demographic data is layered with Likert scale responses, it reveals how different groups feel about specific issues. For instance, analyzing responses by gender might show that women are more concerned about environmental sustainability than men. Such detailed insights are valuable for developing targeted campaigns or policies.
The following video will help you to create a Likert Scale Chart in Microsoft Excel.
The following video will help you to create a Likert Scale Chart in Google Sheets.
The following video will help you to create a Likert Scale Chart in Microsoft Power BI.
Neutral language in demographic questions is critical. It prevents influencing respondents’ answers. For example, instead of asking if someone is “young” or “old,” specify age ranges. This removes any subjective bias that these words might carry.
Ensuring neutrality helps in collecting data that truly reflects the demographic characteristics of the population. This approach supports the validity and reliability of the data gathered.
Choosing between open-ended questions and multiple-choice questions affects data quality and analysis. Multiple-choice questions make processing responses easier and more consistent. However, they may limit the range of responses.
Open-ended questions allow for a broader range of answers, revealing more nuanced insights. Yet, they can pose challenges in categorization and analysis. Balancing these types depends on the goals of the survey and the resources available for data analysis.
To avoid bias in demographic surveys, steer clear of leading and loaded questions. A leading question suggests a particular answer. For example, “How satisfied are you with the excellent service?” implies the service was excellent.
A loaded question contains a controversial assumption. Such as, “How often do you use illegal drugs?” which presumes the respondent uses illegal drugs. Both types of questions can skew the results and undermine the survey’s integrity.
The decision on whether to position demographic questions at the start or the end of a survey hinges on the objectives of the survey and the sensitivity of the demographic questions.
If the intent is to customize the succeeding questions or the data analysis based on demographic info, starting with these questions is practical. It helps in segmenting the data from the outset.
However, for surveys where the main focus is on gathering opinions or experiences without initial segmentation, placing demographic questions at the end might work better.
This setup respects participants’ privacy and allows them to first engage with the core topics without feeling guarded about sharing personal details.
The placement of questions in a demographic survey directly influences completion rates. Early placement of personal and demographic questions might deter some respondents who are cautious about disclosing personal information right away, potentially decreasing completion rates.
Conversely, positioning these questions at the end might boost the initial engagement but still risks drop-offs at the final stages if the survey is lengthy.
Testing different placements of demographic questions can provide insights into how your specific audience interacts with your survey.
For instance, if preliminary tests show high drop-off rates with demographics at the start, it might be worth relocating these to the end or interspersing them subtly throughout the survey.
Experimenting with various survey flows can significantly refine data quality and participant response rates. Consider A/B testing with your surveys by creating two versions: one with demographic questions at the beginning and one at the end. Analyze the response rates, completion rates, and data quality from each version to determine which flow works best for your target audience.
Moreover, consider the complexity and sensitivity of the demographic questions. More sensitive questions might be better received after the respondent has developed a rhythm with less personal questions.
Continuous testing and adaptation of the survey flow, based on real data and respondent feedback, can lead to more effective surveys and richer, more reliable data collections.
Transparency is key in building trust in demographic surveys. Start by clearly explaining why each piece of demographic information is needed. Participants should understand how their data contributes to the research goals. This clarity can motivate them to provide accurate information.
It’s also important to disclose who has access to the data. Assure respondents that their information is handled confidentially. Explicit privacy statements can alleviate concerns about personal data misuse. These assurances are not just ethical; they are foundational to building participant trust.
Another effective strategy is to show how the demographic data leads to actionable insights. Provide examples of past surveys where demographic information was crucial in making informed decisions. This demonstrates the value of their participation, thereby enhancing trust and willingness to share honest information.
Social desirability bias can significantly distort survey results. This occurs when respondents answer questions in a way they think is favorable to others. To mitigate this, phrase questions to be direct yet non-judgmental. Neutral wording removes pressure to respond in a socially desirable manner.
Anonymity is another powerful tool against this bias. Assure respondents that their answers cannot be linked back to them. This can free them from the worry of judgment, leading to more accurate responses.
Additionally, consider using indirect questioning techniques. These can help in obtaining truthful answers, especially on sensitive topics.
Lastly, validate responses when possible. This can involve comparing answers across different groups or with known benchmarks. Validation helps in identifying and adjusting for potential biases, improving the reliability of your survey data.
Including a “Prefer Not to Answer” option can significantly boost response rates. This choice gives respondents control over the information they share. Feeling in control can reduce anxiety about answering sensitive questions, encouraging more participation.
Moreover, this option can improve the quality of data collected. It helps in distinguishing between those who choose not to answer a specific question and those who abandon the survey altogether. This clarification is crucial for accurate data analysis.
Finally, respect the choices respondents make. Analyze how frequently the “Prefer Not to Answer” option is chosen. High usage might indicate that certain questions are too intrusive or sensitive. This feedback can guide improvements in future surveys, making them more respectful and effective in gathering essential demographic information.
Balancing detail and user experience is crucial in demographic surveys. Detailed questions yield rich data but may overwhelm respondents. It’s important to design surveys that are both informative and pleasant to complete. This balance increases response rates and the accuracy of the data collected.
One approach is to use branching questions. This technique directs respondents to different follow-up questions based on their answers. It keeps the survey relevant to each participant and reduces unnecessary questions. This personalization helps maintain engagement without sacrificing the depth of information.
Furthermore, ensure questions are straightforward and easy to understand. Avoid technical jargon unless it is explained clearly. Simple, direct questions are less taxing on respondents, making the survey experience smoother. This approach respects the respondent’s time and boosts the likelihood of survey completion.
The ideal number of demographic questions varies by survey type. For short feedback forms, aim for three to five demographic questions. This number provides enough context about the respondents without causing fatigue. In more extensive research studies, you can include more demographic questions. However, keep them relevant and necessary.
In customer satisfaction surveys, limit demographic questions to those that directly impact customer experience. For example, age and location can be relevant, but marital status might not be. Tailoring the number of questions to the survey’s purpose is key to collecting useful data without burdening respondents.
Moreover, consider the mode of survey delivery. Online surveys can include slightly more questions because respondents can complete them at their convenience. However, in telephone or in-person surveys, keep the number of questions as low as possible to respect the respondent’s time and attention.
To prevent drop-off in lengthy surveys, start with engaging questions. Capture the respondent’s interest from the beginning. This strategy sets the tone for the survey and encourages completion. Also, clearly state the survey’s estimated completion time upfront. This transparency helps manage expectations and reduces drop-off rates.
Another effective strategy is to provide incentives for completing the survey. Whether it’s a small financial reward, a discount, or entry into a draw, incentives can significantly boost completion rates. Ensure the incentive is appropriate and appealing to the target demographic.
Progress indicators are also beneficial. They show respondents how much of the survey they have completed and how much remains. This visual aid helps participants gauge their progress, providing motivation to continue. Utilizing these strategies can greatly reduce the likelihood of drop-off, even in longer surveys.
Identifying trends in demographic data is crucial. It involves examining variations across age, gender, and income. This examination helps reveal consumer behavior patterns. These patterns assist in predicting future trends. Businesses can then tailor their strategies accordingly.
For instance, age-related data can show preferences for digital media. Younger demographics might prefer online platforms. Older groups might favor traditional media. Gender-related data offers insights into product preferences. Income data helps identify spending habits. Businesses use this information to define target markets.
By identifying these trends, companies optimize their resources. They focus on the most lucrative opportunities. This targeted approach not only saves time and money. It also increases the chances of success in various initiatives. Effective use of demographic data ensures that products and messages resonate well with the intended audience.
Cross-tabulation is a powerful tool in survey analysis. It allows for a deeper exploration of demographic data. This method compares multiple variables at once. It reveals complex relationships within the data. For instance, cross-tabulation can show how age and income impact product preferences.
This analysis helps businesses understand how different demographics intersect. It provides a nuanced view of consumer behavior. This detailed insight is vital for creating effective marketing strategies. It ensures that campaigns are not just wide-reaching but also deeply resonant.
Using cross-tabulation, companies can segment their audience more accurately. They can create highly targeted campaigns. These campaigns are more likely to engage and convert. In essence, cross-tabulation turns basic data into a strategic asset. It informs decision-making and helps tailor offerings to meet the unique needs of various demographic groups.
Finding patterns in demographic data is key to predicting customer behavior. This predictive analysis is invaluable. It informs product development and marketing strategies. It helps businesses anticipate needs and preferences.
For example, purchasing patterns can indicate when a customer might need a product upgrade. This insight allows companies to time their marketing messages effectively. Demographic patterns also reveal brand loyalty trends. They show which segments are most likely to recommend a brand to others.
Predictive analysis of demographic data uses historical data to forecast future behavior. It employs statistical techniques to identify likely outcomes. This foresight enables businesses to act proactively rather than reactively.
By understanding and anticipating customer behavior, companies enhance customer experiences. They also improve customer satisfaction and retention. This proactive approach is a cornerstone of successful business strategies in competitive markets.
Google Forms stands out as a prime choice for conducting demographic surveys. Its intuitive design allows even beginners to create surveys quickly. Users can select from various question types, such as multiple choice, checkboxes, or drop-down menus, making it versatile for gathering different kinds of demographic information.
The integration of Google Forms with other Google applications enhances its utility. For instance, users can easily share surveys via email or embed them on websites. This accessibility helps in reaching a broader audience effortlessly. Surveys can be customized to reflect brand colors and logos, ensuring consistency in professional settings.
One of the standout features of Google Forms is the ability to export survey results directly to Google Sheets. This integration simplifies the analysis of demographic survey data by allowing users to use Sheets’ powerful data manipulation tools. Sorting, filtering, and applying formulas becomes a breeze, providing deeper insights into the collected data.
For users looking to further analyze their data, Google Sheets supports add-ons like ChartExpo. This tool enhances Google Sheets’ capabilities, enabling you to create detailed visual analytics. Visual representations like charts and graphs can help in identifying demographic trends and patterns more effectively.
It is important to note that while Google Forms integrates seamlessly with Google Sheets, the ChartExpo add-on operates solely within Sheets.
Microsoft Forms is tailored for business environments where demographic data collection and analysis are crucial. It offers a secure platform that integrates smoothly with the Microsoft Office suite, enhancing its appeal to corporate users. Like Google Forms, Microsoft Forms allows users to create surveys with various question types, tailoring the data collection process to specific needs.
The platform supports collaboration, enabling multiple team members to work on the survey simultaneously. This feature is particularly useful in large organizations where team input is essential. Microsoft Forms also maintains a high level of data security, an important consideration for corporate users handling sensitive demographic information.
Microsoft Forms allows for the direct export of survey results to Excel. This feature is especially beneficial for users who require advanced data analysis capabilities. Excel’s robust tools enable detailed data manipulation and analysis, such as pivot tables and advanced statistical functions, which are crucial for in-depth demographic studies.
Furthermore, the integration with Excel supports the use of add-ins like ChartExpo. This tool provides extensive options for creating visual analytics, which can enhance the presentation and interpretation of demographic data. Charts and graphs generated by ChartExpo add clarity and impact to reports, making them more understandable and actionable.
However, it’s essential to recognize that while Microsoft Forms works seamlessly with Excel, the ChartExpo add-in is not supported directly on the Forms platform. Users need to first transfer their data to Excel to benefit from the sophisticated visual analytics offered by ChartExpo.
When creating demographic surveys, it’s vital to ask only relevant questions. Surveys filled with unnecessary queries can frustrate and drive away participants. This error not only reduces response rates but also skews the data quality.
For instance, asking for detailed financial information in a customer satisfaction survey may seem intrusive and irrelevant. It’s crucial to keep surveys concise and to the point, focusing solely on information that fulfills the survey’s objectives.
This approach respects the respondent’s time and privacy, increasing the likelihood of completion and accuracy.
Clarity in survey questions is non-negotiable. Vague language can lead to varied interpretations, affecting the reliability of the data collected.
For example, a question like, “Do you think you are financially stable?” can mean different things to different people. Instead, specify what “financially stable” means or break it down into measurable components like income brackets or financial security feelings.
Precise questions yield precise answers, which are crucial for actionable insights and reliable demographic analysis. It’s essential to frame questions that leave no room for ambiguity.
Inclusivity in demographic surveys is not just ethical; it’s practical. When survey questions fail to include a diverse range of options, it can alienate or misrepresent significant segments of the population.
For example, gender options should extend beyond the traditional male and female categories to include non-binary, prefer not to say, and other if necessary. This inclusivity ensures that all respondents feel recognized and valued, which can increase the accuracy and credibility of the data collected.
It is about respecting diverse identities and ensuring they are reflected in your data.
Demographic survey questions shape the way businesses and researchers understand people. They provide facts, not guesses. They help organizations make smarter decisions, improve products, and target the right audience.
Asking the right questions takes planning. Poorly structured surveys lead to weak data. Strong questions bring clarity. They collect accurate details about age, income, education, and more.
This information drives better marketing, product development, and service improvements.
Every response holds value. Patterns emerge. Trends become clear. Businesses gain insight. Researchers uncover new findings. The right questions lead to better results.
Data is only useful if it’s accurate. Right demographic survey questions make that possible.
How much did you enjoy this article?


Google Forms to Google Sheets keeps your data organized and current with every submission. Learn the steps, methods, and tips now!

Product survey questions reveal what customers truly think. Learn how to ask the right ones and act on the survey results. Read on!

Learn how the 5-Point Performance Rating Scale improves employee evaluations with clear, consistent, and fair performance reviews across teams.


