Categories
Ah, biased survey questions – the sneaky survey items that can skew survey results in a blink.


I know you have come across surveys plagued with biased questions. Such surveys often yield inaccurate results.
Imagine surveying the quality of food at a restaurant. You ask the participants, “Do you think the restaurant’s food is delicious and of high quality?” This question has a positive connotation, leading participants toward a positive response.
Also, assume you ask, “Do you think the restaurant’s food is of low quality?” The participants would lean towards a negative response. This is an example of a biased survey question.
Do you want to learn how to tell when a survey is leading you down a certain path?
Here, we’ll dive into the world of biased survey questions. Consequently, learn how to spot and avoid them like a pro.
So grab your detective hats, and let’s analyze some biased survey questions.
Definition: A biased survey question is worded in a way that influences the participant’s response. Biased survey questions can be intentional or unintentional. This depends on the researcher’s motives or how the question is framed.
What is the danger of biased questions?
Biased questions can result in inaccurate survey data, leading to incorrect conclusions and poor decision-making. To guarantee precise survey results, detecting and analyzing biased survey questions is inevitable.
As mentioned earlier, biased questions influence the respondents towards a particular answer. This can skew the results and contribute to inaccuracy.
The use of biased questions in a survey can result in imprecise outcomes. This results in squandering the time and resources invested in conducting the research.
You can compromise the credibility of the research if you use biased survey questions. As a result, the findings may not be viewed as trustworthy. This can lead to significant repercussions like loss of funding, reputational damage, and strained relationships with stakeholders.
Your reputation is at stake if you use biased survey questions. It can also harm the reputation of the organization sponsoring the research. Thus, resulting in far-fetched consequences, as we have discussed above.
Here are the five most common types of biased survey questions with examples:
Leading questions are worded in a way that influences the participant’s response.
Example:
“Do you agree that the new policy is beneficial for the company?”
This question is leading because it assumes that the policy is beneficial. Thus, leading the participant to agree with the statement.
Look for questions that suggest a particular answer or contain assumptions that could influence the response.
One way to fix leading questions is to rephrase them to remove any assumptions or suggestions.
For example, “Was the light green when you approached the intersection?”
You can rephrase it to read, “What color was the light when you approached the intersection?”
Another approach is to ask open-ended questions. This allows the respondent to provide their perspective without zero influence.
Vague questions are unclear and open to interpretation, leading to incorrect responses.
Example:
“How often do you exercise?”
The question lacks clarity as it does not mention the duration or the type of exercise.
Vague questions fail to clarify their purpose effectively.
To fix this, clarify the requirements by asking specific questions and avoiding ambiguous language. If that doesn’t help, break down the question into smaller parts and tackle them individually.
Double-barreled questions are two in one, leading to confusion and incorrect responses.
Example:
“Do you think the food is of high quality and affordable?”
This is a double-barreled question since it incorporates two independent questions. It assumes that the food is both inexpensive and of great quality.
Double-barreled questions attempt to ask multiple questions simultaneously.
To fix this, try to separate such questions into several questions, each focusing on a specific problem.
Another strategy is to identify the main question and remove any supplementary questions.
Absolute questions are worded to force the participant to choose one answer or another.
Example:
“Do you always order dessert after dinner?”
This question is absolute because it assumes the participant always orders dessert after dinner. Thus, they can only provide a yes or no answer.
Absolute questions use words like “always,” “never,” or “completely,” which make them sound extreme and absolute.
To fix absolute questions, try rephrasing them to be less extreme and more open-ended.
For example, “Do you always forget to turn off the lights?”
You can rephrase it to read, “How often do you forget to turn off the lights?”
This makes the question less absolute and more open to interpretation.
Acquiescence bias is when the participant agrees with the question regardless of its content.
Example:
“Do you agree that unicorns exist?”
Although the question is ludicrous, the respondent might not have experienced what is asked. Thus, they will be inclined to concur with the statement.
To fix such questions, use neutral language that does not encourage agreement or disagreement. Additionally, you can rephrase the question in a way that does not assume a particular stance. i.e., a way that allows for a more open-ended response.
In today’s world, data is king when it comes to decision-making. Surveys are one of the most popular methods used to gather data. However, survey questions can often be biased, leading to inaccurate results.
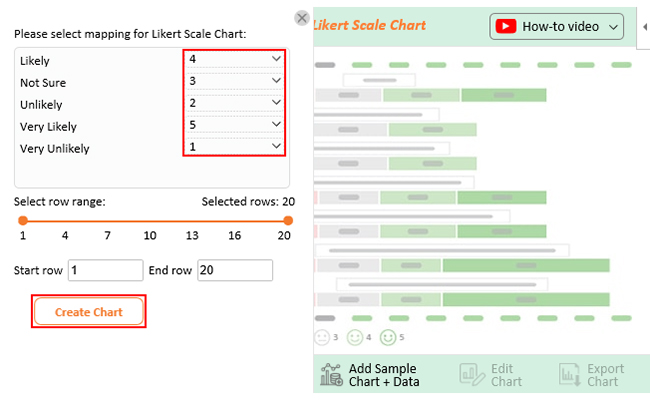
Identifying and analyzing any biases in survey data is essential to ensure informed decision-making. The good news is that analyzing survey data gets easier when you have Likert scale generator as a tool.
Excel is widely used for data analysis. With the ChartExpo for Excel add-in, you can easily detect and analyze bias in survey questions.
How to Install ChartExpo in Excel?
ChartExpo charts and graphs are available both in Google Sheets and Microsoft Excel. Please use the following CTA’s to install the tool of your choice and create beautiful data visualizations in a few clicks in your favorite tool.


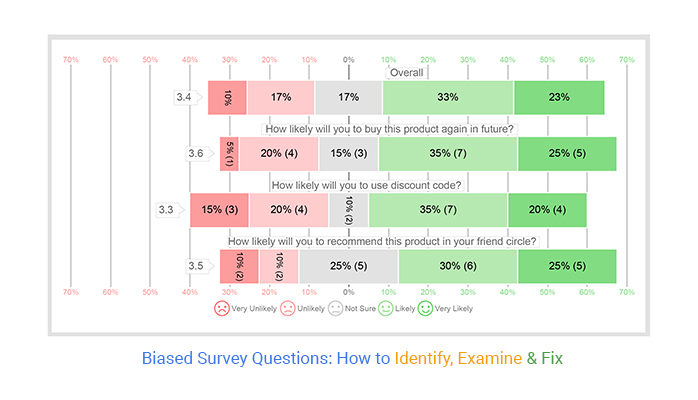
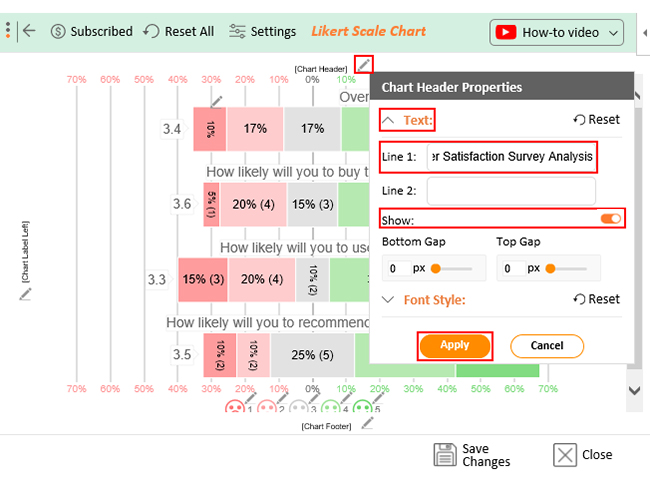
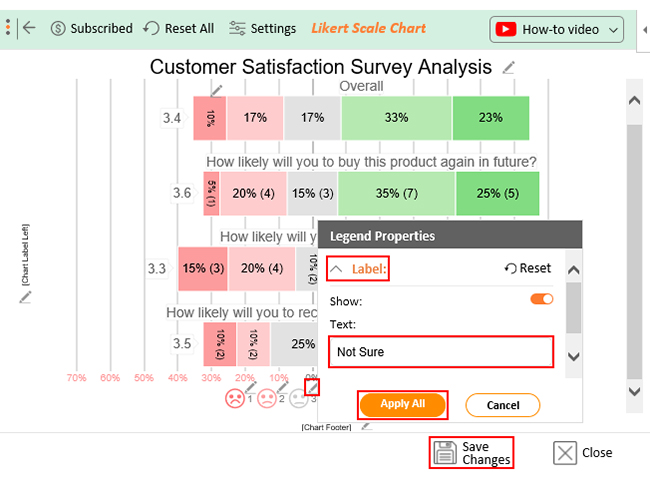
Assume you want to do a customer satisfaction survey with the following questions.
Respondents are to provide an answer to each question from the responses below.
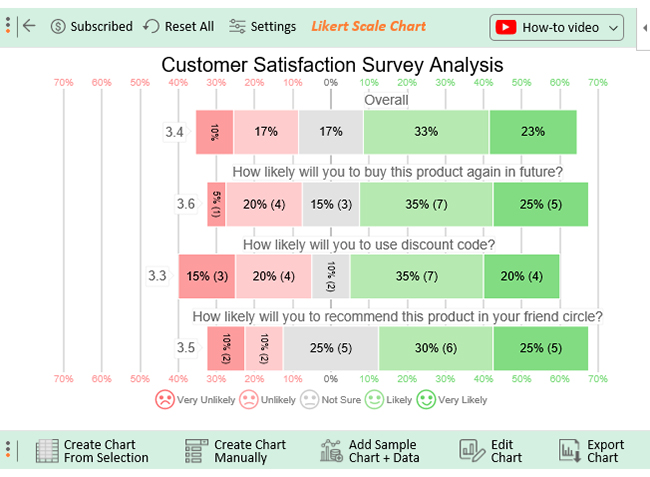
Let’s say you obtain the data below.
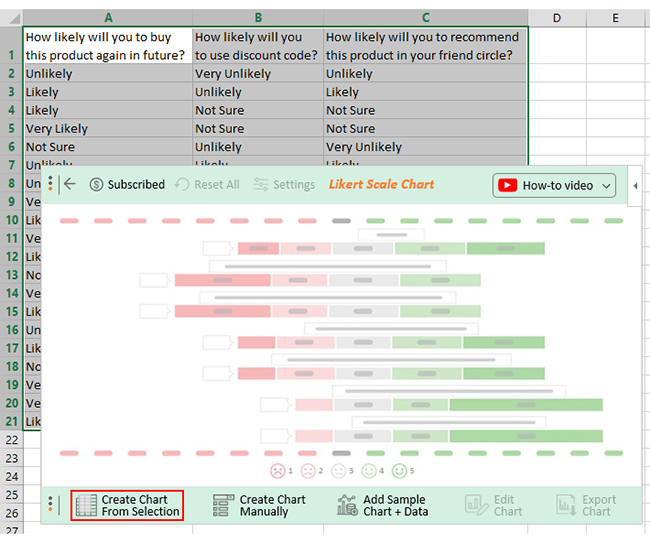
| How likely will you to buy this product again in future? | How likely will you to use discount code? | How likely will you to recommend this product in your friend circle? |
| Unlikely | Very Unlikely | Unlikely |
| Likely | Unlikely | Likely |
| Likely | Not Sure | Not Sure |
| Very Likely | Not Sure | Not Sure |
| Not Sure | Unlikely | Very Unlikely |
| Unlikely | Likely | Likely |
| Unlikely | Very Likely | Very Likely |
| Very Likely | Likely | Likely |
| Likely | Very Unlikely | Not Sure |
| Very Likely | Unlikely | Very Unlikely |
| Likely | Likely | Very Likely |
| Not Sure | Likely | Likely |
| Very Likely | Likely | Very Likely |
| Likely | Unlikely | Likely |
| Unlikely | Very Likely | Likely |
| Likely | Very Unlikely | Not Sure |
| Not Sure | Very Likely | Unlikely |
| Very Unlikely | Likely | Very Likely |
| Very Likely | Very Likely | Very Likely |
| Likely | Likely | Not Sure |


A biased leading question suggests or implies a particular answer or point of view. It influences the respondent to answer in a specific way in line with the questioner’s agenda or bias.
In a survey, bias means that the feedback given is influenced by certain factors. Such factors include the wording or format of the question or the selection of an unrepresentative sample.
To avoid biased survey questions, you can follow these best practices:
Biased survey questions can compromise the results, producing false findings and wrong conclusions. You are responsible for ensuring that your questions are impartial and truthfully represent the respondents’ viewpoints.
Biased survey questions have insidious ways of tricking you. It can be tempting to stick to the script when designing a survey. However, when you do so, you raise potential issues, including bias.
The good news is that there is a way to avoid biased survey questions. That is, by detecting and addressing them.
To identify biased surveys, here are some of the most common signs:
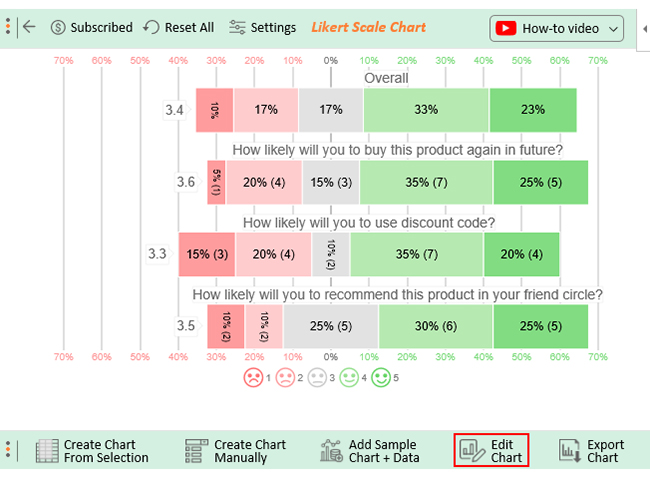
With the help of ChartExpo, it is possible to identify and analyze survey questions prone to bias. You can visualize the data and detect potential biases with the right chart type. Consequently, increase the survey’s accuracy, and keep your company’s reputation intact.
How much did you enjoy this article?


Google Forms to Google Sheets keeps your data organized and current with every submission. Learn the steps, methods, and tips now!

Product survey questions reveal what customers truly think. Learn how to ask the right ones and act on the survey results. Read on!

Learn how the 5-Point Performance Rating Scale improves employee evaluations with clear, consistent, and fair performance reviews across teams.


