Categories
Spreadsheet errors do not just waste time; they can corrupt entire datasets, skew reports, and lead to poor decisions. A single wrong entry in a shared workbook can ripple across formulas and summaries in ways that are hard to trace.
Data validation in Excel gives you a practical line of defense against these problems before they begin. By applying rules to cells, you can restrict inputs to specific types, ranges, or lists.
This keeps records clean whether you manage inventory, coordinate a team, or build financial models. The result is a spreadsheet that guides users toward correct entries at every step.
Definition: Data validation in Excel is a built-in feature that controls the type of information users can enter into a cell. Rules are defined at the cell level, so the spreadsheet itself rejects entries that fall outside the accepted range, format, or list of values. The core function is to preserve accuracy and keep data across the workbook uniform from the start.
This feature proves most useful in multi-user workbooks where different people contribute entries. A drop-down list, for example, limits a status field to options such as “Approved,” “Pending,” or “Rejected,” eliminating freeform text that breaks sorting and filtering.
Number limits, text length caps, and date ranges address other common failure points. By stopping bad data at the point of entry, these rules protect the integrity of every formula, report, and chart that depends on that information.
A data validation Excel list and other rule types act as a quality filter, blocking bad inputs before they reach your data and making every downstream calculation more dependable.
Core reasons to use validation include:
Knowing the mechanics of how this feature operates lets users configure rules with confidence and get reliable results from even complex datasets.
Fundamental aspects to understand include:
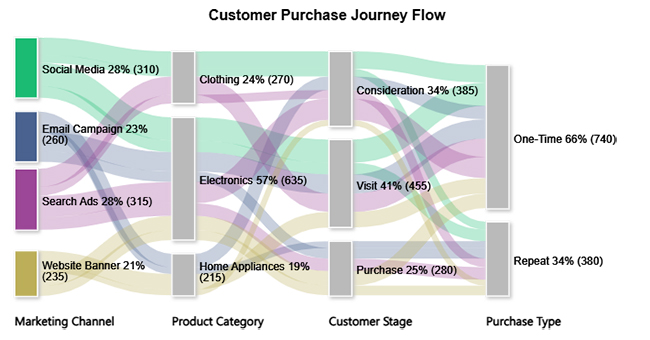
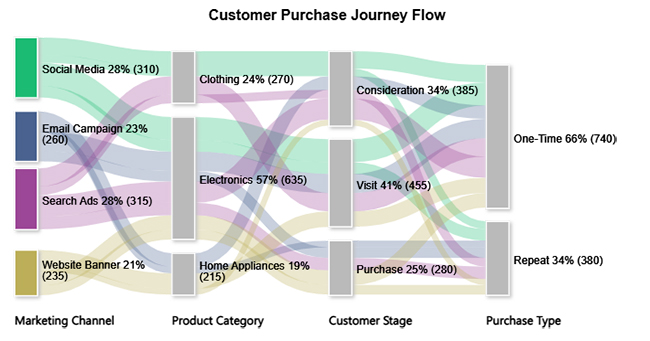
The Customer Purchase Journey Flow example shows how customers move from marketing channels through product categories and stages to final purchases.
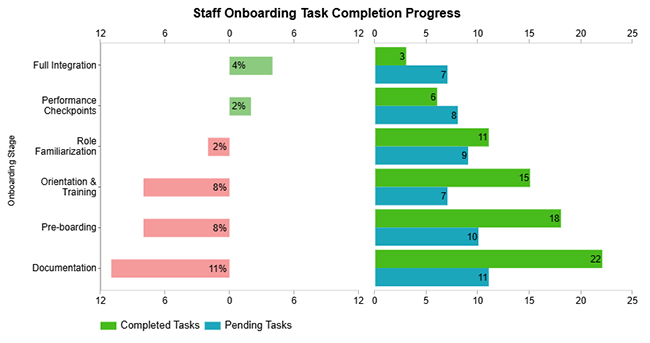
The Staff Onboarding Task Completion example shows completed and pending tasks across onboarding stages.
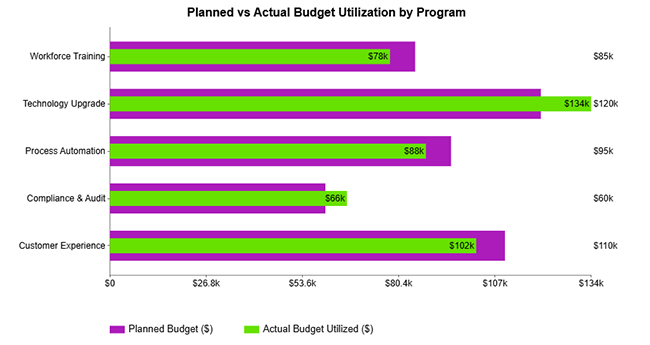
The planned vs actual budget utilization by program example compares allocated budgets with actual spending across programs to highlight over- or under-utilization.
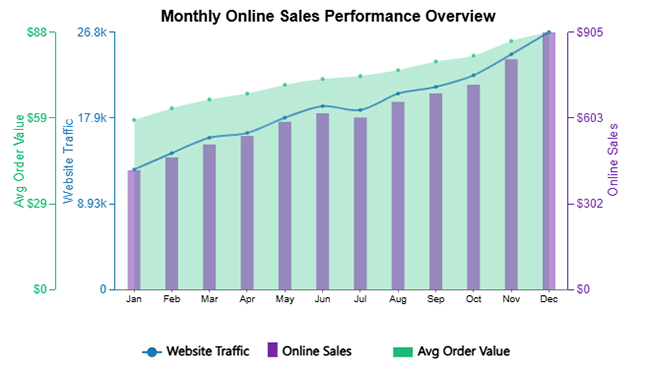
The monthly online sales performance overview example shows monthly trends in website traffic, online sales, and average order value.
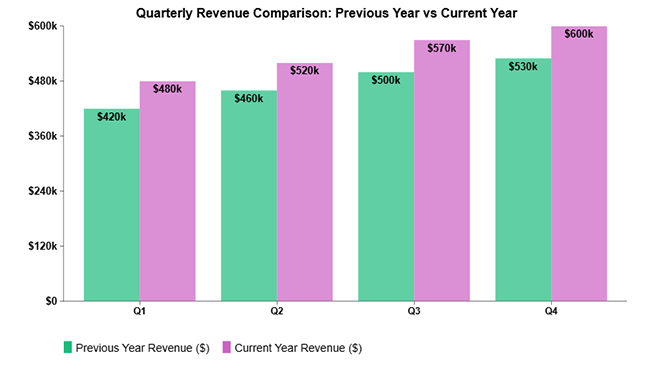
The quarterly revenue comparison example compares revenue performance across quarters to highlight year-over-year growth trends.
The process of setting up data validation in Excel takes only a few clicks. The steps below walk through each stage, from cell selection to rule configuration, so you can have working constraints in place quickly.
This also helps maintain clean datasets and reduces errors that could later appear as issues like box plot outliers when you analyze your data.
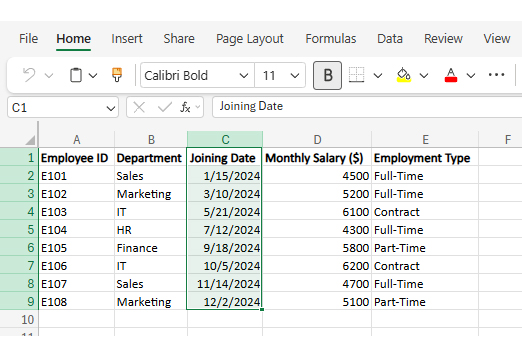
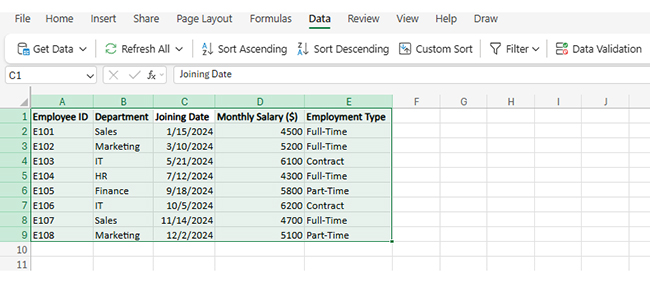
Highlight the cells where you want to apply validation rules. These could be individual cells or a full range.
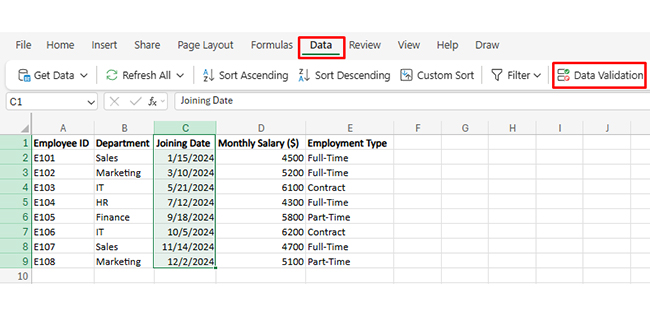
Navigate to the Data tab and click the Data Validation option to open the settings window.
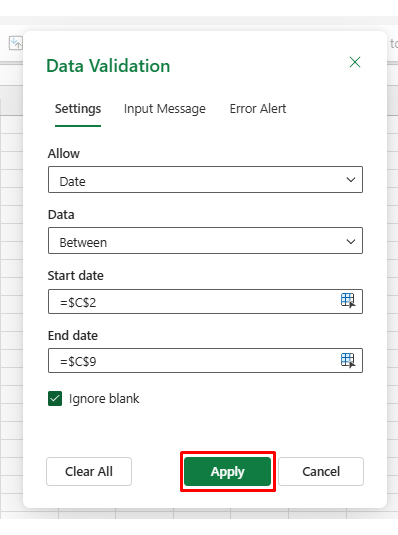
From the settings tab, select the rule type, such as number range, date, or data validation Excel list. This determines the allowed input values.
Enter predefined values separated by commas or reference a range of cells containing the list items.
Advanced validation can use formulas to control logical conditions. For example, ensuring a value must be greater than a related cell.
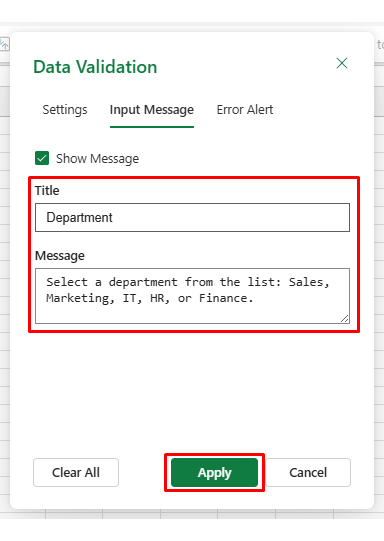
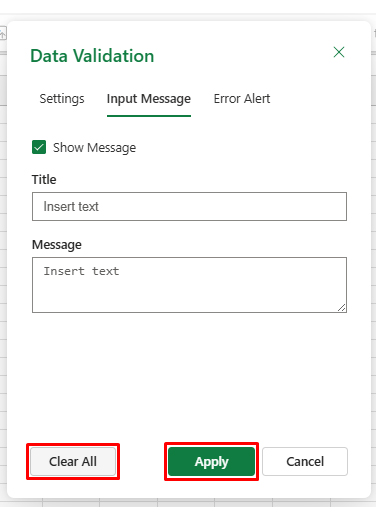
You can display a message explaining what type of data the user should enter.
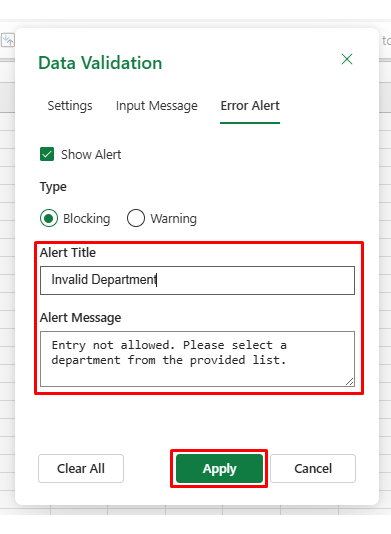
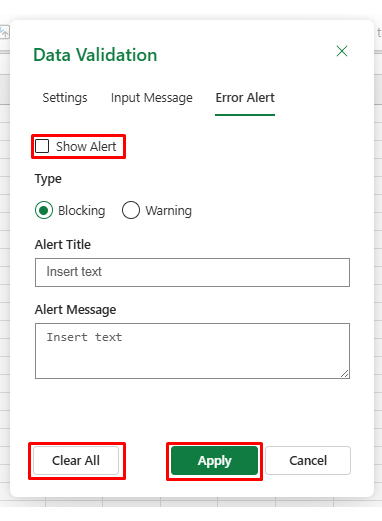
Error alerts notify users when they enter invalid data and prevent incorrect entries.
Validation rules can be applied across entire datasets, especially when performing grouping data in Excel to manage large tables.
Rules can be modified anytime to accommodate new conditions or changes in the dataset.
Using these steps ensures datasets remain organized and compatible with data analysis in Excel workflows.
Analyzing validated data in Excel ensures that your insights are accurate, consistent, and reliable.
Once your data has been verified using validation rules, you can confidently move forward with analysis, including visualizing uncertainty using a confidence interval graph in Excel for more precise insights. Follow these steps to gain meaningful insights:
Start by checking that all validation rules are correctly applied. Ensure entries follow the required formats, ranges, or lists so your dataset remains clean and error-free.
Arrange your validated data into a clear tabular format with proper headers. Group related fields together to make filtering, sorting, and analysis more efficient.
Use functions like SUM, COUNT, AVERAGE, and IF to summarize your validated data. These functions help you quickly evaluate totals, trends, and conditions within your dataset.
Apply filters to focus on specific segments and use Pivot Tables to break down data into meaningful summaries. This allows you to analyze patterns across categories without altering the original dataset.
Transform your data into charts such as bar charts, line graphs, or pie charts to better understand patterns. For more advanced and interactive visuals, you can use ChartExpo to simplify complex data visualization.
Examine your visuals to uncover patterns, relationships, and key insights. Focus on how different variables interact and where significant changes occur.
Include a final visualization, such as a flow-based chart, to illustrate how validated data moves across stages or categories.
For example, the image can show the journey from different sources to interactions and final outcomes, helping you clearly understand connections and overall data distribution.
Spreadsheets change over time, and rules that once made sense may become obstacles when a worksheet is restructured or repurposed. Clearing out old constraints lets cells accept whatever input the new workflow demands.
Follow these steps to clear validation settings from any cell or range.
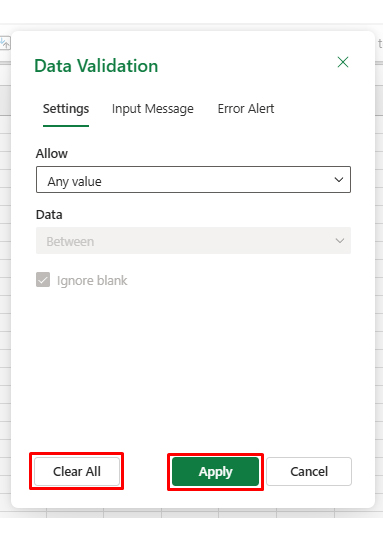
Select the cells containing validation rules. Go to the Data tab, click Data Validation, and press Clear All, then click Apply.
Press Ctrl + A to select the whole sheet. Open Data Validation and click Clear All to remove rules from all cells.
Open the Data Validation window, go to the Input Message tab, and uncheck the option that shows messages when a cell is selected.
Go to the Error Alert tab and uncheck the alert option to disable warning messages.
If rules are removed by mistake, press Ctrl + Z immediately to restore them.
Create a backup copy before removing validation rules.
Review validation settings regularly to maintain organized and reliable datasets.
Adding data validation in Excel to a workbook pays dividends across the entire spreadsheet lifecycle, from initial entry through final reporting. Key benefits include:
Excel data validation is a powerful tool, but it has known boundaries that affect how reliably it works in real-world environments. Understanding these gaps allows spreadsheet designers to plan around them.
Notable limitations include:
The three most widely used types are list validation, which restricts cells to a set of predefined options; numeric validation, which limits entries to numbers within a specified range; and date validation, which keeps date inputs within defined boundaries. Together, these cover the majority of real-world data entry scenarios.
Highlight the target cells, go to the Data tab, and select Data Validation. In the dialog, pick the rule type from the Allow menu and define the permitted values or range. Optionally, add an input message to prompt users and an error alert to notify them when an entry falls outside the rule.
The five standard checks are presence checks, which confirm a required field is not left empty; type checks, which verify the input matches the expected data type; range checks, which test whether a value falls within acceptable boundaries; format checks, which confirm the structure matches a defined pattern; and consistency checks, which cross-reference related fields to confirm the data aligns logically.
Data validation in Excel is one of the most practical steps you can take to protect the integrity of any workbook. By setting rules at the cell level, you stop problems at their source rather than correcting them after the fact. The result is a spreadsheet that teams can rely on for accurate reporting and analysis.
From drop-down lists to custom formulas, every rule type adds a layer of control that compounds across the workbook. Pairing clean, validated data with a charting tool lets those inputs drive sharper insights. Start with the sections most prone to error and expand from there.
How much did you enjoy this article?


Learn how to use sparklines in Excel to quickly visualize trends inside cells. Discover types, creation steps, customization, use cases, benefits, and best practices.

Learn what a confidence interval graph is, how to create it in Excel, and how to interpret results to make more reliable, data-driven decisions.

A correlation matrix in Excel helps identify relationships between variables. Learn how to create, read, and use it for effective data analysis.


