• Home
  • Tools dropdown img
    • Spreadsheet Charts

      • ChartExpo for Google Sheets
      • ChartExpo for Microsoft Excel
    • Power BI Charts

      • Power BI Custom Visuals by ChartExpo
    • Word Cloud

  • Charts dropdown img
    • Chart Category

      • Bar Charts
      • Circle Graphs
      • Column Charts
      • Combo Charts
      • Comparison Charts
      • Line Graphs
      • PPC Charts
      • Sentiment Analysis Charts
      • Survey Charts
    • Chart Type

      • Box and Whisker Plot
      • Clustered Bar Chart
      • Clustered Column Chart
      • Comparison Bar Chart
      • Control Chart
      • CSAT Survey Bar Chart
      • CSAT Survey Chart
      • Dot Plot Chart
      • Double Bar Graph
      • Funnel Chart
      • Gauge Chart
      • Likert Scale Chart
      • Matrix Chart
      • Multi Axis Line Chart
      • Overlapping Bar Chart
      • Pareto Chart
      • Radar Chart
      • Radial Bar Chart
      • Sankey Diagram
      • Scatter Plot Chart
      • Slope Chart
      • Sunburst Chart
      • Tornado Chart
      • Waterfall Chart
      • Word Cloud
    • Google Sheets
      Microsoft Excel
  • Services
  • Pricing
  • Contact us
  • Blog
  • Support dropdown img
      • Gallery
      • Videos
      • Contact us
      • FAQs
      • Resources
    • Please feel free to contact us

      atsupport@chartexpo.com

Categories
All Data Visualizations Data Analytics Surveys
Add-ons/
  • Google Sheets
  • Microsoft Excel
  • Power BI
All Data Visualizations Data Analytics Surveys
Add-ons
  • Google Sheets
  • Microsoft Excel
  • Power BI

We use cookies

This website uses cookies to provide better user experience and user's session management.
By continuing visiting this website you consent the use of these cookies.

Ok

ChartExpo Survey


Home > Blog > Microsoft Excel

How to Pull Data from Another Sheet in Excel Simplified

How do you pull data from another sheet in Excel?

Excel is a powerful tool for organizing and analyzing data. Yet, many people struggle with managing data across multiple sheets.

Imagine having sales records on one sheet and needing them for a report on another. Manually copying and pasting data takes time and increases the risk of errors.

How to Pull Data from Another Sheet in Excel

Learning how to pull data from another sheet in Excel solves problems efficiently. Functions like VLOOKUP, HLOOKUP, and INDEX-MATCH make this process seamless. Mastering these techniques can save hours and reduce mistakes.

Studies show that data errors cost companies millions annually. A simple formula can help you prevent such costly mishaps. Whether you’re handling budgets, inventory, or client data, the ability to link sheets is invaluable. It creates a dynamic workflow where updates in one sheet reflect instantly in another.

Excel’s versatility allows professionals across industries to streamline tasks. Accountants, marketers, and project managers all rely on it. Knowing how to pull data from another sheet in Excel sets you apart. It’s a skill that boosts productivity and demonstrates problem-solving ability. This guide will walk you through it step-by-step. Ultimately, you’ll tackle your next data project like a piece of cake.

Table of Contents:

  1. Understanding the Basics of Referencing in Excel
  2. What are the Methods for Pulling Data from Another Sheet in Excel?
  3. How to Pull Data from Another Sheet in Excel?
  4. Common Issues While Pulling Data from One Spreadsheet to Another
  5. How to Analyze Pull Data from Another Sheet in Excel?
  6. Wrap Up

First…

Understanding the Basics of Referencing in Excel

Referencing in Excel is a fundamental skill that simplifies data management and ensures accuracy. It allows you to link cells, ranges, or even external workbooks, so changes in one place update everywhere else.

There are three types: relative, absolute, and mixed references.

  • Relative references adjust when copied, making them ideal for repetitive tasks.
  • Absolute references lock specific cells with the $ symbol, ensuring consistency when constants are involved.
  • Mixed references combine both, offering flexibility in structured calculations.

You can reference data across sheets by including the sheet name in the formula (e.g., =Sheet2!A1). Or between workbooks by specifying file paths.

Named ranges further streamline referencing by replacing cell addresses with meaningful names. Excel also integrates references into functions like SUM, VLOOKUP, and INDEX-MATCH, enabling advanced data handling.

What are the Methods for Pulling Data from Another Sheet in Excel?

Excel is more than a spreadsheet; it’s a dynamic tool that connects and organizes your data. One of its standout abilities is pulling data from different sheets or workbooks. Let’s explore some practical methods that will save time and boost accuracy.

  • Cell References: Use =SheetName!CellAddress to link directly to a cell. For example, = Sheet2! A1 pulls data from A1 in Sheet 2, perfect for quick, straightforward connections.
  • VLOOKUP or INDEX/MATCH: VLOOKUP finds data in a table based on a key (e.g., =VLOOKUP(A2, Sheet2!A1:D10, 3, FALSE)). INDEX/MATCH offers more flexibility for advanced searches.
  • From Another Workbook: Reference cells in other files using =[WorkbookName.xlsx]SheetName!CellAddress. It links data across workbooks, even when the source is closed.
  • Power Query: For large or recurring tasks, Power Query extracts and transforms data from various sources. Access it through the Data tab for advanced automation.

How to Pull Data from Another Sheet in Excel?

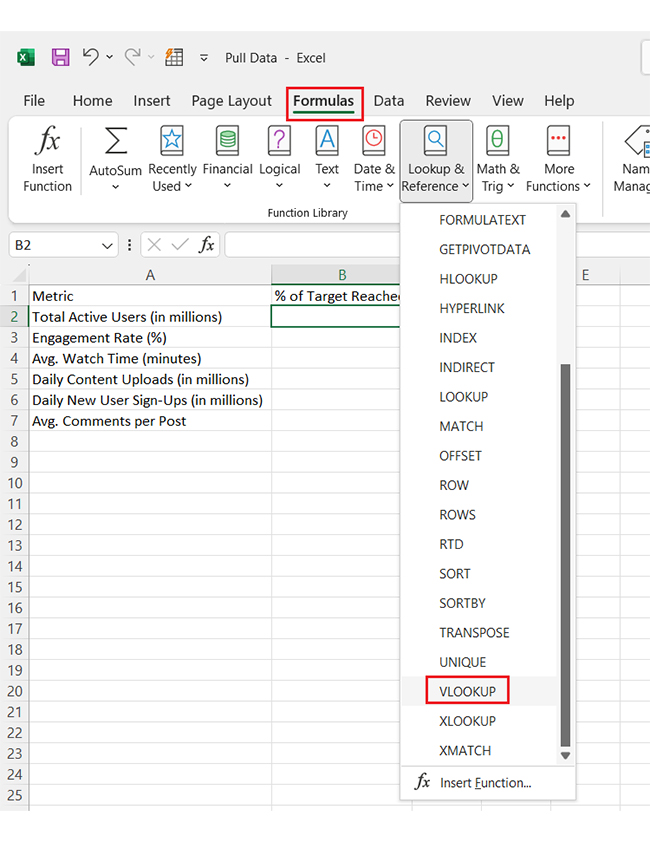
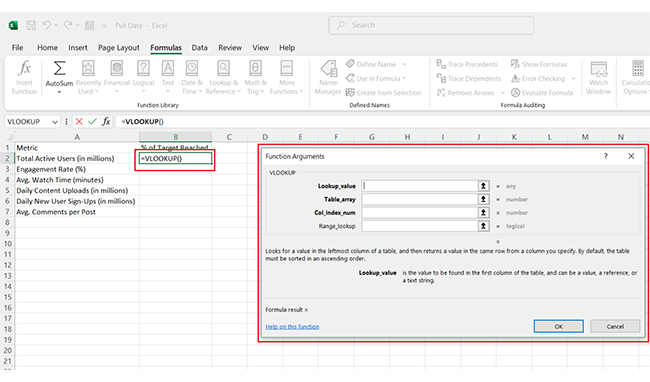
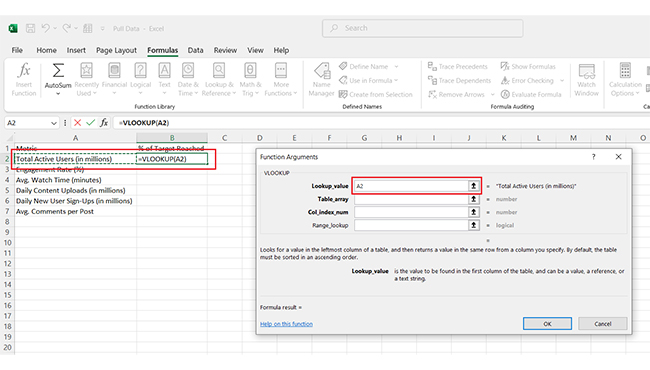
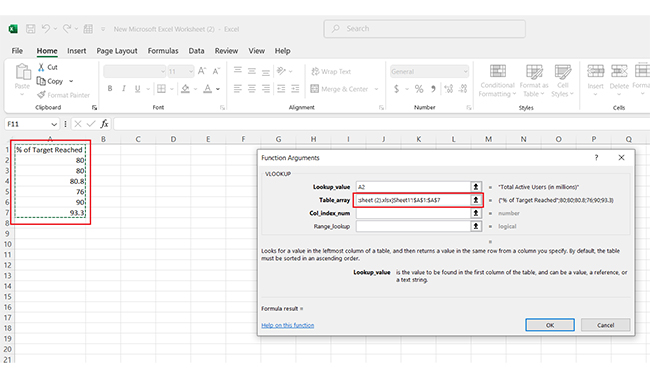
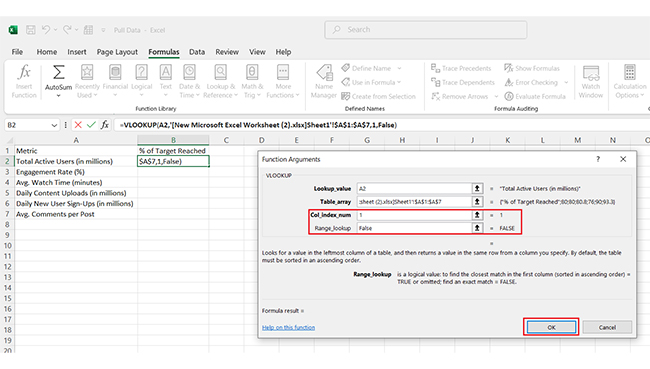
Working with Excel often means juggling data across multiple sheets. Wouldn’t it be great if you could pull that data into one place automatically? The good news is, you can—and it’s easy. Let’s walk through how to use the VLOOKUP function to pull data from another sheet step by step.

Step-by-Step Guide

  1. Start in your first sheet: Open your first spreadsheet and decide where the data from the other sheet will appear. In that cell, type the formula =VLOOKUP( to begin.
Formula VLOOKUP in Your Sheet for Learning How to Pull Data from Another Sheet in Excel
  1. A dialog box will appear. Fill in the required fields as follows:
Fill in Required Fields for Learning How to Pull Data from Another Sheet in Excel
  1. Select the cell in the first column to set as the “Lookup_Value”.
Select Cell in First Column to Set As Lookup Value for Learning How to Pull Data from Another Sheet in Excel
  1. Navigate to the other spreadsheet containing the data you want. Highlight the entire data range to define it as the “Table_array”.
Entire Data Range to Define It As Table_Array for Learning How to Pull Data from Another Sheet in Excel
  1. Return to the first sheet and specify the column number from the other sheet where your desired data is located. Enter this into the “Col_index_num” field.
  2. Complete the formula: Add FALSE for an exact match, then press Enter. Excel pulls the data from the other sheet instantly.
  3. Double-check with Excel’s fx tool: If you need more explanation, click the fx button, which explains each part of the formula.
Click fx button for Learning How to Pull Data from Another Sheet in Excel
  1. Finally, you’ll see the data from the secondary sheet seamlessly appear in your primary sheet.
Secondary Sheet Appear in Primary Sheet for Learning How to Pull Data from Another Sheet in Excel

Common Issues While Pulling Data from One Spreadsheet to Another

Pulling data from one spreadsheet to another can feel like magic—until it’s not. You set everything up, expecting a smooth transfer, and then error messages pop up, or worse, the wrong data sneaks through.

Frustrating, right? Let’s break down the most common issues that might trip you up and how to handle them like a pro.

  • Reference errors (e.g., #REF!): Your spreadsheet is lost when you see # REF!”. This usually happens if you delete a cell, row, or column on which your formula depends. Double-check that all referenced cells still exist.
  • Circular references: Ever feel like your formulas are chasing their tails? That’s a circular reference. It happens when a formula refers back to itself, either directly or indirectly. The fix? Rethink your formula logic and remove the loop.
  • Incorrect sheet names: Typos in sheet names are sneaky. If your formula includes something like Sheet2!A1, but the sheet is called “Sheet 2,” you’ll get an error. Check your naming carefully, especially for spaces or special characters.
  • File path issues (for External Workbooks): Are you linking data from another file? If the file gets moved or renamed, the path breaks. So, keep files in consistent locations or use cloud storage links to avoid this headache.
  • Data formatting mismatches: Numbers formatted as text, mismatched date formats, or stray spaces can throw formulas off. Use data cleansing techniques like Text to Columns or Trim to clean your data and ensure accuracy.
  • Volatile formulas: Some formulas, like NOW() or RAND(), recalculate every time you make a change. Overusing these can slow your spreadsheet down, especially with large datasets. Use them sparingly or replace them with static values when possible.

How to Analyze Pull Data from Another Sheet in Excel?

How do you analyze and pull data from another sheet in Excel without losing your mind? Data visualization.

Excel is great for crunching numbers, but its data visualization options can feel basic. Charts and graphs often look clunky and take forever to format. You can analyze your data, but what about presenting it?

Here is where ChartExpo steps in. This tool transforms raw data into stunning visuals in minutes. Whether you’re tracking sales trends or diving into customer behavior analytics, it bridges the gap where Excel falls short.

Data analysis is only as good as how you visualize it—and ChartExpo makes that effortless.

Let’s learn how to install ChartExpo in Excel.

  1. Open your Excel application.
  2. Open the worksheet and click the “Insert” menu.
  3. You’ll see the “My Apps” option.
  4. In the Office Add-ins window, click “Store” and search for ChartExpo on my Apps Store.
  5. Click the “Add” button to install ChartExpo in your Excel.

ChartExpo charts are available both in Google Sheets and Microsoft Excel. Please use the following CTAs to install the tool of your choice and create beautiful visualizations with a few clicks in your favorite tool.

Example

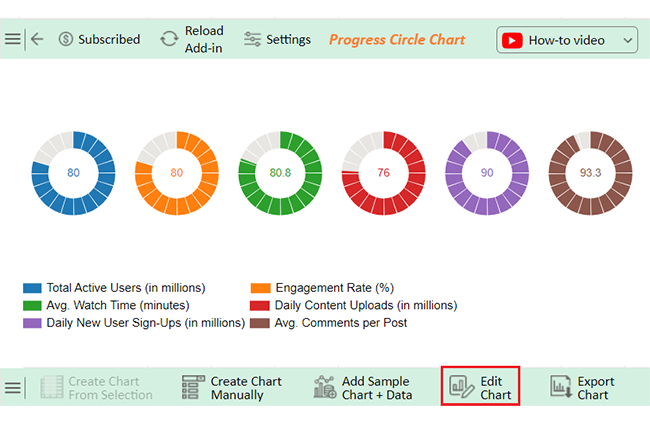
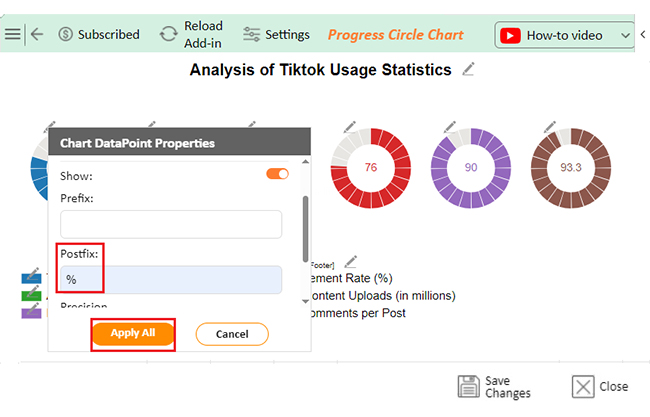
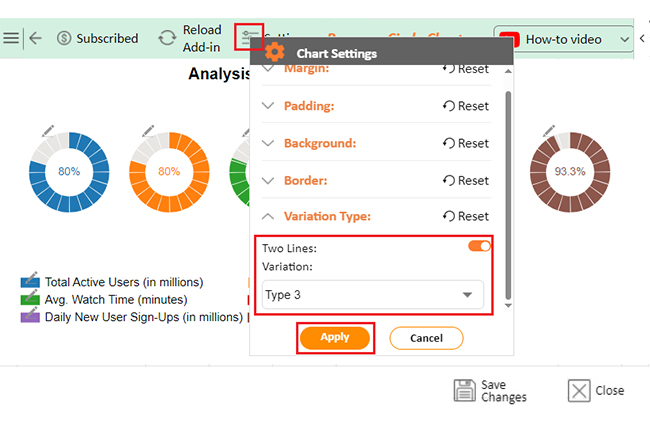
Let’s dive into analyzing and interpreting data with this sample in Excel using ChartExpo.
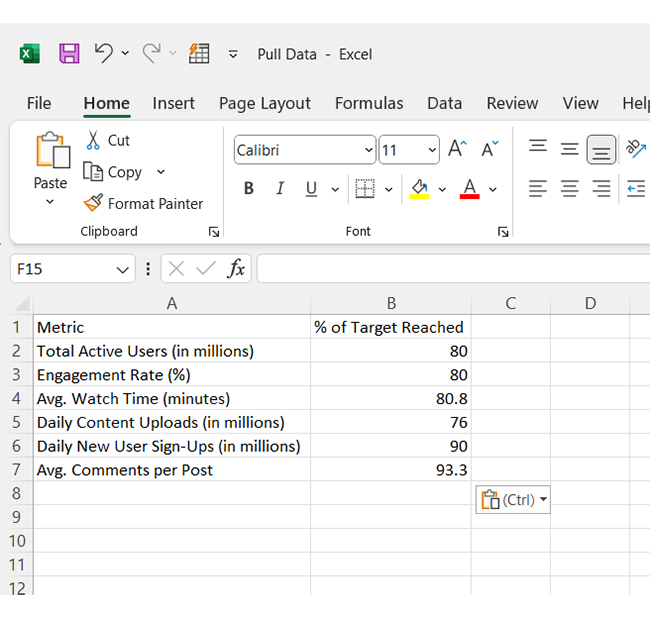
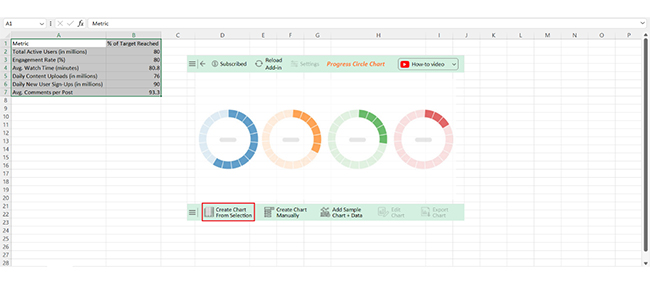
Metric % of Target Reached
Total Active Users (in millions) 80
Engagement Rate (%) 80
Avg. Watch Time (minutes) 80.8
Daily Content Uploads (in millions) 76
Daily New User Sign-Ups (in millions) 90
Avg. Comments per Post 93.3
  • To get started with ChartExpo, install ChartExpo in Excel.
  • Now Click on My Apps from the INSERT menu.
insert chartexpo in excel
  • Choose ChartExpo from My Apps, then click Insert.
open chartexpo in excel
  • Once it loads, scroll through the charts list to locate and choose the “Progress Circle Chart”.
Search Progress Circle Chart in Excel
  • You will see a Progress Circle Chart on the screen.
See Progress Circle Chart for Learning How to Pull Data from Another Sheet in Excel
  • Click the “Create Chart From Selection” button after selecting the data from the sheet, as shown.
Click Create Chart From Selection for Learning How to Pull Data from Another Sheet in Excel
  • ChartExpo will generate the visualization below for you.
Initial Visual for Learning How to Pull Data from Another Sheet in Excel
  • If you want to add anything to the chart, click the Edit Chart button:
  • Click the pencil icon next to the Chart Header to change the title.
  • It will open the properties dialog. Under the Text section, you can add a heading in Line 1 and enable Show.
  • Give the appropriate title of your chart and click the Apply button.
Add Chart Header for Learning How to Pull Data from Another Sheet in Excel
  • You can add the (%) with all values:
Add Postfix for Learning How to Pull Data from Another Sheet in Excel
  • You can click on Settings and change the variation type:
Click on Setting and Change Variation Type for Learning How to Pull Data from Another Sheet in Excel
  • Click the “Save Changes” button to persist the changes made to the chart.
Click Save Changes for Learning How to Pull Data from Another Sheet in Excel
  • Your final Progress Circle Chart will look like the one below.
Final How to Pull Data from Another Sheet in Excel

Insights

  • Strong overall performance: TikTok’s total active users and engagement rate reached 80% of their targets.
  • High interaction: Average comments per post performed exceptionally well, hitting 93.3% of the goal.
  • User growth leader: Daily new user sign-ups achieved 90% of the target, showcasing robust growth.

Building Interactive Charts by Pulling Data from Another Sheet in Microsoft Excel:

  1. Open your Excel Application.
  2. Install ChartExpo Add-in for Excel from Microsoft AppSource to create interactive visualizations.
  3. Select Progress Circle Chart from the list of charts.
  4. Select your data.
  5. Click on the “Create Chart from Selection” button.
  6. Customize your chart properties to add header, axis, legends, and other required information.

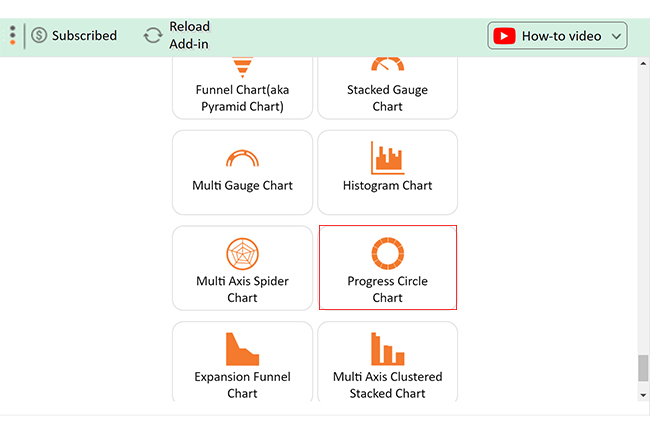
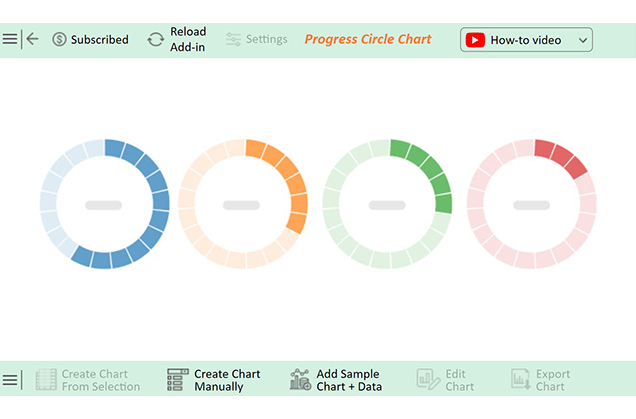
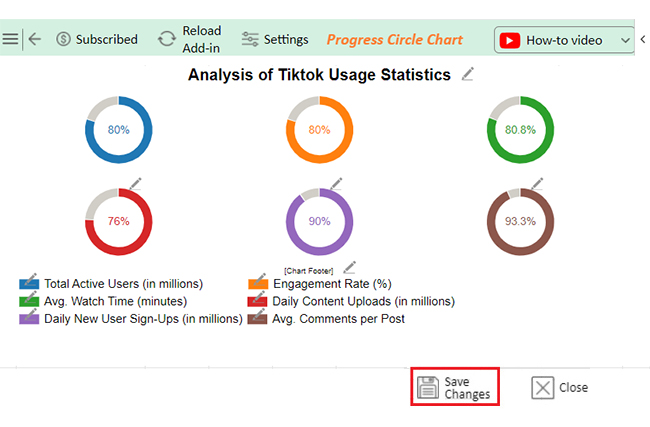
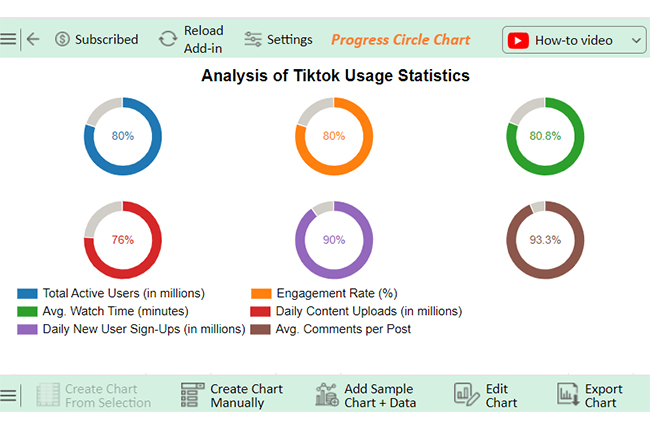
The following video will help you create a Progress Circle Chart in Microsoft Excel.

FAQs

How do you automatically pull data from another sheet in Excel?

To automatically pull data from another sheet in Excel, use formulas like =Sheetname, celladdress, VLOOKUP, or INDEX/MATCH. Power Query helps link and update data seamlessly across sheets for advanced needs.

How to pull matching data from another sheet in Excel?

Use the VLOOKUP, HLOOKUP, or INDEX-MATCH formulas to pull matching data. Point to the lookup value, data range, and column. For dynamic needs, try XLOOKUP. Ensure data consistency and correct references for smooth results.

Wrap Up

Pulling data from another sheet in Excel is a crucial skill. It simplifies tasks and improves accuracy. With the right methods, this process becomes quick and seamless.

Using cell references is the simplest way. It works well for basic connections. However,  VLOOKUP or INDEX/MATCH are better options for larger datasets.

These formulas allow you to search and retrieve data efficiently. They are ideal for dynamic reports and reduce manual work and errors.

Power Query is a powerful tool for more advanced needs. It handles complex tasks and connects multiple sources, making it perfect for recurring or large-scale data management.

Each method has strengths, so choosing the right one depends on your needs.

Do not hesitate. Start using these options today. By mastering these techniques, you can streamline workflows, and Excel will become a more valuable tool.

Start practicing with ChartExpo for Excel, and you’ll see the difference it makes!

How much did you enjoy this article?

ExcelAd1
Start Free Trial!
145559

Related articles

next previous
Microsoft Excel10 min read

Excel Bookkeeping for Small Business: Insights at a Glance

Excel bookkeeping for small businesses helps track income, expenses, and cash flow. Learn about templates and financial analysis to simplify bookkeeping.

Microsoft Excel10 min read

Compound Interest in Excel for Smarter Reporting

Discover compound interest in Excel and how it works. Learn its formulas, calculation tips, and common errors to avoid for more accurate financial analysis.

Microsoft Excel9 min read

KPI Dashboard in Excel: A Complete Guide

A KPI dashboard in Excel helps track key metrics and streamline data visualization. Discover how to create, analyze, and use it with clear guides and examples.

Microsoft Excel11 min read

How to Plot a Speedometer Chart in Excel?

Create a Speedometer Chart in Excel to track KPIs, goals, and performance metrics visually. Explore templates, examples, and step-by-step instructions for better dashboards.

Microsoft Excel13 min read

Excel for Teachers for Insightful Preparation

Excel for teachers simplifies grading, tracks attendance, and organizes data. Find its key features, expert tips, and how ChartExpo enhances data visualization.

ChartExpo logo

Turn Data into Visual
Stories

CHARTEXPO

  • Home
  • Gallery
  • Videos
  • Services
  • Pricing
  • Contact us
  • FAQs
  • Privacy policy
  • Terms of Service
  • Sitemap

TOOLS

  • ChartExpo for Google Sheets
  • ChartExpo for Microsoft Excel
  • Power BI Custom Visuals by ChartExpo
  • Word Cloud

CATEGORIES

  • Bar Charts
  • Circle Graphs
  • Column Charts
  • Combo Charts
  • Comparison Charts
  • Line Graphs
  • PPC Charts
  • Sentiment Analysis Charts
  • Survey Charts

TOP CHARTS

  • Sankey Diagram
  • Likert Scale Chart
  • Comparison Bar Chart
  • Pareto Chart
  • Funnel Chart
  • Gauge Chart
  • Radar Chart
  • Radial Bar Chart
  • Sunburst Chart
  • see more
  • Scatter Plot Chart
  • CSAT Survey Bar Chart
  • CSAT Survey Chart
  • Dot Plot Chart
  • Double Bar Graph
  • Matrix Chart
  • Multi Axis Line Chart
  • Overlapping Bar Chart
  • Control Chart
  • Slope Chart
  • Clustered Bar Chart
  • Clustered Column Chart
  • Box and Whisker Plot
  • Tornado Chart
  • Waterfall Chart
  • Word Cloud
  • see less

RESOURCES

  • Blog
  • Resources
  • YouTube
SIGN UP FOR UPDATES

We wouldn't dream of spamming you or selling your info.

© 2025 ChartExpo, all rights reserved.