• Home
  • Tools dropdown img
    • Spreadsheet Charts

      • ChartExpo for Google Sheets
      • ChartExpo for Microsoft Excel
    • Power BI Charts

      • Power BI Custom Visuals by ChartExpo
    • Word Cloud

  • Charts dropdown img
    • Chart Category

      • Bar Charts
      • Circle Graphs
      • Column Charts
      • Combo Charts
      • Comparison Charts
      • Line Graphs
      • PPC Charts
      • Sentiment Analysis Charts
      • Survey Charts
    • Chart Type

      • Box and Whisker Plot
      • Clustered Bar Chart
      • Clustered Column Chart
      • Comparison Bar Chart
      • Control Chart
      • CSAT Survey Bar Chart
      • CSAT Survey Chart
      • Dot Plot Chart
      • Double Bar Graph
      • Funnel Chart
      • Gauge Chart
      • Likert Scale Chart
      • Matrix Chart
      • Multi Axis Line Chart
      • Overlapping Bar Chart
      • Pareto Chart
      • Radar Chart
      • Radial Bar Chart
      • Sankey Diagram
      • Scatter Plot Chart
      • Slope Chart
      • Sunburst Chart
      • Tornado Chart
      • Waterfall Chart
      • Word Cloud
    • Google Sheets
      Microsoft Excel
  • Services
  • Pricing
  • Contact us
  • Blog
  • Support dropdown img
      • Gallery
      • Videos
      • Contact us
      • FAQs
      • Resources
    • Please feel free to contact us

      atsupport@chartexpo.com

Categories
All Data Visualizations Data Analytics Surveys
Add-ons/
  • Google Sheets
  • Microsoft Excel
  • Power BI
All Data Visualizations Data Analytics Surveys
Add-ons
  • Google Sheets
  • Microsoft Excel
  • Power BI

We use cookies

This website uses cookies to provide better user experience and user's session management.
By continuing visiting this website you consent the use of these cookies.

Ok

ChartExpo Survey


Home > Blog > Power BI

Unlocking Insights: An Overview of Data Dashboard Examples

Data dashboard examples provide a visual representation of complex datasets, offering a comprehensive and intuitive way for users to analyze and interpret information at a glance.

Data Dashboard Examples

In the realm of data visualization, a data dashboard serves as a centralized hub, presenting key metrics, trends, and insights in a visually appealing format. Organizations across various industries leverage data dashboards to enhance decision-making processes and monitor performance efficiently.

Data dashboards come in different forms to serve the needs of their users. For example, they can help in the identification of disease trends in health care. They can also help evaluate student performances in learning institutions.

In this article, we are going to go through some data dashboard examples. We begin by defining a dashboard. We are then going to delve into the benefits of using data dashboards.

We’ll learn about data dashboard types and how to choose the right dashboard tool. Eventually, explore how to create a dashboard in Power BI.

Table of Content:

  1. Dashboard: Overview
  2. Types of Data Dashboards
  3. How to Choose the Right Dashboard Tool?
  4. Visualizing a Dashboard in Power BI
  5. The Benefits of Using Data Dashboards
  6. Wrap Up

Data Dashboard: Overview

A Data Dashboard is a visual representation tool that consolidates and displays key performance indicators, metrics, and data points in a centralized interface, providing users with a comprehensive overview of relevant information.

Essentially, it acts as a dynamic and interactive hub, facilitating the monitoring and analysis of complex datasets, such as a web analytics dashboard example. Data dashboards serve as a powerful means to transform raw data into meaningful insights, allowing users to make informed decisions efficiently.

By exploring various Data dashboard examples, one can gain a deeper understanding of how these tools are employed across different domains to streamline information visualization, enhance data-driven decision-making, and foster a more intuitive approach to data analysis.

Types of Data Dashboards

There are different types of dashboards. The choice of a dashboard depends on the user’s needs.

Here are some data dashboard examples:

  • Operational Dashboards

Operational dashboards stand out as dynamic tools designed for real-time monitoring and decision-making. This exploration focuses on the role of operational dashboards in enhancing efficiency and productivity within diverse operational contexts.

By examining specific data dashboard examples, we gain insights into how operational dashboards facilitate quick and informed decision-making, providing a visual representation of key metrics and performance indicators essential for day-to-day operations.

  • Tactical Dashboards

Tactical dashboards emerge as strategic tools tailored for mid-level management, offering a focused lens into key performance indicators and actionable insights. This exploration centers on the significance of tactical dashboards in guiding strategic decisions and optimizing processes.

Through concrete data dashboard examples, we highlight how tactical dashboards enable managers to assess trends, identify opportunities, and conduct cost of living comparison by city, thereby making informed decisions that contribute to overall organizational goals.”

  • Statistical Dashboards

These types of dashboards provide advanced statistical analysis and data modeling. They use tools like regression analysis, hypothesis testing, and forecasting tools.

  • Strategic Dashboards

These dashboards are used to show trends in historical data. They determine whether a company is meeting its long-term goals and objectives. Executives use strategic dashboards to make decisions about the company’s future.

  • Analytical Dashboards

Data analysts and business intelligence experts utilize analytical dashboards to study and analyze data in depth. These dashboards enable users to manipulate data and create custom reports and visualizations.

  • Financial Dashboards

These are dashboards designed to display financial information such as revenue, expenses, profit margins, and financial ratios. Often, a finance dashboard in Power BI is utilized for comprehensive financial analysis and planning, providing a dynamic and interactive way to visualize and interpret financial data.

  • Marketing Dashboards

These dashboards monitor marketing performance, such as campaigns, new leads, new customers, conversion rates, and marketing costs. Marketing teams can determine the effectiveness of their strategies.

  • HR Dashboards

HR dashboards focus on employee metrics such as turnover, recruitment effectiveness, training, and development.

  • Healthcare Dashboards

These are used in the healthcare industry. They analyze patient outcomes, treatment effectiveness, healthcare analytics, and health facility performance.

How to Choose the Right Dashboard Tool?

The main aim of analysis is to summarize massive amounts of data. This is because insights can only be obtained if data is organized logically.

There are different dashboard tools for different data dashboard examples. Here are some factors to consider when choosing a dashboard tool:

  • Your goals and objectives
  • The users who will interact with the dashboard
  • Your budget for a data dashboard tool
  • Scalability
  • Capacity to integrate with your existing data sources and systems
  • Data security rules, and your organization’s data protection policies.
  • User interface and usability
  • The ability to generate multiple types of visualizations
  • The amount of data it can handle
  • Reviews and remarks from users who have used the tool before

Visualizing a Dashboard in Power BI

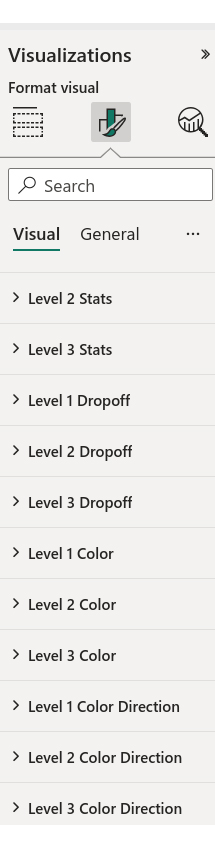
In this section, we further explore data dashboard examples. To do this, we learn how to create a dashboard in Power BI. We’ll use the Sankey Diagram (Sankey Chart) as a Power BI dashboard example.

Stage 1: Logging in to Power BI

  • Log in to Power BI.
  • Enter your email. Click the “Submit” button.
Enter email to login to Power BI
  • You are redirected to your Microsoft account.
  • Enter your password and click “Sign in”.
Enter Password to login to Power BI
  • Choose whether to stay signed in.
Click on stay signed in

Stage 2: Creating a Data Set and Selecting the Data Set to Use in Your Sankey Chart

  • Click on the “Create” option on the left-side menu.
  • Select ”Paste or manually enter data“.
select Paste or manually enter data in Power BI ce421
  • We’ll use the following car sales dataset in our data dashboard example.
Company Name Model Name Price Model Year Location
Toyota Vitz 2385000 2017 Islamabad
Toyota Corolla 111000 2019 KPK
Suzuki Alto 1530000 2019 KPK
Suzuki Alto 1650000 2019 Punjab
Toyota Corolla 1435000 2010 Islamabad
Honda Civic 3850000 2017 Punjab
Suzuki Wagon 1440000 2017 Punjab
Mitsubishi Mirage 1425000 2012 Punjab
Toyota Prado 2650000 1998 Punjab
Honda Civic 3350000 2017 Punjab
Honda Vezel 3200000 2014 Sindh
Honda City 1990000 2017 Punjab
Suzuki Cultus 920000 2012 Punjab
Toyota Corolla 2750000 2018 Punjab
Honda City 910000 2004 Punjab
Toyota Fortuner 8650000 2018 Punjab
Suzuki Wagon 1625000 2016 Punjab
Honda City 2100000 2016 Punjab
Toyota Vitz 965000 2001 Punjab
Suzuki Mehran 840000 2018 Punjab
Honda N 1485000 2012 Punjab
Suzuki Khyber 400000 2000 Punjab
  • Paste the above data table into the “Power Query” window.
Paste Data Into Power Query ce437
  • Select the “Create a dataset only” option as shown below.
Create Dataset in Power BI ce437
  • Click on the “Data Hub” option on the left-side menu.
  • Power BI populates the data set list. (If you have not created a data set, refer to the Error! Reference source not found section.)
  • The data details are shown below:
Click on Data Hub ce432
  • Click on the “Create a report” dropdown as shown below.
  • Select “Start from scratch.”
Create Report and start from scratch ce421
  • You should see the Report Canvas screen as shown below:
Report Canvas screen in Power BI ce426

Stage 3: Adding the Power BI Sankey Diagram Extension by ChartExpo

  • To finish creating our Sankey Diagram, we’ll use an add-in or Power BI visual from AppSource.
  • Navigate to the Power BI Visualizations panel.
  • Click the ellipsis (…) highlighted above to import the Power BI Sankey Diagram extension by ChartExpo.
click on to get more visuals ce426
  • The following menu opens:
  • Select the “Get more visuals” option.
  • The following window opens:
get more visuals in Power BI ce426
  • Enter “Sankey Diagram for Power BI by ChartExpo” in the highlighted search box.
  • You should see the “Sankey Diagram for Power BI by ChartExpo”, as shown in the image below.
Sankey Diagram for Power BI by ChartExpo
  • Click the highlighted “Add” button.
Click the Add button
  • Power BI will add the “Sankey Diagram for Power BI by ChartExpo” icon in the visualization panel.
Click on Sankey Diagram Icon

Stage 4: Drawing a Sankey Diagram with ChartExpo’s Power BI extension

  • Select the “Sankey Diagram for Power BI by ChartExpo” icon in the visualization panel.
  • The following window opens in the report section of your dashboard:
Report Section in Dashboard ce421
  • You can resize the visual as needed.
  • Go to the right-hand side of your Power BI dashboard.
Fields next to visualizations ce437
  • You’ll select the fields to use in your Sankey chart here.
  • The ChartExpo visual needs to be selected, though.
  • Select the fields in the following sequence:
    • Company name
    • Location
    • Model name
    • Model year
    • Price
Select fields for Sankey diagram ce437
  • You’ll be asked for a ChartExpo license key or email address.
enter email for ChartExpo license ce430

Stage 5: Activate your ChartExpo Trial or Apply a Subscription Key

  • Select the ChartExpo visual.
  • You should see three icons below “Build Visual” in the Visualizations panel.
Build visual panel in Power BI
  • Select the middle icon, “Format visual.”
  • The visual properties will be populated as shown below.
visual properties in Power BI
  • If you are a new user,
    • Type in your email under the section titled “Trial Mode”.
    • This should be the email address that you used to subscribe to the ChartExpo add-in. It is where your ChartExpo license key will be sent.
    • Ensure that your email address is valid.
    • Click “Enable Trial.” You’ll get a 7-day trial.
enter email id
  • You should receive a welcome email from ChartExpo.
  • The Sankey Diagram you create under the 7-day trial contains the ChartExpo watermark (see below).
Data Dashboard Examples 1
  • If you have obtained a license key:
    • Enter your license key in the “ChartExpo License Key” textbox in the “License Settings” section (see below).
    • Slide the toggle switch next to “Enable License” to “On“.
enter license key
  • To add colors, expand the “Level Colors” properties and select a color.
  • Do this to change the color of each node.
  • All changes are automatically saved.
coloring sankey diagram ce437
  • Automatically all changes will be saved.
Final Data Dashboard Examples

Insights

  • At level 1, Company Name, Suzuki had the highest number of car sales (31.84%). Honda had the second-highest number of cars sold, with a total of 31.83%. Mitsubishi had the fewest cars sold, with a total of 4.54%.
  • At level 2, Location, most of the cars were sold in Punjab (77.24%). KPK had the second-highest number of car sales (9.12%). Sindh had the fewest sales, accounting for 4.55% of the total sales.
  • At level 3, the Model Name, Corolla had the highest number of sales (13.65%). The city had the second-highest number of sales (13.63%). The Prado was the least sold car, accounting for 4.51% of the total sales.

The Benefits of Using Data Dashboards

There are many benefits to using dashboards. Here are some of them:

  • Centralized Information

Data dashboards combine data from various resources into a single view. It displays various types of related visual data reporting in one place. This enables users to identify key information at a glance. It saves time that would have been used to navigate several reports and systems.

  • Data Visualization

Data dashboards, as essential data visualization tools, employ visual elements such as charts, graphs, and tables to portray complex data. These visualizations make data more understandable, helping users quickly grasp insights and trends.

  • Real-time Insights

They provide real-time updates that allow users to monitor indicators and respond to changing patterns and trends.

  • Improved Decision Making

Dashboards provide a clear and up-to-date view of metrics and performance indicators. This enables users to make decisions based on the existing information.

  • Data Analysis

Users can engage with data, apply filters, and delve into details. Users can gain valuable insights without necessarily performing queries and reports.

  • Enhanced Communication

Different data dashboard examples provide a forum for users to interact, gain insights, and integrate their ideas. This ensures team collaboration as they work towards the same business goals.

  • Tracking goals

Dashboards are useful for monitoring progress toward goals and objectives. They enable users to set targets and monitor performance.

FAQs

What is an Example of a Good Dashboard?

A good dashboard is one that effectively delivers key information, insights, and analytics. It is also user-friendly and should help in decision-making.

A good dashboard should be clear, simple, relevant, and consistent. It can also

provide real-time data.

What is the Most Important Thing in a Dashboard?

The most important thing in a dashboard is clarity and effectiveness in conveying information and insights.

A well-designed dashboard should provide a clear and concise overview of data and key performance indicators (KPIs). This helps users make informed decisions or understand specific trends and patterns.

What are the Basics of Dashboards?

The fundamentals of dashboards include knowing their purpose, components, and design concepts. Some of these concepts are:

  • Its purpose and objectives
  • Data sources
  • Key performance indicators
  • Audience and user needs
  • Data visualization

Wrap Up

We have looked at data dashboard examples in detail. We began by defining a data dashboard. We then looked at the benefits of using data dashboards.

We learned about different types of dashboards and discussed some dashboard examples. We also examined how to go about choosing the right dashboard tool. We tackled some factors to take into consideration, like your goals and objectives.

Eventually, we explored how to create a dashboard in Power BI. We used the Sankey Diagram as a Power BI dashboard example.

This example of a dashboard guide should help you create relevant dashboards to give you the desired results.

How much did you enjoy this article?

PBIAd1
Start Free Trial!
129540

Related articles

next previous
Power BI12 min read

Power BI Group By Guide for Effective Data Insights

Learn how Power BI Group By helps you aggregate data, clarify trends, and create reports by grouping values to make large datasets manageable & insightful.

Power BI12 min read

How to Create Sankey Diagram in Microsoft Power BI?

Learn How to Create Sankey Diagram in Microsoft Power BI using Desktop & Web Service. What they are and how to use them effectively.

Power BI8 min read

Power BI Artificial Intelligence: Insights Using Visuals

Discover all there is to know about the Power BI artificial intelligence. You'll also discover how AI is used in Power BI, and how to use it for analysis and more.

Power BI9 min read

Budgeting in Healthcare: Use Visuals to Spot Budget Gaps

This guide helps you discover what budgeting in healthcare is. You'll also discover the factors that affect hospital budgets and types of budgeting in healthcare.

Power BI9 min read

Predictive Analytics in Power BI for Making Insightful Visuals

This guide shows you everything you need to know about Predictive Analytics in Power BI. It also shows you how it works, and how to interpret the results.

ChartExpo logo

Turn Data into Visual
Stories

CHARTEXPO

  • Home
  • Gallery
  • Videos
  • Services
  • Pricing
  • Contact us
  • FAQs
  • Privacy policy
  • Terms of Service
  • Sitemap

TOOLS

  • ChartExpo for Google Sheets
  • ChartExpo for Microsoft Excel
  • Power BI Custom Visuals by ChartExpo
  • Word Cloud

CATEGORIES

  • Bar Charts
  • Circle Graphs
  • Column Charts
  • Combo Charts
  • Comparison Charts
  • Line Graphs
  • PPC Charts
  • Sentiment Analysis Charts
  • Survey Charts

TOP CHARTS

  • Sankey Diagram
  • Likert Scale Chart
  • Comparison Bar Chart
  • Pareto Chart
  • Funnel Chart
  • Gauge Chart
  • Radar Chart
  • Radial Bar Chart
  • Sunburst Chart
  • see more
  • Scatter Plot Chart
  • CSAT Survey Bar Chart
  • CSAT Survey Chart
  • Dot Plot Chart
  • Double Bar Graph
  • Matrix Chart
  • Multi Axis Line Chart
  • Overlapping Bar Chart
  • Control Chart
  • Slope Chart
  • Clustered Bar Chart
  • Clustered Column Chart
  • Box and Whisker Plot
  • Tornado Chart
  • Waterfall Chart
  • Word Cloud
  • see less

RESOURCES

  • Blog
  • Resources
  • YouTube
SIGN UP FOR UPDATES

We wouldn't dream of spamming you or selling your info.

© 2025 ChartExpo, all rights reserved.