Categories
By ChartExpo Content Team
Customer profiling often promises clarity, but more often it creates confusion. Too many businesses slice their audience into countless segments, hoping more detail will bring more sales. But instead of results, they get stuck. Too many profiles. Too much data. No direction.
Now, think about this. What if all that effort isn’t helping, but hurting? Over-segmentation can waste time, money, and energy. Teams focus on minor details, missing what truly matters. Sales don’t rise. Customers don’t connect. And the business? It stalls.
Customer profiling doesn’t have to be a trap. When done right, it leads to growth. Start with the goal. Work backward. Focus on what drives revenue, not what looks good on paper. With clear profiles tied to real outcomes, businesses find the right customers and the right message. That’s when customer profiling becomes a tool for action, not confusion.
Businesses love segments. They slice and dice their customers into tiny groups. But too many segments can confuse more than clarify. It’s like having too many cooks in the kitchen.
Over-segmentation can lead to analysis paralysis. Instead of actionable insights, businesses drown in data. They focus on splitting hairs rather than seeing the big picture. The result? They miss out on valuable opportunities and see profits slip away.
Creating a customer persona can feel like writing fiction. Businesses build these avatars with good intentions. But they often lack the depth and accuracy needed for real-world application.
These fictional characters might look good on paper. Yet, they fail to capture the true needs and desires of actual customers. It’s like casting a shadow puppet show and expecting a standing ovation. Businesses end up spending money on ideas that don’t resonate with their audience.
Collecting data is easy. But turning numbers into insights is where many stumble. Businesses often have more data than they know what to do with. It’s like having a library full of books but no idea what to read.
Without clear direction, data becomes a distraction. Companies chase trends, follow false leads, and miss the real story. The result? They make decisions based on illusions rather than facts. This lack of purpose costs time, money, and competitive edge.
Customer profiling sharpens marketing, boosts retention, and supports smart growth. It links efforts to results and helps predict buyer actions. Yet, the risks are real. Wrong data, rigid plans, and missed markets can cause loss. Success lies in balance.
| Factor | Benefit | Risk |
| Marketing Accuracy | Targets the right audience | Too narrow focus on segments |
| Customer Satisfaction | Delivers relevant offers | Misses diverse customer needs |
| Product Fit | Matches products to real needs | Overlooks niche markets |
| Resource Use | Cuts waste and saves time | Costly setup and upkeep |
| Sales Growth | Focuses on high-value buyers | Ignores potential new buyers |
| Retention | Keeps loyal customers engaged | Fails to spot unhappy users |
| Decision Speed | Speeds up responses to trends | Relies too much on past data |
| Business Alignment | Connects efforts to goals | May lead to rigid planning |
| Strategic Planning | Guides long-term moves | Wrong data skews strategy |
| Behavior Prediction | Forecasts what customers will do | Assumes all actions are predictable |


(Not Vanity Metrics)
Start with the end in mind. Reverse outcome mapping flips the usual profiling process on its head. Instead of beginning with data collection, you begin with revenue goals. What sales targets do you want to hit? What kind of growth are you aiming for? These answers will guide the type of customers you need to target.
Picture this: instead of casting a wide net, you’re setting a precise course. By knowing the destination, you identify the most valuable customer segments. This approach saves time and resources, focusing efforts where they matter most. It’s about working smarter, not harder.
The 3P Profiling Filter (Purpose, Precision, Payoff ) revolutionizes how businesses view customer data. Purpose defines why you’re gathering information. It’s not data for data’s sake but for achieving specific business goals. Precision ensures accuracy in the data you collect. Without it, profiles become unreliable and misleading.
Payoff is where the rubber meets the road. It’s about translating profiles into actionable strategies that boost revenue. Each of the 3Ps works together to create a robust profiling process. Following this standard simplifies decision-making and aligns it with business objectives.
Say goodbye to one-size-fits-all approaches. Successful businesses recognize three key customer profiles: high-value, loyal, and at-risk customers. High-value customers are those who bring in the most revenue. They’re your bread and butter, deserving special attention.
Loyal customers are the backbone of any business. They return time and again, often becoming brand advocates. At-risk customers, on the other hand, show signs of leaving. Identifying and addressing their pain points can turn them into loyal patrons. Each profile demands a tailored approach to maximize lifetime value.
A SaaS company faced challenges with customer retention. Traditional profiling methods were too slow and inefficient. They adopted a new strategy focused on the 3P Profiling Filter (Purpose, Precision, Payoff). By aligning profiles with revenue goals, they identified key customer segments faster.
The results were staggering. Profiling time was slashed by 60%, freeing up resources for strategic initiatives. More importantly, retention rates jumped by 40%. Customers felt understood and valued, leading to increased loyalty and revenue growth. This case study shows the power of focused profiling.
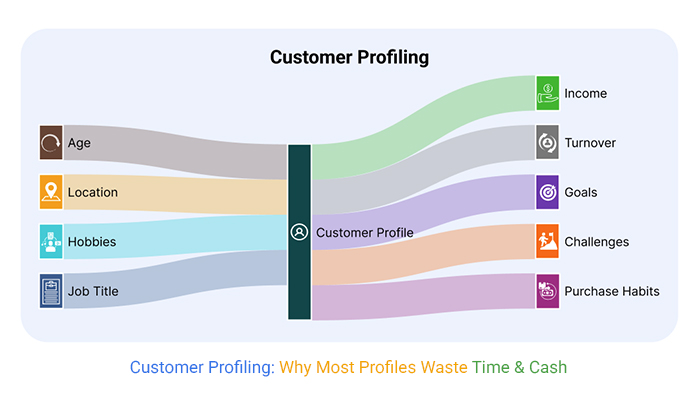
Visual tools like Sankey diagrams offer a clear view of data flow. In customer profiling, they illustrate how profiles translate to revenue. Each line shows the journey from understanding customer needs to achieving financial goals. It’s a way to see the big picture at a glance.
Businesses can use these diagrams to spot inefficiencies and opportunities. They show how different profiles contribute to overall success. By focusing on visual storytelling, companies align teams and strategies with ease. It’s not just about numbers; it’s about seeing how those numbers lead to growth.
Picture a trusty old hammer. It may not be fancy, but it gets the job done. Excel is the hammer of data tools for small teams. It’s reliable, easy to use, and surprisingly powerful. You don’t need a costly software suite when you can pivot, filter, and chart your way to insights with Excel.
With Excel, you can manage data without needing a tech department. It’s like having a multi-purpose toolkit at your fingertips. You can customize it to fit your needs, whether you’re tracking customer behavior or analyzing trends. Small teams thrive with Excel because it’s familiar and flexible. You get the power of data analysis without a steep learning curve.
Ever try to bake without a recipe? It’s chaos. Templates are your recipe in the world of data. They give structure and speed to your profiling efforts. Imagine spending just ten minutes and having a clear snapshot of your clients. That’s the magic of a well-designed template.
Templates take the guesswork out of data entry. They guide you through the process, ensuring you don’t miss crucial details. Whether you’re capturing demographics or purchasing habits, templates streamline the process, making it efficient and reliable. They save time and reducing errors.
Think of a chef in a crowded kitchen. Too many tools can slow you down. The same goes for tech. More isn’t always better. A focused, three-tool stack can be more effective than a dozen gadgets. You need tools that work well together, like a well-oiled machine.
With fewer tools, you spend less time switching between platforms and more time analyzing. Each tool in your stack should have a clear purpose. This approach keeps your workflow smooth and efficient. You’ll find insights faster without the clutter of unnecessary tech.
Imagine comparing apples to oranges. It’s confusing. A clustered column chart lets you compare tools side by side. It shows you which tools offer the best speed and return on investment. You can see at a glance which tools give you the most bang for your buck.
These charts highlight performance differences clearly. You can spot trends and make informed decisions. It’s a straightforward way to evaluate your options without getting lost in data. With this approach, you choose tools that enhance your workflow and boost efficiency.
Choosing the right tools for customer profiling can make or break your success. Look for tools that are easy, fast, and safe. Avoid ones that are hard to use, costly, or slow. Good tools support growth and fit with your systems. Smart picks save time and boost results.
| Factor | Do | Don’t |
| Ease of Use | Pick tools your team can use easily | Avoid tools with steep learning curves |
| Cost | Choose tools that fit your budget | Don’t overspend on features you don’t need |
| Scalability | Select tools that grow with your needs | Skip tools that can’t scale up |
| Integration | Use tools that link with your current systems | Don’t use tools that don’t connect well |
| Data Accuracy | Make sure the tool pulls correct data | Avoid tools with unreliable data |
| Support | Go for tools with strong user support | Don’t pick tools with poor help options |
| Customization | Pick tools you can tweak to your needs | Avoid rigid tools with no flexibility |
| Speed | Use tools that deliver results fast | Don’t use slow or lagging tools |
| Security | Check if the tool protects your data | Avoid tools with weak security |
| Reporting | Choose tools that give clear insights | Don’t use tools with vague reports |
(Not Demographics)
Let’s face it, traditional demographic labels are like old maps that don’t show the whole journey. They might tell you where someone lives or their age, but they miss out on the real heartbeat of human behavior. People aren’t just numbers or categories; they’re living, breathing individuals with unique motivations. A zip code or age bracket can’t capture their dynamism.
Consider how two people of the same age and income might have wildly different shopping habits. One might splurge on the latest gadgets, while the other saves for travel adventures. Labels can’t capture these nuances. Instead, we need to focus on what people do, not just who they are on paper. This shift opens doors to more effective strategies, where understanding actions takes center stage.
Actions speak louder than words. That’s the mantra for behavioral targeting. While surveys and feedback forms have their place, they often miss the mark. What people say they like can differ from what they actually do. By observing behaviors, we can paint a clearer picture of what truly drives them.
Imagine a shopper who browses eco-friendly products but buys regular ones. Their actions suggest an interest in sustainability that hasn’t translated into practice, yet. By tracking these patterns, businesses can gently nudge them towards greener choices. It’s about crafting a narrative from actions, not just words, and using that story to guide future interactions.
Feedback is gold, but only if mined correctly. Surveys often capture intentions, not actions. They’re like asking someone if they like exercise while they’re lounging on the couch. To get to the heart of the matter, focus on the story behind the numbers. Look for patterns and inconsistencies in responses.
For instance, a customer might rave about a product’s features but rarely purchase it. This discrepancy can be telling. Maybe the price point is too high, or the product doesn’t fit into their daily life. By digging deeper, businesses can refine their approach, tailoring offerings to better meet real needs. It’s about reading between the lines and using those insights to drive meaningful change.
A retail brand decided to shake things up. They tossed aside demographic data and focused on behavioral patterns. Instead of targeting “30-somethings,” they honed in on product interactions. The result? A 40% spike in sales. Customers felt seen and understood, responding with enthusiasm.
By observing browsing habits and purchase triggers, the brand created personalized experiences. They noticed a pattern: certain items paired well together, leading to higher sales. By promoting these combinations, they captured more attention and wallets. This approach proved that understanding behavior is a powerful tool in the retail playbook.
Imagine a funnel chart, not just as a visual, but as a dynamic flow of customer actions. Each stage in the funnel reveals critical insights into how close a customer is to making a purchase. By visualizing these behaviors, businesses can better understand the journey without forcing it—guiding instead of pushing.
Consider the steps: a customer might visit a product page several times before adding it to their cart, or they might read through reviews before deciding to buy. These actions aren’t random—they’re signals of intent.
A funnel chart helps map out these behaviors, allowing businesses to fine-tune their approach and deliver the right message at just the right moment. It’s about knowing when to gently nudge, helping customers move naturally toward the purchase.
Customer profiling works best when it stays focused, simple, and updated. Good data, clear goals, and teamwork lead to strong profiles. But too much detail, old data, or guessing can fail fast. Keep profiles fresh and aligned with real customer actions for real success.
| Factor | What Works | What Doesn’t Work |
| Segmentation Strategy | Simple, outcome-driven segments | Over-detailed or too many segments |
| Data Collection | Accurate, real-time data | Outdated or scattered data |
| Profile Depth | Clear, goal-based profiles | Profiles with too much guesswork |
| Focus on Outcomes | Aligning profiles with sales targets | Focusing on vanity metrics |
| Tool Choice | Easy, cost-effective tools | Complex or overpriced tools |
| Team Involvement | Cross-team collaboration | Working in silos |
| Customer Feedback | Using feedback to refine profiles | Ignoring customer input |
| Behavior Tracking | Watching real actions, not guesses | Relying on surveys alone |
| Profile Updates | Regular updates to keep profiles fresh | Letting profiles go stale |
| Privacy Handling | Respecting customer privacy rules | Ignoring data protection laws |
Once upon a time, a retail brand was floundering. Sales were stagnant, and the future looked bleak. They realized their Ideal Customer Profile (ICP) was off. Instead of lamenting, they regrouped. They revisited their data, spoke to customers, and crafted a new profile. Suddenly, things changed. Their stores buzzed with activity, and online orders soared.
In a year, they saw a 25% increase in revenue. Talk about a turnaround! They didn’t just tweak their strategy. They listened, learned, and shifted their focus. By aligning their offerings with what their customers truly wanted, they transformed a struggling business into a thriving one. The moral? Know your audience, and the rewards can be substantial.
Not all stories have happy endings. Some campaigns crash and burn. Why? Bad segmentation decisions. Imagine targeting a luxury watch to college students. Or promoting vegan products to steak lovers. Mismatched messaging can be disastrous. It’s like trying to fit a square peg in a round hole.
These blunders are costly. Companies waste resources on ads that don’t convert. Worse, they risk alienating potential customers. A smart strategy focuses on accurate segmentation. It’s not about casting a wide net but about targeting the right fish. Missteps happen, but learning from them is the key to future success.
So, you’ve got a profiling strategy, but it’s not working. What now? Sometimes, it’s best to scrap it and start fresh. Clinging to a broken strategy is like carrying dead weight. It drags everything down. But how do you know when to let go? Look for signs. Declining sales, poor engagement, and negative feedback are red flags.
Yet, not all is lost. Sometimes, a strategy needs trimming, not trashing. Tweak it, test it, and see if it improves. If it doesn’t, don’t be afraid to cut your losses. Knowing when to pivot can save time and money. It’s about making smart choices and being open to change.
A FinTech firm found themselves in a pickle. They were bleeding money, and something had to give. Their target audience felt broad and unfocused. So, they shifted gears. They moved to an outcome-based ICP. Instead of covering all bases, they honed in on what their customers truly needed.
This pivot was their saving grace. Losses turned into profits. They saw a clear path forward, guided by the needs and outcomes of their clients. It’s a testament to the power of knowing your customer. Focusing on outcomes, rather than just features, can steer a company back on track.
Imagine you’re looking at a horizontal waterfall chart. It’s a tale of peaks and valleys. Each bar tells a story of profit or loss. A right ICP can propel profits upward, while a wrong one sends them plummeting. The visual is stark. It shows how every decision impacts the bottom line.
Errors in profiling lead to losses. But, every mistake is a learning opportunity. The chart is a reminder. It’s not just about what went wrong, but how to improve. With each bar, there’s a lesson. Learn it, and the next campaign could be your best yet.
Vanity segments are like shiny objects that look great but don’t do much. They seem impressive at first glance, filled with colorful charts and trendy terms. However, they often fail to connect with the audience in a meaningful way. Businesses might create these profiles to show off their data skills but end up with segments that don’t convert.
These segments can lead teams astray. They give a false sense of achievement, creating profiles that look appealing but don’t bring in sales. It’s important to focus on segments that speak to real customer needs. Otherwise, teams risk wasting time and resources on profiles that fail to deliver results.
Profiling fatigue sets in when teams spend too much time on data and not enough on action. It’s like getting lost in a maze of numbers and losing sight of the exit. Team members end up feeling overwhelmed, drowning in data without clear direction. This fatigue can slow down decision-making and cripple marketing efforts.
Instead of getting stuck in analysis paralysis, teams need to focus on selling. The goal is to create value for the customer and not to get lost in endless segmentation. By keeping their eyes on the prize, teams can bypass fatigue and focus on what really matters — connecting with customers and driving sales.
The “Enough Rule” is a simple but effective guideline. It helps businesses know when to stop segmenting. Think of it as knowing when to stop adding spices to a dish. Too much can ruin the flavor. The same goes for segmentation. Adding more and more segments can dilute the impact and confuse the strategy.
By following this rule, businesses can find the sweet spot where segments are detailed enough to be useful but not overwhelming. This balance helps maintain focus and ensures that businesses connect with their customers. The key is to stop before segmentation turns into a costly mess.
In one real-life scenario, a media company lost its way by over-segmenting its audience. They created so many profiles that they lost sight of the bigger picture. Instead of reaching more people, their efforts backfired, and they began losing market share. It was a classic case of losing the forest for the trees.
By focusing too much on tiny segments, they missed broader trends and audience needs. Competitors stepped in, gaining ground while the company was bogged down in data. This example serves as a cautionary tale — showing that less can sometimes be more.
Think of a mosaic — beautiful pieces forming a bigger picture. A mosaic plot can help businesses spot fragmentation early. It shows how segments fit together, highlighting areas where they might be spreading too thin. This tool helps businesses see if their segmentation strategy is on the right track or if they need to adjust.
By using a mosaic plot, teams can avoid the pitfalls of over-segmentation. They’ll know when to pull back and when to push forward. This foresight can prevent fragmentation from derailing growth and keep businesses focused on their overarching goals.
Customer profiling fails when teams chase too many segments or rely on bad data. Too many tools or ignoring customer feedback adds to the trouble. Stick to fresh data, track actions, and focus on real goals. Avoid these traps and profiling drives growth, not confusion.
| Factor | Common Pitfall | How to Avoid |
| Segmentation | Creating too many segments | Keep segments few and goal-focused |
| Data Quality | Using outdated or poor data | Use fresh, accurate data |
| Profile Relevance | Profiles not tied to goals | Align profiles with clear outcomes |
| Tool Overload | Using too many tools | Stick to a simple toolset |
| Team Coordination | Teams working in silos | Encourage cross-team input |
| Customer Input | Ignoring real customer voices | Collect and use customer feedback |
| Behavior Insights | Guessing behavior, not tracking it | Track real actions, not guesses |
| Profile Updates | Letting profiles go stale | Review and refresh profiles often |
| Compliance | Violating privacy laws | Follow data protection rules |
| Focus on KPIs | Chasing vanity metrics | Focus on KPIs that drive growth |
The 10-Minute SaaS Playbook is your secret weapon. It helps you craft Ideal Customer Profiles (ICPs) that close deals. Picture this: You’re a chef with a recipe, and the ICP is your ingredient list. You need the right mix to cook a successful deal. Start by identifying key characteristics of your best customers. Do they work in tech? Are they small businesses?
With this information, create templates. These templates serve as blueprints for targeting similar audiences. They save time and increase efficiency. It’s like having a set of cookie cutters for different shapes. You don’t need to make each cookie from scratch. This approach keeps your marketing efforts sharp and focused.
Think of your sales funnel as a leaky pipe. Every drop lost is potential revenue. Profiles are the plumbers that fix these leaks. By understanding who your customers are, you can tailor messages that resonate. This direct connection plugs leaks and boosts sales.
Identify which stage of the funnel is leaking. Is it awareness? Consider why potential customers drop off. Are they confused? Lost? With profiles, you can adjust strategies to guide them through the funnel. It’s like adding signposts on a winding road, helping customers reach their destination without straying.
Imagine a lock on a treasure chest. The treasure is your recurring revenue. Customer profiles are the keys. They help keep the chest closed, ensuring customers stay and continue to pay. By understanding their needs, you can offer solutions they can’t resist.
Regularly update these profiles. People change, and so do their preferences. Stay ahead by adapting your approach. Think of it as tuning a musical instrument. A well-tuned strategy keeps the revenue flowing smoothly, creating harmonious customer relationships.
Picture a matrix chart as your navigator. It helps compare profile efficiency across different funnels. Each column represents a stage, while rows highlight customer segments. This layout provides a clear view of what’s working and what’s not.
Use this chart to identify patterns. Are certain profiles converting better at specific stages? Focus on replicating these successes. It’s like finding a rhythm in a dance. Once you have the right steps, the dance becomes effortless, leading to maximum gains.
Your ideal client profile is like a living document. It grows and changes as your business does. You don’t need to start from scratch every time you learn something new. Instead, update it with new insights and data. This approach saves time and keeps your profile relevant.
Think of it as a garden. You don’t replant every season; you nurture what’s already there, adding new plants when necessary. This way, your profile remains robust and continues to meet your business needs.
Have you ever tried to fix a leaky faucet with a hammer? It’s tempting to add more tools to your tech stack, but sometimes less is more. Focus on what you need, not what’s trendy. This prevents tool creep and keeps your operations efficient.
Imagine your tech stack as a toolbox. It should contain only the tools you need to get the job done right. This approach saves money and reduces complexity, allowing you to focus on scaling without unnecessary distractions.
Effective profiling is like a well-oiled machine. Each segment should align with key performance indicators (KPIs). This alignment ensures that your profiling efforts contribute directly to business goals. When segments align with KPIs, you gain insights that drive meaningful action.
Think of KPIs as the engine of your business machine. They power your efforts and keep everything running smoothly. Align your segments with these indicators to ensure your profiling efforts are always on track.
Picture a manufacturer struggling to meet demand. By refining its profiling practices, it doubled output without increasing costs. The secret? Lean profiling targeted toward key market segments.
This approach streamlined operations and focused efforts on the most profitable areas. By understanding customer needs and preferences, the manufacturer enhanced efficiency and boosted production, proving that smart profiling can drive real-world success.
The 80/20 Rule suggests that 80% of your results often come from just 20% of your efforts – and a Pareto chart makes this crystal clear. When it comes to customer profiling, a Pareto chart helps you pinpoint the segments that contribute the most to your revenue. Instead of spreading your resources thin, you can focus on the high-value profiles that truly drive growth.
It’s like uncovering your business’s hidden goldmine. By zeroing in on these key segments, you can allocate time and energy where it counts, making your strategy both efficient and impactful. With a Pareto chart, your path to sustainable success becomes far more focused and actionable.
Customer profiling is the process of creating detailed representations of your ideal customers based on data, behaviors, and demographics. It helps businesses understand who their customers are, what they need, and how they make decisions. By segmenting customers into profiles, companies can tailor marketing, sales, and service strategies to better meet specific needs, increase engagement, and drive growth through more personalized and effective communication.
Customer profiling can be done using various methods, including demographic, psychographic, geographic, and behavioral analysis. Demographic profiling focuses on age, income, and gender, while psychographic profiling explores values, interests, and lifestyles. Geographic profiling looks at location-based trends, and behavioral profiling examines purchasing patterns and online activity. Businesses often combine these methods to create more comprehensive, actionable customer profiles that guide targeted marketing and product development strategies.
Customer profiling isn’t about collecting more data. It’s about getting the right data and using it to fuel decisions that matter. Too many profiles, too many segments, and too much noise pull teams away from what really drives growth. It’s time to cut through the clutter.
Start with outcomes. Focus on the customers who move the needle for your business. Use simple tools, clear templates, and smart filters to stay on track. Forget about the flash of vanity segments. Go for profiles that hit key targets and deliver real value.
Remember, you don’t need more—just enough to act with confidence.
And here’s the truth: customer profiling isn’t a guessing game. It’s your direct line to smarter choices, faster wins, and stronger growth. Make it count.
How much did you enjoy this article?


Calculate accounts receivable turnover ratio to measure credit collection speed, improve cash flow, and strengthen your financial strategy. Read on!

Change Management KPIs are the key to tracking adoption, performance, and ROI during transitions. Find out which metrics matter. Read on!

Data collection methods and techniques determine the quality of every insight you act on. Explore key approaches for gathering reliable data. Read on!


