• Home
  • Tools dropdown img
    • Spreadsheet Charts

      • ChartExpo for Google Sheets
      • ChartExpo for Microsoft Excel
    • Power BI Charts

      • Power BI Custom Visuals by ChartExpo
    • Word Cloud

  • Charts dropdown img
    • Chart Category

      • Bar Charts
      • Circle Graphs
      • Column Charts
      • Combo Charts
      • Comparison Charts
      • Line Graphs
      • PPC Charts
      • Sentiment Analysis Charts
      • Survey Charts
    • Chart Type

      • Box and Whisker Plot
      • Clustered Bar Chart
      • Clustered Column Chart
      • Comparison Bar Chart
      • Control Chart
      • CSAT Survey Bar Chart
      • CSAT Survey Chart
      • Dot Plot Chart
      • Double Bar Graph
      • Funnel Chart
      • Gauge Chart
      • Likert Scale Chart
      • Matrix Chart
      • Multi Axis Line Chart
      • Overlapping Bar Chart
      • Pareto Chart
      • Radar Chart
      • Radial Bar Chart
      • Sankey Diagram
      • Scatter Plot Chart
      • Slope Chart
      • Sunburst Chart
      • Tornado Chart
      • Waterfall Chart
      • Word Cloud
    • Google Sheets
      Microsoft Excel
  • Services
  • Pricing
  • Contact us
  • Blog
  • Support dropdown img
      • Gallery
      • Videos
      • Contact us
      • FAQs
      • Resources
    • Please feel free to contact us

      atsupport@chartexpo.com

Categories
All Data Visualizations Data Analytics Surveys
Add-ons/
  • Google Sheets
  • Microsoft Excel
  • Power BI
All Data Visualizations Data Analytics Surveys
Add-ons
  • Google Sheets
  • Microsoft Excel
  • Power BI

We use cookies

This website uses cookies to provide better user experience and user's session management.
By continuing visiting this website you consent the use of these cookies.

Ok

ChartExpo Survey


Home > Blog > Data Analytics

Business Management KPIs for Driving Clearer Insights

How do businesses measure success beyond revenue? Business management KPIs show how well a company is achieving its goals. Without them, businesses struggle to measure success.

KPIs for accounting help track financial health, revealing trends that impact growth. A company might have strong sales, but if expenses keep rising, profits shrink. Tracking key metrics ensures leaders make informed decisions.

Business Management KPIs

Numbers tell a story. KPI graphs make data easier to understand, showing patterns at a glance. A declining profit margin or rising accounts payable can signal trouble. Without clear visuals, businesses risk missing critical red flags. Research shows that 73% of companies that actively monitor KPIs improve decision-making and efficiency.

Cost control is crucial. Business overhead costs include rent, utilities, and administrative expenses. If these costs climb too high, profitability suffers. Companies that analyze overhead costs regularly can cut waste and boost margins. A Harvard study found that businesses reducing unnecessary overhead by 10% saw an average profit increase of 25%.

Data-driven businesses perform better. Amazon, for example, tracks hundreds of business management KPIs daily, ensuring efficiency at every level. Even small businesses benefit from tracking expenses, cash flow, and profit trends. Companies that fail to monitor KPIs often struggle to stay competitive.

Understanding the right metrics helps businesses stay profitable, adapt to challenges, and drive long-term success. Let’s see how the right metrics transform businesses from struggling to thriving.

Table of Contents:

  1. What are Business Management KPIs?
  2. Why are KPIs for Business Development Managers Important?
  3. 10 Important KPIs for Business Relationship Management
  4. How to Effectively Use Business Management KPIs?
  5. How to Analyze Business Management KPIs in Excel?
  6. Limitations of KPIs for Business Management
  7. FAQs
  8. Wrap Up

What are Business Management KPIs?

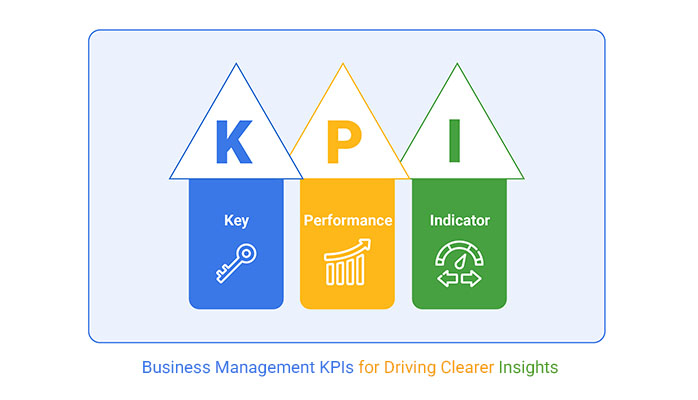
Definition: Business management KPIs measure a company’s performance. They track efficiency, profitability, and growth – clear metrics help leaders make smart decisions. Companies that monitor KPIs are more likely to succeed.

What are sales KPIs? They track sales growth, conversion rates, and customer retention. Strong sales don’t always mean high profits. Businesses use these metrics to spot trends and adjust their strategies.

SMART KPIs examples help set clear goals. They ensure targets are specific, measurable, achievable, relevant, and time-bound. Companies using SMART KPIs improve efficiency and decision-making. Tracking the right data helps businesses stay competitive and drive long-term success.

Why are KPIs for Business Development Managers Important?

Tracking performance is crucial for growth. KPIs for business development managers provide clear insights into areas that need improvement; without them, decisions lack direction.

Here are some reasons why monitoring KPIs is essential:

  • Track sales and revenue growth: Measuring sales growth helps identify whether your strategies are working. It also shows which areas need more attention to increase revenue.
  • Assess lead generation and customer acquisition: Business development KPIs show how many leads are converted into paying customers. Monitoring this helps improve the efficiency of your sales funnel.
  • Improve market expansion strategies: Success measurement in new markets lets you know how to improve your approach. This ensures smoother expansion by helping you fine-tune your business’s strategies.
  • Improve relationship management: Tracking customer satisfaction and retention rates helps keep business relationships healthy. It makes it possible to reduce customer churn and gain customer loyalty in the long term.
  • Improve business performance: The business process management KPI indicates how  effectively your internal processes operate. Recognizing inefficiencies enables you to optimize operations, enhance time efficiencies, and minimize unnecessary expenses.

10 Important KPIs for Business Relationship Management

Strong relationships drive business success. Happy clients stay longer, refer others, and increase revenue. But how do you measure relationship strength? Key Performance Indicators for operations track how well a company manages clients, partnerships, and service quality.

Here are 10 key KPIs for business relationship management:

  1. Customer Satisfaction Score (CSAT): Happy customers mean repeat business. This score shows how satisfied clients are after an interaction or purchase.
  2. Net Promoter Score (NPS): Measures how likely a customer is to recommend your business. A high NPS means strong relationships and organic growth.
  3. Client Retention Rate: Keeping customers is cheaper than finding new ones. This KPI tracks how many clients stay with you over time.
  4. Customer Lifetime Value (CLV): Loyal customers bring in steady revenue. CLV predicts the total earnings from a single client relationship.
  5. Response Time to Client Inquiries: Speed matters – quick replies show customers you value them, increasing trust and satisfaction.
  6. Resolution Time for Client Issues: Fixing problems fast keeps customers happy. Delays can frustrate clients and lead to lost business.
  7. Account Growth Rate: Existing customers can drive big profits. This KPI tracks how much revenue comes from repeat clients.
  8. Customer Engagement Score: Strong relationships mean active interactions. This metric shows how often customers interact with your brand.
  9. Partnership Success Rate: Business collaborations should benefit both sides. This KPI measures how well partnerships perform.
  10. Churn Rate: Losing customers is expensive. A high churn rate signals problems with service, pricing, or engagement.

How to Effectively Use Business Management KPIs?

Effective use of business management KPIs can drive growth and efficiency. When aligned with business goals, KPIs provide the clarity needed for success. But simply having them isn’t enough. It’s about how you use them to make better decisions and improve outcomes.

Here’s how to effectively use KPIs:

  1. Align KPIs with business goals: Ensure each KPI supports your business objectives. This keeps teams focused on what truly matters.
  2. Focus on key metrics: Not all KPIs are equally important. Choose the ones that directly impact your growth and performance.
  3. Set measurable and achievable targets: Your targets should be realistic and quantifiable. Setting unattainable goals can demotivate teams and hurt progress.
  4. Automate KPI tracking: Use software to track your KPIs automatically. This reduces errors and saves time, ensuring real-time insights.
  5. Regularly review and adjust KPIs: As your business evolves, so should your KPIs. Regular reviews help refine goals and ensure they remain relevant.
  6. Communicate KPI insights with teams: Share KPI results with your team. This transparency fosters collaboration and alignment across departments.
  7. Use KPIs for continuous improvement: Retail industry KPIs and other business-related metrics like the recruitment Key Performance Indicators help identify areas for improvement. Use them to adjust strategies and optimize performance.

How to Analyze Business Management KPIs in Excel?

Data analysis can be a real challenge. Raw numbers often lack context, making it hard to uncover meaningful insights. Business management KPIs are crucial, but they need to be presented in a way that’s easy to understand. While a market research report template can provide valuable trends, the data can still be overwhelming.

Excel is a go-to tool, but its charting capabilities fall short when creating insightful, engaging visuals. That’s where ChartExpo comes in. It enhances data visualization, making complex information more accessible and actionable. With ChartExpo, you can transform your data into insightful visuals and make smarter business decisions.

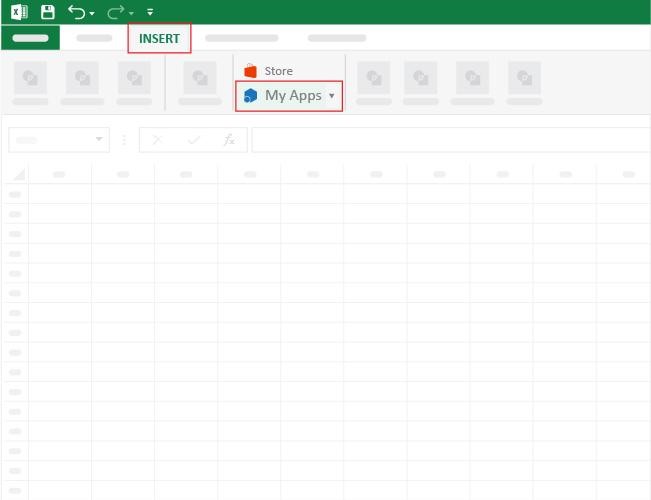
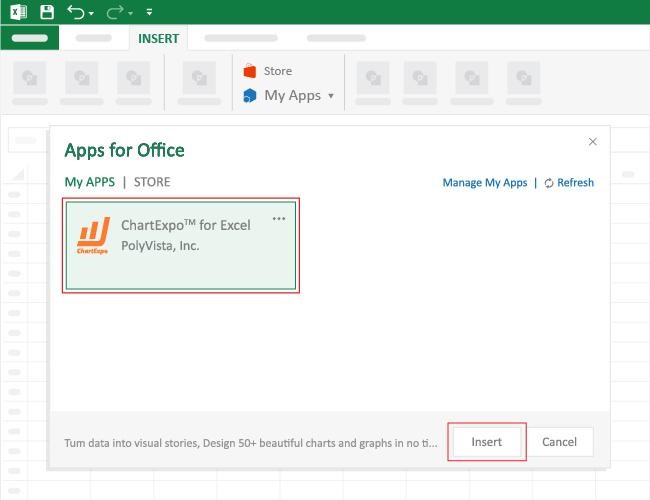
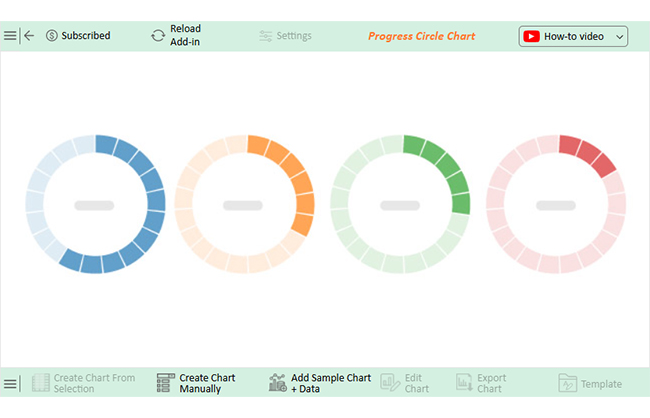
How to Install ChartExpo in Excel?

  1. Open your Excel application.
  2. Open the worksheet and click the “Insert” menu.
  3. You’ll see the “My Apps” option.
  4. In the Office Add-ins window, click “Store” and search for ChartExpo on the My Apps Store.
  5. Click the “Add” button to install ChartExpo in your Excel.

ChartExpo charts are available both in Google Sheets and Microsoft Excel. Please use the following CTAs to install the tool of your choice and create beautiful visualizations with a few clicks in your favorite tool.

Example

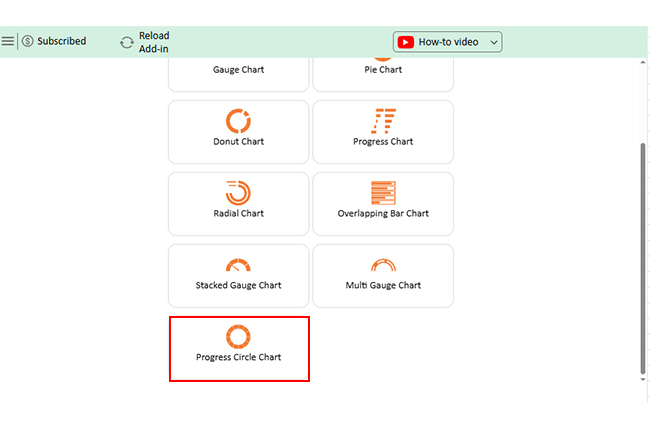
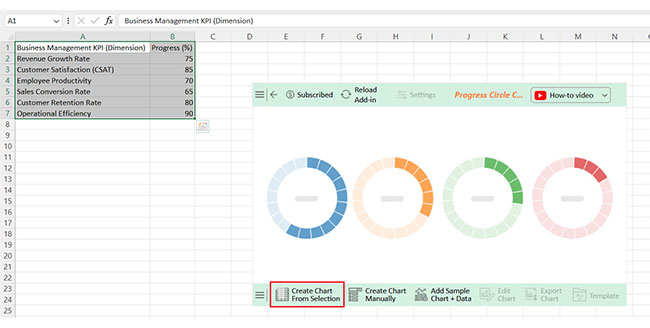
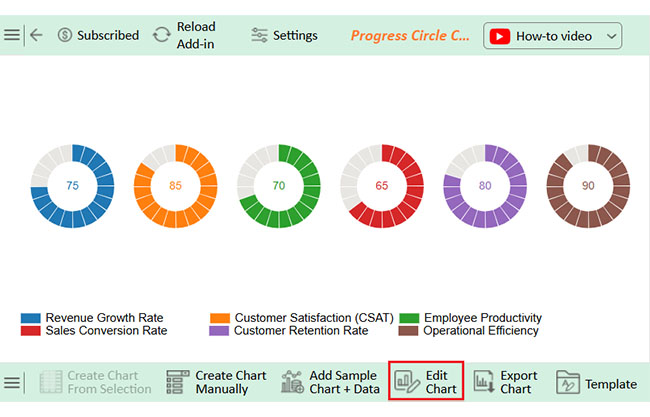
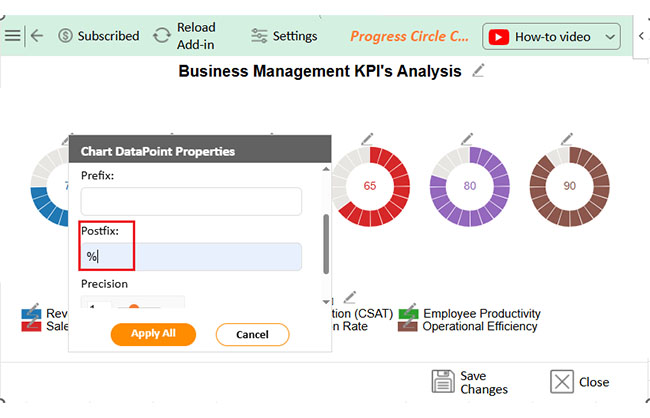
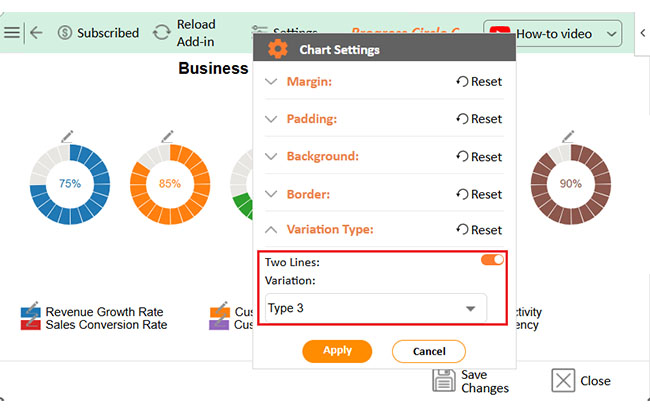
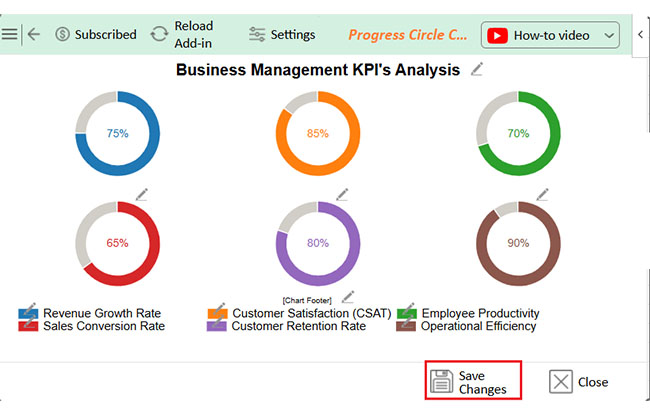
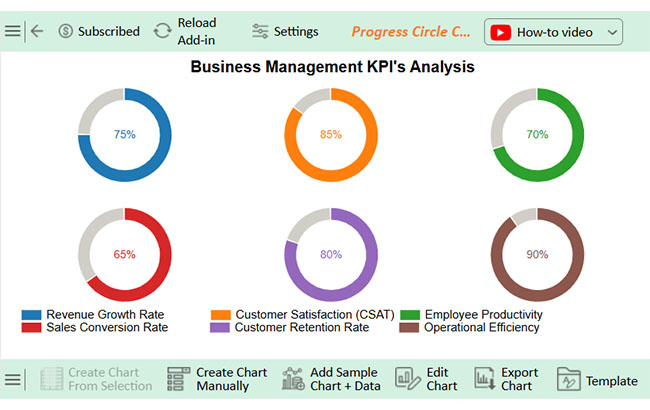
Let’s visualize the business management KPI data below and analyze it using ChartExpo for Excel.

Business Management KPI (Dimension) Progress (%)
Revenue Growth Rate 75
Customer Satisfaction (CSAT) 85
Employee Productivity 70
Sales Conversion Rate 65
Customer Retention Rate 80
Operational Efficiency 90
  • To get started with ChartExpo, install ChartExpo in Excel.
  • Now Click on My Apps from the INSERT menu.
Business Management KPIs
  • Choose ChartExpo from My Apps, then click Insert.
Business Management KPIs
  • Once it loads, scroll through the charts list to locate and choose the “Progress Circle Chart”.
Business Management KPIs
  • You will see a Progress Circle Chart on the screen.
Business Management KPIs
  • Click the “Create Chart From Selection” button after selecting the data from the sheet, as shown.
Business Management KPIs
  • ChartExpo will generate the visualization below for you.
Business Management KPIs
  • If you want to add anything to the chart, click the Edit Chart button:
  • Click the pencil icon next to the Chart Header to change the title.
  • It will open the properties dialog. Under the Text section, you can add a heading in Line 1 and enable Show.
  • Give the appropriate title of your chart and click the Apply button.
Business Management KPIs
  • You can add the percentage sign with all values as follows:
Business Management KPIs
  • Now you can change the Data Representation by clicking on Settings as follows:
Business Management KPIs
  • Click the “Save Changes” button to persist the changes made to the chart.
Business Management KPIs
  • Your final Progress Circle Chart will look like the one below.
Business Management KPIs

Insights

  • Operational Efficiency: 90% – Indicates strong business performance.
  • Customer Satisfaction: 85% – Reflects a positive customer experience.
  • Sales Conversion Rate: 65% – Shows room for improvement in sales strategies.
  • Employee Productivity: 70% – Suggests the need for workforce efficiency enhancements.
  • Key Focus Areas: Improving sales tactics and boosting employee productivity can drive business growth and retention.

Limitations of KPIs for Business Management

KPIs are powerful tools, but they have their drawbacks. Over-relying on them can lead to misguided decisions. While KPIs measure success, they don’t always tell the whole story. Therefore, understanding their limitations is just as important as tracking them.

Here are some limitations of KPIs for business management:

  • Over-reliance on quantitative data: KPIs often focus on numbers, but not everything can be measured this way. For instance, SaaS Key Performance Indicators or Key Performance Indicators for manufacturing industry might miss the nuance of customer satisfaction or product quality.
  • Misalignment with business goals: KPIs should support your business’s objectives. When they don’t align, efforts can become fragmented, leading to wasted resources.
  • Short-term focus: Some KPIs focus on short-term gains, which might ignore long-term strategy. This creates a cycle of reactive decisions instead of proactive growth.
  • Data accuracy and reliability issues: Bad data leads to bad decisions. Without accurate, reliable data, KPIs are meaningless and can misguide strategies.
  • Difficulty in measuring complex factors: Not all business success can be captured in a number. Customer loyalty, for example, is a long-term, complex factor that KPIs may fail to measure effectively.
  • Risk of manipulation: There’s always a risk that data will be manipulated to meet targets. This undermines the purpose of KPIs and can distort business insights.
  • KPIs can lead to tunnel vision: Focusing too much on specific KPIs can cause businesses to ignore other important factors. This narrow focus limits overall growth and innovation.

FAQs

What are KPIs in business operations?

KPIs in business operations measure efficiency and effectiveness. They track performance in key areas like production, quality, and cost management. These metrics help businesses optimize processes, identify problems, and make data-driven decisions to improve operations.

How many KPIs should a business have?

A business should have a manageable number of KPIs, typically between 5 to 10. Too many KPIs can overwhelm teams. Focus on key areas that align with business goals. This ensures precise tracking, decision-making, and progress measurement.

Wrap Up

Business management KPIs are the critical KPIs used to measure success. They can also assist in tracking progress and recognizing what needs improvement. KPIs are all good indicators of a company’s performance and help facilitate decision-making. Businesses often find themselves losing sight of their vision without them.

Measuring key areas, such as sales, operations, and customer satisfaction, with KPIs is crucial. They show where the business is doing well and where it needs work. For instance, Key Performance Indicators for operations help organizations see how efficiently they operate. This leads to better decisions based on data.

Tracking KPIs also helps to ensure that they align with business goals. Without clear metrics, measuring whether a strategy is working can be difficult. KPIs ensure businesses stay on track, providing the clarity needed to achieve objectives.

Excel has limitations for complex data visualization, making it considerably difficult for effective KPI analysis. Its charts, while good, always fail to deliver insights meaningfully. This might inhibit decision-making and cause confusion.

ChartExpo solves these problems — without complexity — by providing straightforward and powerful data visualization. So, you can build clear charts that help make KPIs look more  accessible with just the right amount of visual spice.

Now is the time to harness the complete power of your business data. Install ChartExpo today to visualize your KPIs and make smarter, informed decisions.


Net Promoter, NPS, NPS Prism, and many other terms related to NPS are registered trademarks of Bain & Company Inc., Satmetrix Systems Inc., and Fred Reichheld.

How much did you enjoy this article?

PBIAd1
Start Free Trial!
151482

Related articles

next previous
Data Analytics22 min read

80-20 Rule: The Math Is Simple. The Impact Isn’t.

80-20 rule missteps can cost growth and alignment. Are you focusing on the right 20% or missing what matters? Learn more and rethink your strategy today!

Data Analytics8 min read

Benchmarking Dashboard: Tips for Better Insights

This guide dives deep into what benchmarking dashboards are. The guide also reveals easy ways and steps to create a benchmarking dashboard in Power BI.

Data Analytics9 min read

Inventory Management KPIs for Better Visual Insights

Key Performance Indicators for inventory track stock accuracy and efficiency. This blog covers the essential KPIs, analysis tips, and Excel tracking methods.

Data Analytics11 min read

How to Increase Efficiency in a Business?

How to increase efficiency in the business is key to boosting performance. Click here to learn the strategies to use to increase your business efficiency.

Data Analytics9 min read

Moving Annual Total for Insightful Reports

The Moving Annual Total (MAT) tracks 12 months of data for clearer trends. Discover its importance, formula, and Excel analysis for better sales forecasting.

ChartExpo logo

Turn Data into Visual
Stories

CHARTEXPO

  • Home
  • Gallery
  • Videos
  • Services
  • Pricing
  • Contact us
  • FAQs
  • Privacy policy
  • Terms of Service
  • Sitemap

TOOLS

  • ChartExpo for Google Sheets
  • ChartExpo for Microsoft Excel
  • Power BI Custom Visuals by ChartExpo
  • Word Cloud

CATEGORIES

  • Bar Charts
  • Circle Graphs
  • Column Charts
  • Combo Charts
  • Comparison Charts
  • Line Graphs
  • PPC Charts
  • Sentiment Analysis Charts
  • Survey Charts

TOP CHARTS

  • Sankey Diagram
  • Likert Scale Chart
  • Comparison Bar Chart
  • Pareto Chart
  • Funnel Chart
  • Gauge Chart
  • Radar Chart
  • Radial Bar Chart
  • Sunburst Chart
  • see more
  • Scatter Plot Chart
  • CSAT Survey Bar Chart
  • CSAT Survey Chart
  • Dot Plot Chart
  • Double Bar Graph
  • Matrix Chart
  • Multi Axis Line Chart
  • Overlapping Bar Chart
  • Control Chart
  • Slope Chart
  • Clustered Bar Chart
  • Clustered Column Chart
  • Box and Whisker Plot
  • Tornado Chart
  • Waterfall Chart
  • Word Cloud
  • see less

RESOURCES

  • Blog
  • Resources
  • YouTube
SIGN UP FOR UPDATES

We wouldn't dream of spamming you or selling your info.

© 2025 ChartExpo, all rights reserved.