Categories
SaaS key performance indicators are the compass points guiding software-as-a-service companies through the digital expanse.


Imagine steering a ship across the vast digital ocean. You watch the horizon for signs of growth, engagement, and revenue. Without these navigational stars, you’re adrift amidst waves of data, unsure if you’re sailing toward success. Or if you’re circling back to stagnant waters.
Now, picture a dashboard bristling with dials and gauges. Each one is a SaaS key performance indicator: churn rate, customer acquisition cost, monthly recurring revenue, etc. They don’t just measure progress; they chart the future. Knowing your position is critical in an industry where over 15,000 SaaS companies hustle under the sun.
SaaS key performance indicators are not mere numbers on a screen. They are the pulse of your business, the breath of your strategy. They tell you how many users sign up but stay silent on Sunday nights. They whisper about the costs of wooing new subscribers and shout about the triumphs of recurring revenue.
This blog post is your captain’s log, detailing the SaaS key performance indicators that matter. No fluff, no filler, just the straight talk on what metrics will keep your company on a steady sail.
Whether you’re a startup or a seasoned SaaS captain, these metrics are the stars by which you navigate. So hoist the sails, and let us embark on this voyage together.
First…
Definition: SaaS key performance indicators (KPIs) evaluate the performance and effectiveness of SaaS applications and services. These KPIs help SaaS companies measure various aspects of their business, track progress, identify areas for improvement, and make data-driven decisions.
Common SaaS KPI examples include:
SaaS KPIs help guide the success and growth of software-as-a-service (SaaS) businesses. They provide valuable insights into various aspects of SaaS operations. This enables companies to make informed decisions, optimize processes, and achieve long-term success.
SaaS KPIs and metrics are crucial for assessing SaaS businesses’ health, performance, and success. While both are essential for monitoring various aspects of SaaS operations, their focus and granularity differ. Here are the differences between SaaS KPIs vs. SaaS metrics.
| Aspect | SaaS KPIs | SaaS Metrics |
| Definition | Key indicators that measure the performance and success of a SaaS business as a whole. | Quantifiable measures assess specific aspects of a SaaS operation, such as customer acquisition or churn. |
| Focus | Broad and strategic, providing an overview of overall business performance. | Narrow and focused on specific aspects of SaaS operations or performance. |
| Example | Monthly Recurring Revenue (MRR), Customer Lifetime Value (CLTV), Churn Rate | Customer Acquisition Cost (CAC), Average Revenue Per User (ARPU), Customer Satisfaction Score (CSAT) |
| Purpose | Provides insights into the overall health and growth of the SaaS business, guiding strategic decisions. | Offers detailed insights into specific areas of SaaS operations, facilitating targeted optimizations and improvements. |
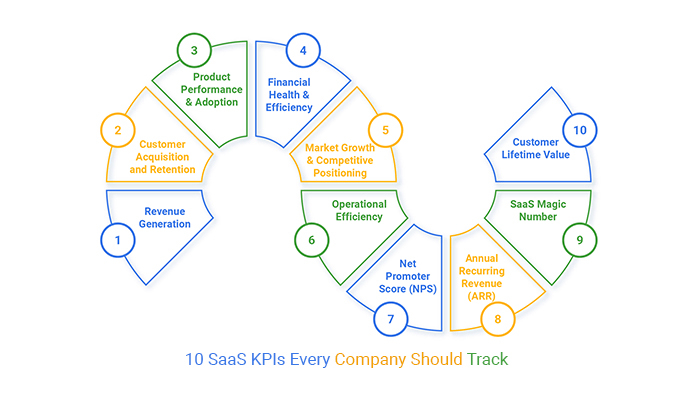
When managing a Software-as-a-Service (SaaS) business, tracking the right Key Performance Indicators (KPIs) is essential for success. These KPIs provide insights into various business aspects and help make informed decisions. Here are the most critical areas your SaaS KPIs should cover:
Monitor metrics such as Monthly Recurring Revenue (MRR), Annual Recurring Revenue (ARR), and Average Revenue Per User (ARPU). Why? To understand the revenue generated from subscription-based services and identify growth opportunities.
Track Customer Acquisition Cost (CAC), Customer Lifetime Value (CLV), and Churn Rate. This will help you assess the effectiveness of marketing and sales efforts and gauge customer satisfaction and loyalty.
Measure metrics like Active Users, User Engagement, and Feature Adoption to evaluate how customers use your product. You can identify popular features and assess overall product performance.
Analyze Gross Margin, Burn Rate, and Cash Runway using a Pyramid chart to ensure the business’s financial stability and sustainability. You’ll also identify opportunities for cost optimization and efficiency improvements.
Monitor metrics such as Market Share and Customer Satisfaction (CSAT). Why? To evaluate the company’s position in the market, assess competitive threats, and identify areas for differentiation.
Track metrics like Customer Support Tickets, Time to Resolution, and Server Uptime to measure the efficiency of internal operations. This will also help you identify bottlenecks and ensure smooth service delivery to customers.
A measure of customer satisfaction and loyalty, based on how likely customers are to recommend your product. Net promoter score is a strong indicator of customer satisfaction and potential for organic growth through referrals.
The annualized version of MRR reflects yearly recurring revenue. ARR provides a long-term view of revenue and is essential for strategic planning and investor communications
A metric that assesses the efficiency of sales and marketing spending in driving new revenue. Calculated as the change in quarterly revenue multiplied by four, divided by the previous quarter’s sales and marketing expenses. The SaaS Magic Number helps determine if a company is scaling efficiently and whether it should invest more in sales and marketing.
The total revenue a business can expect from a single customer account throughout its business relationship. CLTV helps determine how much can be spent on acquiring new customers and guides strategic planning.
Setting KPIs is straightforward, provided you think it through properly and follow the key rules. Here’s a detailed step-by-step guide on how to set KPIs for SaaS:
Data analysis can be as tricky as solving a Rubik’s cube blindfolded. With mountains of data and complex SaaS KPI metrics to decipher, it’s like finding a needle in a haystack.
However, data visualization is the torchbearer of clarity in this data jungle. It’s the superhero cape that transforms raw numbers into meaningful insights.
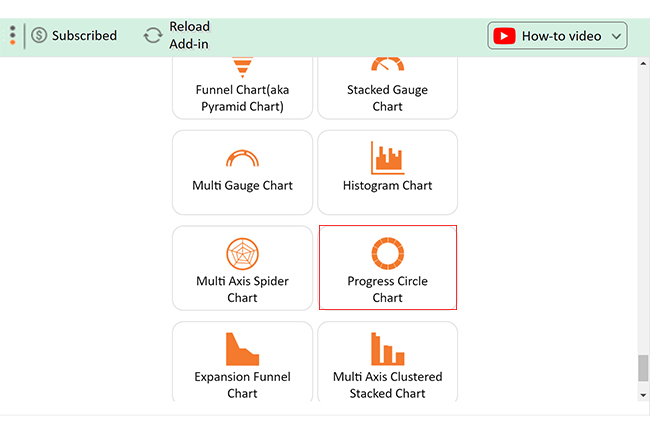
Excel is a trusty steed in the world of spreadsheets. But alas, it falls short when creating visually stunning and insightful data visualizations. Fear not, for ChartExpo emerges as the gallant hero, ready to liberate your metrics from Excel’s visual quagmire.
With ChartExpo, your SaaS KPI Metrics burst into life, making your data analysis a captivating escapade.
Let’s learn how to install ChartExpo in Excel.
ChartExpo charts are available both in Google Sheets and Microsoft Excel. Please use the following CTAs to install the tool of your choice and create beautiful visualizations with a few clicks in your favorite tool.


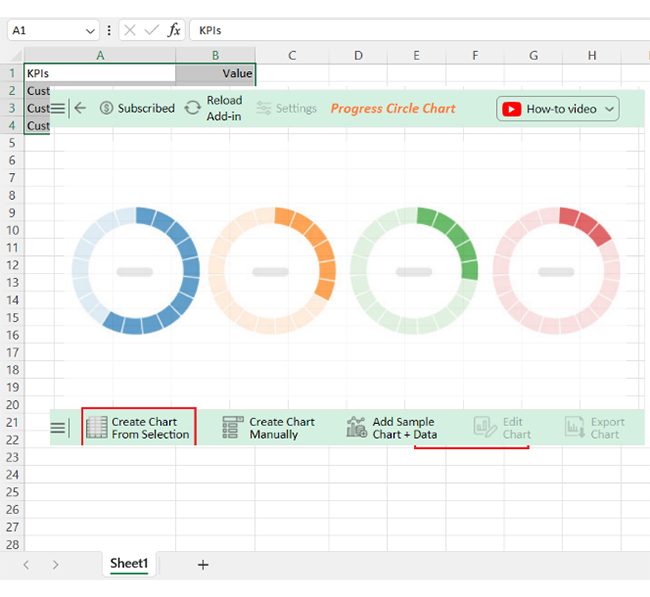
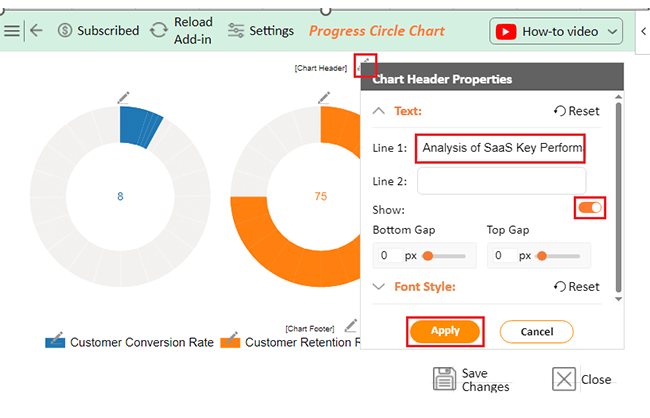
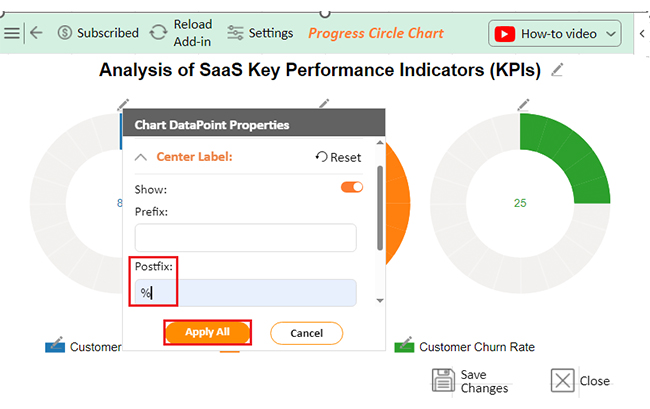
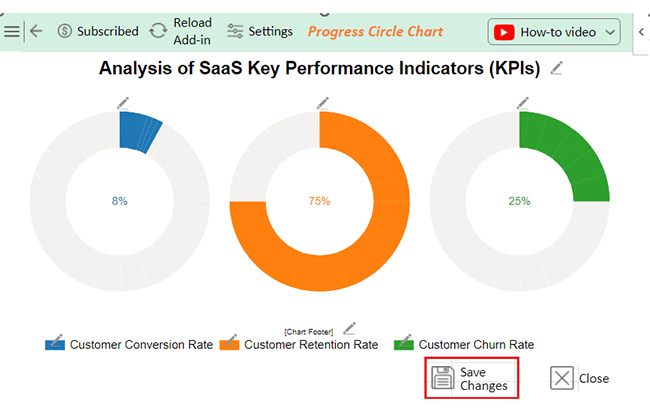
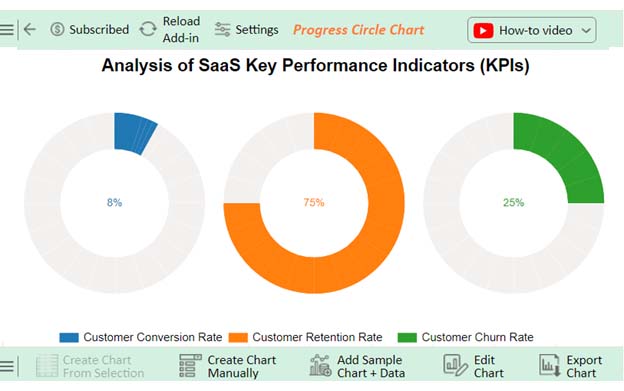
Let’s analyze the SaaS KPI metrics sample data below using ChartExpo.
| KPIs | Value |
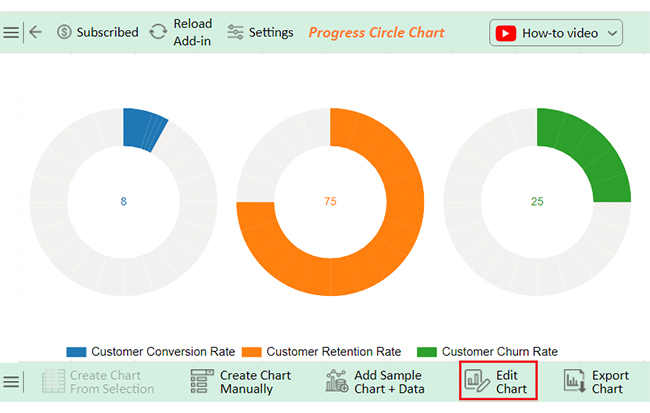
| Customer Conversion Rate | 8 |
| Customer Retention Rate | 75 |
| Customer Churn Rate | 25 |


Common KPIs in SaaS include:
These metrics help assess SaaS companies’ financial performance, customer satisfaction, and business growth.
Monitor your SaaS performance by tracking key metrics such as:
Utilize data analytics tools and dashboards to gain insights, identify trends, and make informed decisions for optimization.
Measure the success of a SaaS product by evaluating metrics such as;
Additionally, track user engagement, product adoption rates, and customer retention to gauge overall success.
SaaS KPIs are critical in assessing SaaS businesses’ health, performance, and successes. These KPIs shed light on many facets of the SaaS business. As a result, they enable businesses to make more informed assessments, streamline processes, and achieve sustained success.
SaaS KPIs provide a complete picture of the company’s overall trajectory and performance. For instance, metrics like MRR and CAC help to understand the company’s market stance and identify lucrative areas for growth.
These KPIs are important in measuring performance. They enable businesses to evaluate the effectiveness of their programs and directives. For instance, CLV and Churn Rate help to gauge customers’ perceived value and holistic organizational performance.
Another vital benefit of SaaS KPIs is data-driven decision-making. They enable companies to make decisions based on fact and evidence rather than guesswork or intuition. This provides benefits such as accuracy and low error risk.
Beyond that, SaaS KPIs allow for the optimization of business processes. Measurements like Gross Margin or Burn Rate indicate where to save money, increase efficiency, or seek growth opportunities.
Finally, SaaS KPIs are critical because they provide long-term market operation opportunities. All the metrics facilitate change, ideal for an organization willing to achieve stability and growth. Thus, SaaS KPIs are indispensable for achieving and maintaining success in the dynamic and competitive SaaS industry.
How much did you enjoy this article?


Calculate accounts receivable turnover ratio to measure credit collection speed, improve cash flow, and strengthen your financial strategy. Read on!

Change Management KPIs are the key to tracking adoption, performance, and ROI during transitions. Find out which metrics matter. Read on!

Data collection methods and techniques determine the quality of every insight you act on. Explore key approaches for gathering reliable data. Read on!


