• Home
  • Tools dropdown img
    • Spreadsheet Charts

      • ChartExpo for Google Sheets
      • ChartExpo for Microsoft Excel
    • Power BI Charts

      • Power BI Custom Visuals by ChartExpo
    • Word Cloud

  • Charts dropdown img
    • Chart Category

      • Bar Charts
      • Circle Graphs
      • Column Charts
      • Combo Charts
      • Comparison Charts
      • Line Graphs
      • PPC Charts
      • Sentiment Analysis Charts
      • Survey Charts
    • Chart Type

      • Box and Whisker Plot
      • Clustered Bar Chart
      • Clustered Column Chart
      • Comparison Bar Chart
      • Control Chart
      • CSAT Survey Bar Chart
      • CSAT Survey Chart
      • Dot Plot Chart
      • Double Bar Graph
      • Funnel Chart
      • Gauge Chart
      • Likert Scale Chart
      • Matrix Chart
      • Multi Axis Line Chart
      • Overlapping Bar Chart
      • Pareto Chart
      • Radar Chart
      • Radial Bar Chart
      • Sankey Diagram
      • Scatter Plot Chart
      • Slope Chart
      • Sunburst Chart
      • Tornado Chart
      • Waterfall Chart
      • Word Cloud
    • Google Sheets
      Microsoft Excel
  • Services
  • Pricing
  • Contact us
  • Blog
  • Support dropdown img
      • Gallery
      • Videos
      • Contact us
      • FAQs
      • Resources
    • Please feel free to contact us

      atsupport@chartexpo.com

Categories
All Data Visualizations Data Analytics Surveys
Add-ons/
  • Google Sheets
  • Microsoft Excel
  • Power BI
All Data Visualizations Data Analytics Surveys
Add-ons
  • Google Sheets
  • Microsoft Excel
  • Power BI

We use cookies

This website uses cookies to provide better user experience and user's session management.
By continuing visiting this website you consent the use of these cookies.

Ok

ChartExpo Survey


Home > Blog > Power BI

Crafting a Business Intelligence Dashboard That Matters

Are you yearning for an effortless way to navigate the vast ocean of data?

Look no further because we have a solution – the business intelligence dashboard.

You might wonder, “Are we back in the era of sleek automobiles and dashboard-mounted bobbleheads?”

business intelligence dashboard

Well, be at ease, my friend. We won’t be discussing bobbleheads today (unfortunately). We will dive headfirst into the realm of data-driven decision-making with Powerful dashboards.

Imagine having a bird’s-eye view of your business’s key metrics and insights in a digestible format. That’s precisely what a business intelligence dashboard in BI can do for you.

It’s like having your command center, where insights flow like a well-brewed coffee. And decisions are made with the confidence of a mathematician juggling equations.

Here, we unravel the secrets of creating a dashboard that will leave you in awe. We’ll walk you through the process, from selecting the right visualizations to pinning them from existing reports.

Table of Contents:

  1. What is a Business Intelligence Dashboard?
  2. Key Features of Business Intelligence Dashboards
  3. Benefits And Limitations
  4. BI Dashboard Examples and Use Cases
  5. Approach to Craft Your Business Intelligence Dashboard
  6. Wrap Up

What is a Business Intelligence Dashboard?

Definition: A business intelligence dashboard is a visual representation of key business metrics and data. It provides a real-time snapshot of performance, allowing you to monitor and analyze critical information at a glance.

Dashboards consolidate data from multiple sources into interactive charts, graphs, and tables. Consequently, enabling you to identify trends or patterns and make informed decisions in no time.

Key Features of BI Dashboards

Customization:

  • Craft a personalized dashboard experience, and choose specific metrics, visualizations, and layouts that align with your unique requirements.

Interactivity:

  • Engage with data actively; explore, drill down, and filter to unravel deeper insights, fostering a dynamic analytical experience.

KPI Highlights:

  • Spotlight crucial Key Performance Indicators (KPIs) for an immediate and focused understanding of overall business performance.

Mobile Responsiveness:

  • Stay connected and informed on the move with mobile-responsive dashboards that adapt seamlessly to various devices.

Security Controls:

  • Fortify your data fortress with robust security measures, ensuring the confidentiality and integrity of your valuable information.

Benefits And Limitations of BI Dashboard

Benefits:

  • Data Visualization:

It provides visual representations of complex data, making it easier for users to understand trends, patterns, and insights at a glance.

  • Real-Time Monitoring:

Dashboards offer real-time or near-real-time updates, allowing users to monitor key metrics, including cost of living comparison reports, and make timely decisions based on the latest information.

  • Improved Decision-Making:

Access to accurate and relevant data on a single dashboard empowers decision-making to make informed and strategic decisions, leading to better business outcomes.

  • Efficient Data Analysis:

This can streamline data analysis, allowing users to quickly identify correlations, outliers, and trends, that might be challenging to discern from raw data.

  • Increased Productivity:

By providing a centralized and user-friendly interface, BI dashboards save time and reduce the need for manual data gathering, promoting overall productivity.

  • Cross-Functional Collaboration:

Facilitate collaboration by providing a common platform for teams from different departments to access and analyze shared data, fostering a more collaborative organizational culture.

Limitations of Business Intelligence Dashboards

  • Data Quality Issues:

The effectiveness of dashboards depends on the quality of the underlying data. Inaccurate or incomplete data can lead to unreliable insights.

  • Complex Implementation:

Implementing dashboards can be complex and may require integration with various data sources, which could pose challenges, particularly for organizations with legacy systems.

  • Costs and Resources:

The initial setup costs and ongoing maintenance of dashboards, including software licensing, infrastructure, and training, can be significant for some organizations.

  • Limited Predictive Analysis:

While Business Intelligence Dashboards are excellent for historical and current data analysis, they may have limitations in providing robust predictive analytics capabilities.

A well-designed dashboard, such as one featuring a Power BI income statement, can save time by providing critical information at a glance. You can avoid sifting through complex spreadsheets and focus on the most relevant data for your decision-making processes.

Real-world BI Dashboard Examples and Practical Use Cases

Business Intelligence (BI) dashboards are powerful tools that give visual portrayals of information to help with informed navigation. Here are a few certifiable models and viable use instances of dashboards:

Sales Performance Dashboard:

  • Use Case: The sales dashboard indicates performance metrics in real-time.
  • Key Metrics: Revenue, sales growth, conversion rates, top-performing products, and regional sales.
BI Sales Dashboard

Financial Dashboard:

  • Use Case: The financial dashboard indicates the financial performance of a company.
  • Key Metrics: Profit and loss statements, cash flow, accounts receivable/payable, and budget variances.
Business Intelligence Financial Dashboard

Marketing Agency Client Dashboard

  • Use Case: A Marketing Agency Client Dashboard provides a concise overview of a client’s marketing performance.
  • Key Metrics: Click-through rates, conversion rates, social media engagement, and return on investment (ROI).
Business Intelligence Marketing Dashboard

Healthcare Dashboard:

  • Use Case: Monitor patient outcomes and hospital performance by using a healthcare dashboard example.
  • Key Metrics: Patient wait times, bed occupancy rates, readmission rates, and medical staff productivity.
Business Intelligence Healthcare Dashboard

These examples illustrate the versatility of Business Intelligence Dashboards across various industries and functions. They engage leaders with constant bits of knowledge, improve information-driven techniques, and add to by and large business productivity and achievement.

Approach to Craft Your Business Intelligence Dashboard

We’ll divide the process into five digestible chunks.

  1. Logging in to Power BI.
  2. Creating a Data Set and Selecting the Data Set to Use in Your Sankey Chart.
  3. Adding the Power BI Sankey Diagram Extension by ChartExpo.
  4. Drawing a Sankey Diagram with ChartExpo’s BI extension.
  5. Activate your ChartExpo Trial or Apply a Subscription Key.

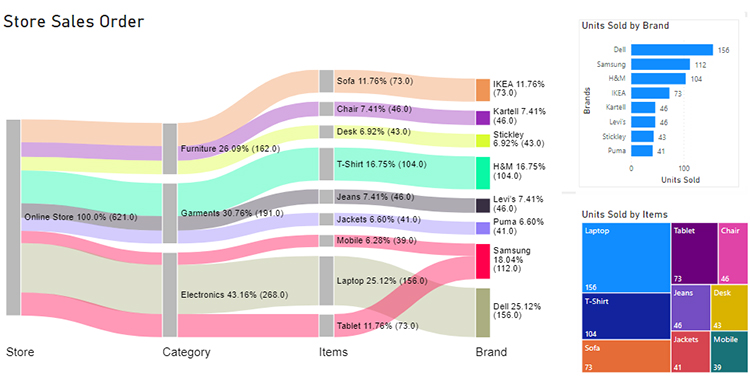
The following video will help you to create a Sankey Chart in Microsoft Power BI.

FAQs:

What are the different types of dashboards in business intelligence?

  • Strategic dashboards: provide high-level performance indicators and metrics to support strategic decision-making.
  • Operational dashboards: focus on real-time operational metrics to monitor day-to-day activities and performance.
  • Analytical dashboards: enable in-depth data analysis and exploration to uncover insights and trends.

How can a business intelligence dashboard help a business?

  1. BI dashboards provide actionable insights, enabling informed decisions based on real-time data.
  2. Businesses can track key metrics to identify trends, detect issues, and make proactive adjustments.
  3. Dashboards facilitate the sharing of performance information across teams, promoting alignment and collaboration.

Wrap Up

This dashboard can present complex data in a visually appealing and easily understandable manner. This empowers you to derive meaningful insights from your data easily.

Business intelligence is a robust and popular platform that empowers you to transform raw data into compelling visualizations. It has an intuitive interface, a wide range of data connectors, and extensive customization options. Thus, you can effortlessly build dynamic, interactive dashboards tailored to your business needs.

To get started, gather your data from various sources, such as databases, spreadsheets, or cloud services. Then, import it into business intelligence and leverage its modeling capabilities to shape and transform the data.

Next, design appealing and insightful visualizations using a combination of charts, graphs, tables, and other visual elements. Arrange your visuals into a cohesive layout, and add filters and interactivity. Then publish your dashboard for others to access and benefit from.

Remember, creating a business intelligence dashboard is an iterative process. Continuously evaluate and refine your dashboard based on user feedback, changing business needs, and emerging insights.

Embrace dedication, creativity, and a sprinkle of data wizardry with ChartExpo. Then create a dashboard in BI that drives your business toward success.

Happy dashboarding.

How much did you enjoy this article?

PBIAd1
Start Free Trial!
127384

Related articles

next previous
Power BI12 min read

Power BI Group By Guide for Effective Data Insights

Learn how Power BI Group By helps you aggregate data, clarify trends, and create reports by grouping values to make large datasets manageable & insightful.

Power BI12 min read

How to Create Sankey Diagram in Microsoft Power BI?

Learn How to Create Sankey Diagram in Microsoft Power BI using Desktop & Web Service. What they are and how to use them effectively.

Power BI8 min read

Power BI Artificial Intelligence: Insights Using Visuals

Discover all there is to know about the Power BI artificial intelligence. You'll also discover how AI is used in Power BI, and how to use it for analysis and more.

Power BI9 min read

Budgeting in Healthcare: Use Visuals to Spot Budget Gaps

This guide helps you discover what budgeting in healthcare is. You'll also discover the factors that affect hospital budgets and types of budgeting in healthcare.

Power BI9 min read

Predictive Analytics in Power BI for Making Insightful Visuals

This guide shows you everything you need to know about Predictive Analytics in Power BI. It also shows you how it works, and how to interpret the results.

ChartExpo logo

Turn Data into Visual
Stories

CHARTEXPO

  • Home
  • Gallery
  • Videos
  • Services
  • Pricing
  • Contact us
  • FAQs
  • Privacy policy
  • Terms of Service
  • Sitemap

TOOLS

  • ChartExpo for Google Sheets
  • ChartExpo for Microsoft Excel
  • Power BI Custom Visuals by ChartExpo
  • Word Cloud

CATEGORIES

  • Bar Charts
  • Circle Graphs
  • Column Charts
  • Combo Charts
  • Comparison Charts
  • Line Graphs
  • PPC Charts
  • Sentiment Analysis Charts
  • Survey Charts

TOP CHARTS

  • Sankey Diagram
  • Likert Scale Chart
  • Comparison Bar Chart
  • Pareto Chart
  • Funnel Chart
  • Gauge Chart
  • Radar Chart
  • Radial Bar Chart
  • Sunburst Chart
  • see more
  • Scatter Plot Chart
  • CSAT Survey Bar Chart
  • CSAT Survey Chart
  • Dot Plot Chart
  • Double Bar Graph
  • Matrix Chart
  • Multi Axis Line Chart
  • Overlapping Bar Chart
  • Control Chart
  • Slope Chart
  • Clustered Bar Chart
  • Clustered Column Chart
  • Box and Whisker Plot
  • Tornado Chart
  • Waterfall Chart
  • Word Cloud
  • see less

RESOURCES

  • Blog
  • Resources
  • YouTube
SIGN UP FOR UPDATES

We wouldn't dream of spamming you or selling your info.

© 2025 ChartExpo, all rights reserved.