Categories
Are you looking to understand the profound impact of a budget deficit by year graph? Visualizing a nation’s financial health through this graph is more than just a representation of numbers. It’s a profound narrative of a country’s economic journey.


A government experiences a budget deficit when its spending surpasses its income. This results in more borrowing, higher interest payments, and decreased reinvestment, ultimately impacting the subsequent year’s revenue. On the other hand, if there is a surplus, it means the income is higher than the expenses. This leads to extra funds that can be assigned elsewhere.
In the First World War, governments significantly increased fiscal deficits. How? By borrowing heavily and using up financial reserves to fund the war. This persisted until the 1960s and 1970s when global economic growth rates decreased.
The impact of budget deficits extends to the national debt. It influences the sum of annual budget deficits and the cumulative total a country owes to creditors. While discussing budget deficits, we will also examine how unexpected events and policies can result in deficits. An example would be the rise in military expenditure post the September 11 terrorist attacks.
Join us. Let’s learn how to create a budget deficit-by-year graph that vividly depicts a nation’s financial trajectory.
First…
Definition: A budget deficit occurs when expenses exceed revenues. This means the government spends more money than it collects. It is usually measured annually.
Deficits can happen for various reasons. High spending on public services or infrastructure can contribute. Decreased tax revenues during economic downturns also play a role.
Governments often borrow money to cover the deficit. This increases the national debt. As a result, persistent budget deficits can lead to large debts over time.
There are short-term and long-term impacts. In the short term, deficits can stimulate economic growth. They may lead to higher interest rates and inflation in the long term.
Managing a budget deficit requires careful planning. Governments may need to cut spending or raise taxes. Balancing the budget is crucial for economic stability.
Understanding budget deficits helps in comprehending the government’s financial health. It also highlights the importance of responsible fiscal policies.
A budget deficit might sound like financial jargon, but it affects everyone. Imagine if you spent more money than you earned month after month. Eventually, you’d accumulate a lot of debt, right? The same thing happens on a national scale when governments run budget deficits. Here’s why it matters:
Budget deficits often boil down to simple scenarios we can all relate to. Here are common causes that contribute to a budget deficit:
A budget deficit might sound like an abstract concept. However, its effects can ripple through the economy in ways that touch everyone’s lives. Here are the key effects of a budget deficit:
Reducing a budget deficit can be daunting. However, it is crucial for maintaining economic stability and ensuring a prosperous future. Governments employ a variety of strategies to tackle budget deficits. Here are common approaches:
Calculating a budget deficit can sound daunting, but it’s quite straightforward once you break it down. Think of it like balancing your checkbook but on a national scale.
Here’s a step-by-step guide on how to calculate a budget deficit by year:
Budget Deficit = Total Expenditures – Total Revenues
Ah, the joy of data analysis It’s like solving a mystery but with spreadsheets. Data visualization reveals the tale of budget deficits over the years.
However, Excel can feel like a straightjacket for creativity when visualizing budget deficit data. That’s where ChartExpo comes in, offering a solution to Excel’s limitations. It unlocks the power of data visualization to transform budget deficit data into a captivating tale.
With ChartExpo, data analysis becomes a visual journey, not a battle with cells and formulas.
Let’s learn how to install ChartExpo in Excel.
ChartExpo charts are available both in Google Sheets and Microsoft Excel. Please use the following CTAs to install the tool of your choice and create beautiful visualizations with a few clicks in your favorite tool.


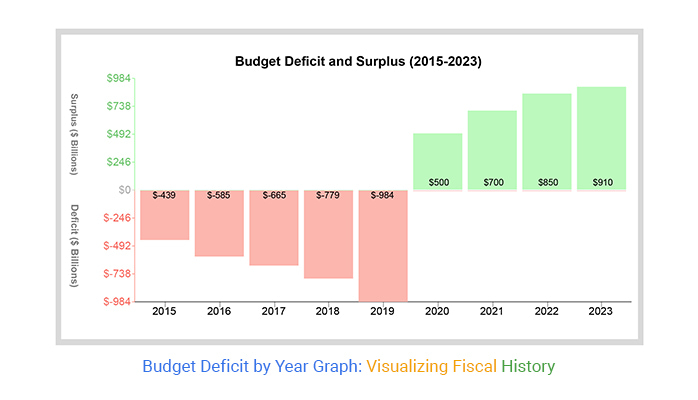
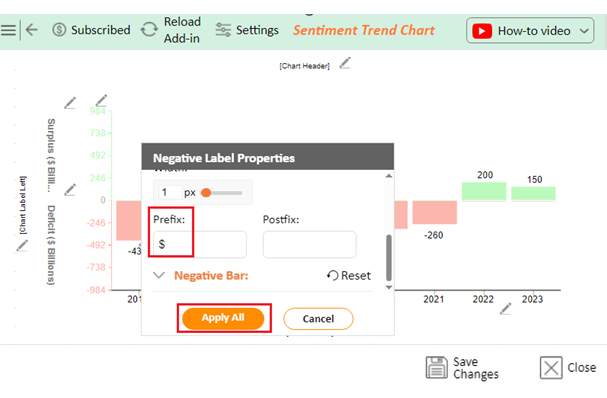
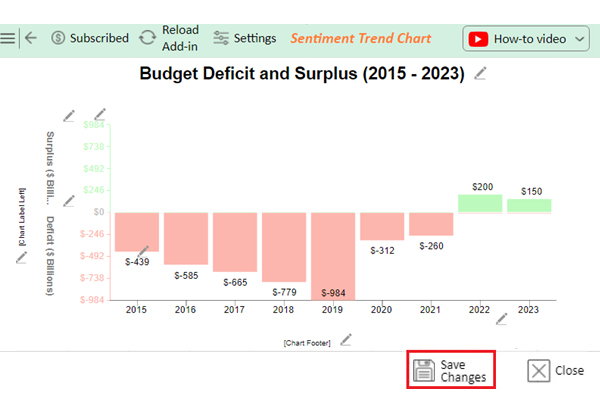
Let’s create a graph of the budget deficit example data below using ChartExpo.
| Year | Surplus ($ Billions) | Deficit ($ Billions) |
| 2015 | 0 | -439 |
| 2016 | 0 | -585 |
| 2017 | 0 | -665 |
| 2018 | 0 | -779 |
| 2019 | 0 | -984 |
| 2020 | 0 | -312 |
| 2021 | 0 | -260 |
| 2022 | 200 | 0 |
| 2023 | 150 | 0 |


A deficit in a budget means expenses exceed income. It indicates financial imbalance. Governments or individuals may face deficits when their spending surpasses revenue. Deficits often require borrowing to cover expenses, impacting future finances and economic stability.
A deficit is a shortage or lack of funds, usually in a financial setting. It occurs when spending surpasses earnings or income. Governments, businesses, and individuals may face deficits, requiring actions such as borrowing to compensate for the shortfall.
A budget deficit is usually viewed as a concern. It can indicate excessive spending, resulting in higher debt and interest charges. Yet, in certain scenarios, such as when facing economic declines, deficits can strategically spur growth and aid recovery endeavors.
Creating a budget deficit graph by year is a valuable exercise. It helps visualize financial trends and understand economic health.
First, gather historical financial data. Collect total revenue and expenditure figures for each year. Ensure data accuracy by using official government sources. This data will form the basis of your graph.
Next, calculate the budget deficit for each year. Subtract the total revenues from total expenditures for each year. Record these deficit values systematically. This will provide the numerical data needed for the graph.
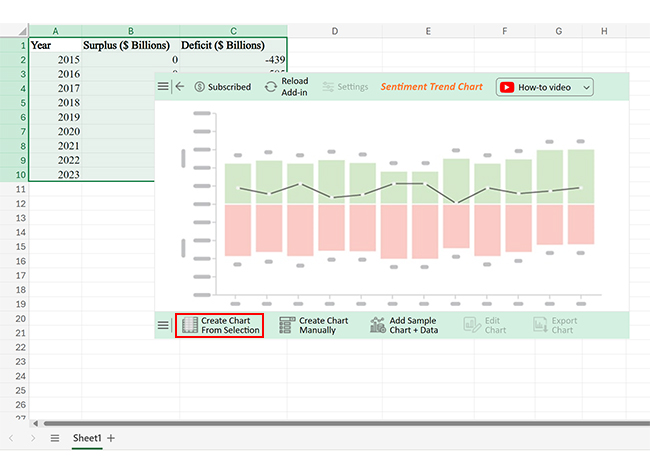
Then, organize the data in a spreadsheet. Use software like Excel or Google Sheets. Create two columns: one for the years and one for the corresponding deficits. Enter your calculated deficit values next to their respective years.
Now, it’s time to create the graph. Highlight the data columns in your spreadsheet. Use the “Insert” function to select a chart. A chart effectively shows changes over time. Label your axes clearly: “Year” on the x-axis and “Budget Deficit” on the y-axis.
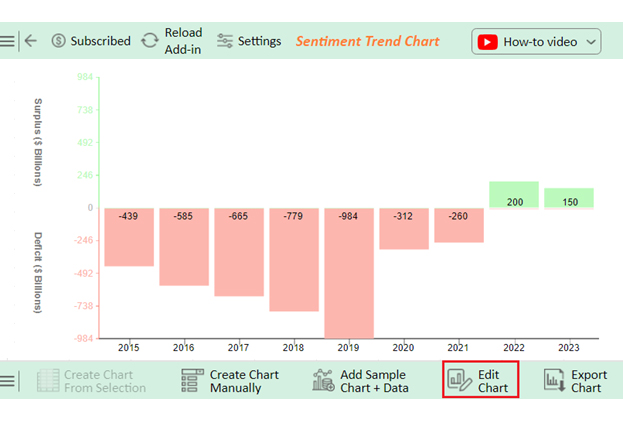
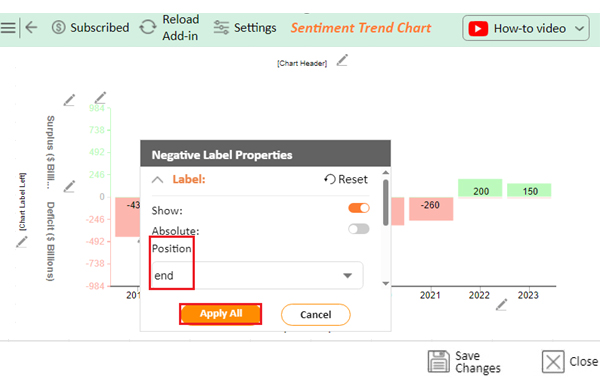
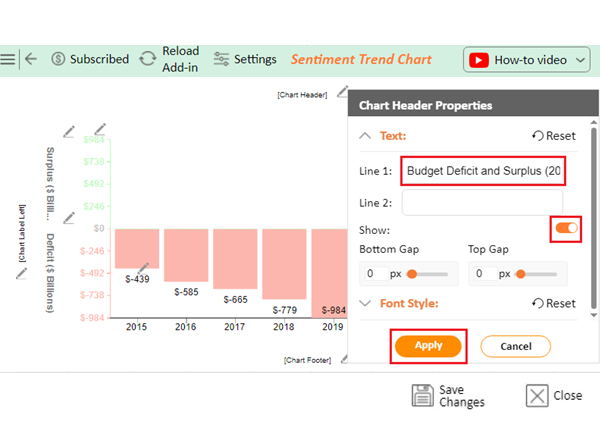
Finally, customize the graph for clarity. Add a title that explains the graph’s content, such as “Annual Budget Deficit Over Time”. Use gridlines to make reading the graph easier. Consider adding data labels to each point for precision.
In summary, creating a budget deficit graph by year is simple with the right steps:
Understanding how to create a budget deficit by year graph is a valuable skill. It provides insights into economic health and fiscal management. This visual representation helps identify trends and anomalies, aiding in making informed financial decisions.
Do not hesitate.
Use this method to understand better and communicate budget deficits.
How much did you enjoy this article?


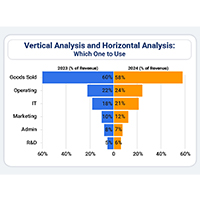
Vertical analysis and horizontal analysis reveal how financial statements shift over time and within a period. Learn both methods now!
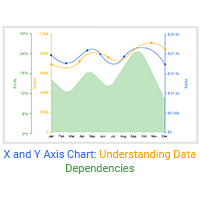
Learn how to create effective X and Y-axis charts in Excel. And use it for sales performance,identify trends and business success growth.
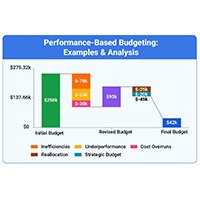
Performance-based budgeting links spending to measurable results. Explore how it works, see examples, benefits, challenges, and analyze PBB in Excel.