• Home
  • Tools dropdown img
    • Spreadsheet Charts

      • ChartExpo for Google Sheets
      • ChartExpo for Microsoft Excel
    • Power BI Charts

      • Power BI Custom Visuals by ChartExpo
    • Word Cloud

  • Charts dropdown img
    • Chart Category

      • Bar Charts
      • Circle Graphs
      • Column Charts
      • Combo Charts
      • Comparison Charts
      • Line Graphs
      • PPC Charts
      • Sentiment Analysis Charts
      • Survey Charts
    • Chart Type

      • Box and Whisker Plot
      • Clustered Bar Chart
      • Clustered Column Chart
      • Comparison Bar Chart
      • Control Chart
      • CSAT Survey Bar Chart
      • CSAT Survey Chart
      • Dot Plot Chart
      • Double Bar Graph
      • Funnel Chart
      • Gauge Chart
      • Likert Scale Chart
      • Matrix Chart
      • Multi Axis Line Chart
      • Overlapping Bar Chart
      • Pareto Chart
      • Radar Chart
      • Radial Bar Chart
      • Sankey Diagram
      • Scatter Plot Chart
      • Slope Chart
      • Sunburst Chart
      • Tornado Chart
      • Waterfall Chart
      • Word Cloud
    • Google Sheets
      Microsoft Excel
  • Services
  • Pricing
  • Contact us
  • Blog
  • Support dropdown img
      • Gallery
      • Videos
      • Contact us
      • FAQs
      • Resources
    • Please feel free to contact us

      atsupport@chartexpo.com

Categories
All Data Visualizations Data Analytics Surveys
Add-ons/
  • Google Sheets
  • Microsoft Excel
  • Power BI
All Data Visualizations Data Analytics Surveys
Add-ons
  • Google Sheets
  • Microsoft Excel
  • Power BI

We use cookies

This website uses cookies to provide better user experience and user's session management.
By continuing visiting this website you consent the use of these cookies.

Ok

ChartExpo Survey


Home > Blog > Microsoft Excel

What is a Good Price-to-Earnings Ratio? Grasp Insights

Are you curious about what is a good price-to-earnings ratio and how it impacts your investment decisions?

What is a Good Price-to-Earnings Ratio

You’re not alone. The P/E ratio has been the subject of many a heated debate among investors, analysts, and even armchair economists. This blog post will answer this question and show you how to leverage this metric for investment decision-making.

The price-to-earnings (P/E) ratio is determined by dividing a stock’s current market price by its earnings per share (EPS). It provides insight into how much investors are willing to pay for a company’s earnings. A high P/E ratio suggests that investors expect higher earnings growth. Conversely, a low P/E ratio may indicate undervaluation or a lack of confidence in the company’s prospects.

Market analysts say a good P/E ratio can vary significantly depending on the industry and market conditions. For instance, growth stocks typically command higher P/E ratios due to their potential for substantial earnings growth. On the other hand, established companies in stable industries may have lower P/E ratios. Therefore, understanding these nuances is essential for gauging whether a stock is undervalued, overvalued, or priced just right.

Prepare to be enlightened, entertained, and equipped to conquer the P/E ratio maze. It’s time to demystify the numbers and pave your way to investment glory!

Table of Contents:

  1. What is the Price-to-Earnings Ratio?
  2. What is a Good Price-to-Earnings Ratio?
  3. Why is the Price-to-Earnings Ratio Important?
  4. How to Tell If a P/E Ratio Is Good or Bad?
  5. How to Calculate the Price-to-Earnings Ratio?
  6. How to Examine Price-to-Earnings Ratio?
  7. What are the Limitations of the P/E Ratio?
  8. Wrap Up

First…

What is the Price-to-Earnings Ratio?

Definition: Price-to-earnings ratio (P/E Ratio) is a financial metric that provides insights into a company’s valuation.
The calculation involves dividing the market price per share by the earnings per share (EPS) to derive the P/E ratio. It answers the question: How much are investors willing to pay for each dollar of a company’s earnings? Investors use it to assess potential investments and make decisions based on the perceived company earnings value.

A high P/E ratio might indicate investors’ optimism about future growth but could also suggest overvaluation. Conversely, a low P/E ratio might signal undervaluation or a lack of confidence in the company’s prospects.

Understanding what is a good P/E ratio involves considering industry benchmarks and the company’s growth trajectory. Moreover, it’s a dynamic metric, fluctuating with market sentiment and economic conditions.

What is a Good Price-to-Earnings Ratio?

When determining what constitutes a “good” P/E ratio, the answer isn’t one-size-fits-all. It is nuanced and dependent on various factors. A lower P/E ratio suggests a potentially undervalued stock, while a higher ratio may indicate market optimism. However, what constitutes a good P/E ratio varies across industries and sectors.

In industries with high growth expectations, like technology, a higher P/E ratio might be acceptable. Conversely, stable sectors such as utilities may have lower average ratios.

Investors often compare a company’s P/E ratio to its historical values or industry peers for context. Rapidly growing companies may justify higher ratios due to expected future earnings.

A “good” P/E ratio is subjective, considering risk tolerance and investment strategy. A lower P/E may be preferable for value investors, signaling potential bargains. Growth investors might tolerate higher ratios for promising future returns.

Moreover, economic conditions and market sentiment influence P/E ratios. P/E ratios may contract during economic downturns, making historically high P/E stocks appear more attractive.

In summary, determining what is a good price-to-earnings ratio involves the following:

  • Evaluating a company’s unique circumstances.
  • Evaluating industry benchmarks.
  • Aligning it with your investment objectives and risk tolerance.

Successful interpretation of P/E ratios requires a comprehensive analysis considering these multifaceted factors.

Why is the Price-to-Earnings Ratio Important?

The price-to-earnings (P/E) ratio is a compass guiding investment decisions. Understanding its significance unveils a powerful tool ideal for navigating the complex landscape of stock markets. Here are the reasons why it is important.

  • Valuation assessment: The P/E ratio is a key metric for assessing a stock’s valuation.
    It signifies the amount investors are ready to invest for every dollar of earnings. Consequently, it provides insights into the market’s perception of a company’s growth and potential profitability.
  • Investor sentiment gauge: As a barometer of investor sentiment, the P/E ratio reflects market expectations. A high ratio may signal optimism about future earnings, while a lower ratio may indicate skepticism or conservative projections.
  • Comparative analysis: Investors use the P/E ratio for comparative analysis within industries or against historical data. This facilitates the identification of potentially undervalued or overvalued stocks, helping make informed investment decisions.
  • Growth expectations: A higher P/E ratio might be acceptable in high-growth industries as investors anticipate robust future earnings. Conversely, stable industries may see lower P/E ratios reflecting more modest growth expectations.
  • Risk assessment: The P/E ratio aids risk assessment by providing a snapshot of market perceptions. You can gauge the level of risk associated with a stock based on its P/E ratio. This contributes to a more comprehensive risk management strategy.

How can You Determine if a P/E Ratio is Favorable or Unfavorable?

When navigating the financial seas, investors often ask: “How do I tell if a P/E ratio is a golden ticket or a red flag?” Let’s unravel this mystery by examining key factors determining whether a P/E ratio is good or bad.

  1. Compare to industry peers: Assess the P/E ratio in the industry context. A higher ratio than peers might be acceptable in a high-growth sector, signaling optimism. On the other hand, a lower ratio could indicate undervaluation or market skepticism.
  2. Historical comparison: Look back in time. Compare the current P/E ratio with the company’s historical averages. A significant deviation may warrant investigation ”“ is it due to changed market sentiment or shifts in the company’s fundamentals?
  3. Growth prospects: Consider growth expectations. A higher P/E ratio might be justified in industries with high growth potential as investors anticipate robust future earnings. Low-growth industries may see lower ratios.
  4. Market conditions: Evaluate broader market conditions. Economic downturns can deflate P/E ratios, making historically high P/E stocks more attractive. Conversely, bullish markets may tolerate higher ratios.
  5. Risk tolerance: Assess your risk tolerance. What might be deemed a good P/E ratio depends on your investment strategy and willingness to embrace risk. Consider your comfort level and align the P/E ratio with your investment goals.

How to Calculate the Price-to-Earnings Ratio?

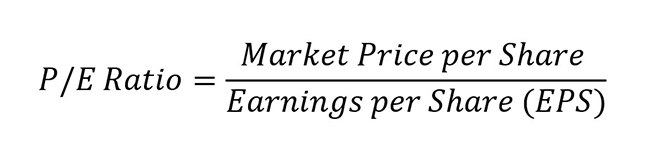
The P/E ratio is derived by dividing a stock’s current market price by its earnings per share (EPS). The price-to-earnings (P/E) ratio formula is as follows:

What is a Good Price-to-Earnings Ratio Formula
  • The current market price of a stock is available on financial news websites, stock exchanges, or brokerage platforms.
  • To calculate the earnings per share (EPS), you divide the net income (after taxes and preferred stock dividends) by outstanding common stock shares.

Example: Consider Company XYZ, whose current market price per share is $50, and its earnings per share is $5.

What is a Good Price-to-Earnings Ratio Calculation

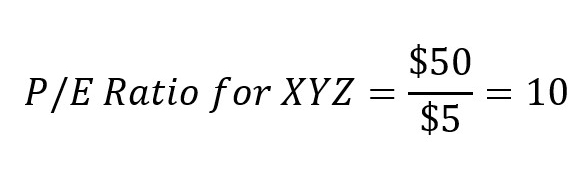
This implies that investors are willing to pay $10 for every $1 of earnings generated by the company. Interpretation of this ratio depends on factors such as industry norms, growth prospects, and individual investor preferences.

How to Examine Price-to-Earnings Ratio?

Cracking the data analysis code can feel like navigating a labyrinth with a blindfold. But don’t worry; data visualization provides a compass when unraveling the mysteries of the price-to-earnings ratio. Yet, Excel, the stalwart analysts’ companion, often struggles to paint a vivid picture with its static charts and graphs. This leaves the P/E ratio narrative lackluster.

Fear not, for ChartExpo comes in to liberate us from the monotonous shackles of Excel. It breathes vibrancy and interactivity into Excel’s data visualization capabilities. Consequently, the price-to-earnings ratio saga transforms from a mundane tale to an enthralling and insightful expedition.

Let’s learn how to install ChartExpo in Excel.

  1. Open your Excel application.
  2. Open the worksheet and click the “Insert” menu.
  3. You’ll see the “My Apps” option.
  4. In the Office Add-ins window, click “Store” and search for ChartExpo on my Apps Store.
  5. Click the “Add” button to install ChartExpo in your Excel.

ChartExpo charts are available both in Google Sheets and Microsoft Excel. Please use the following CTAs to install the tool of your choice and create beautiful visualizations with a few clicks in your favorite tool.

Example

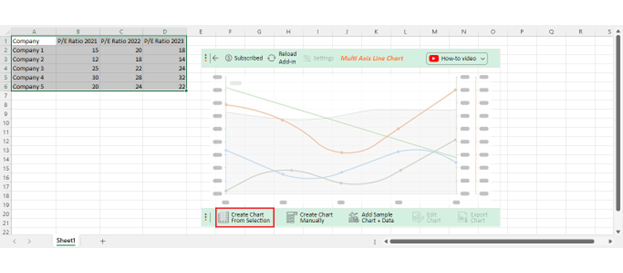
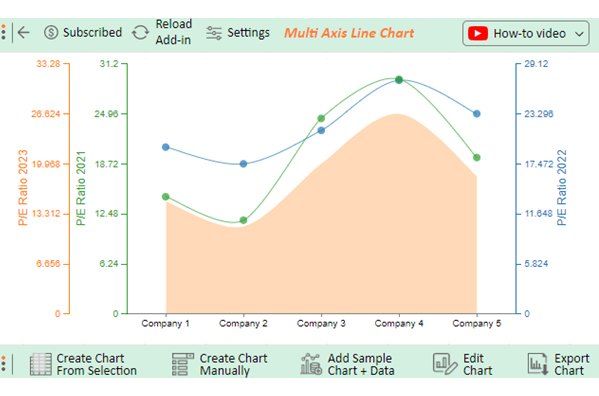
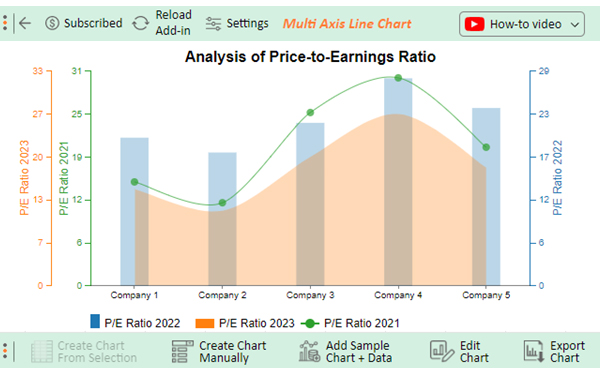
Let’s say you have the P/E ratio sample data below.

Company P/E Ratio 2021 P/E Ratio 2022 P/E Ratio 2023
Company 1 15 20 18
Company 2 12 18 14
Company 3 25 22 24
Company 4 30 28 32
Company 5 20 24 22

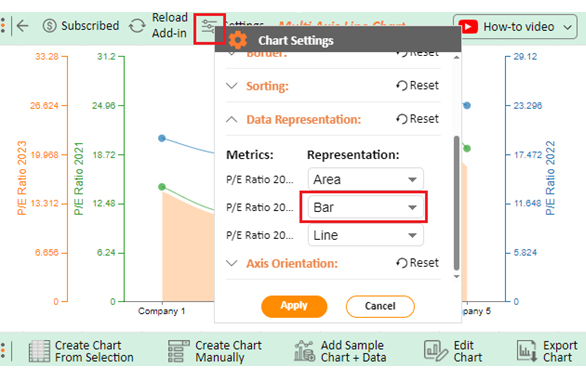
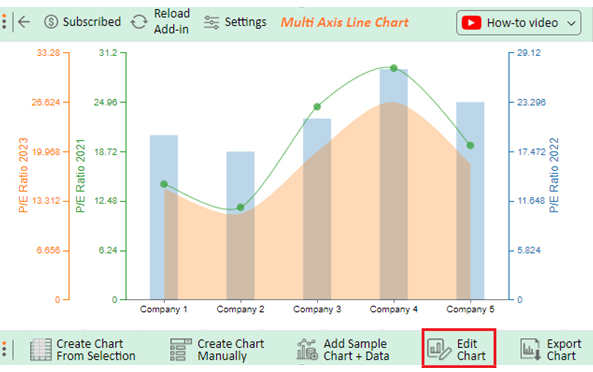
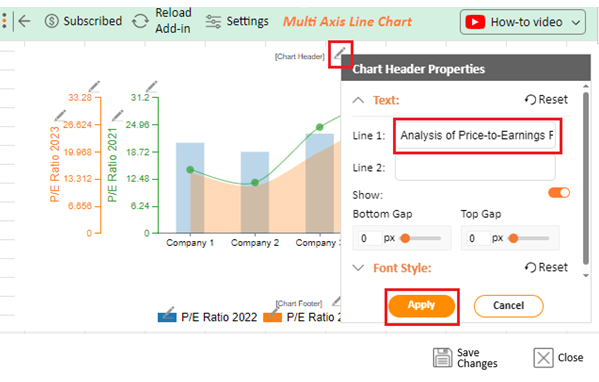
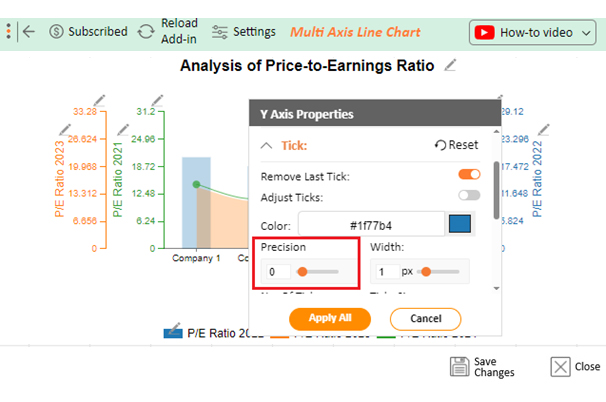
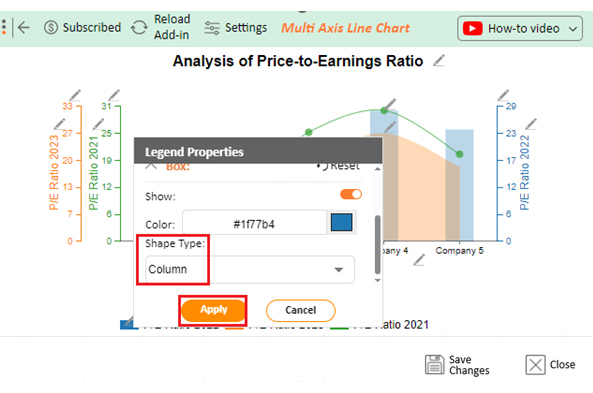
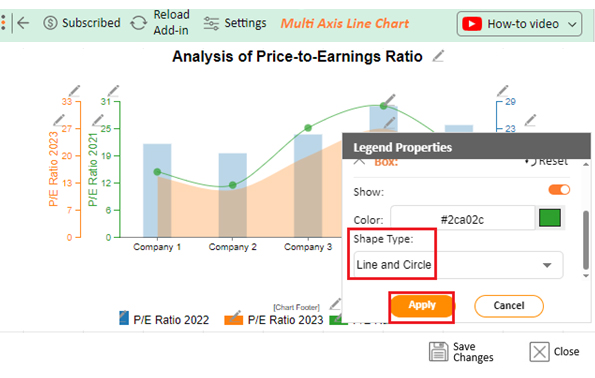
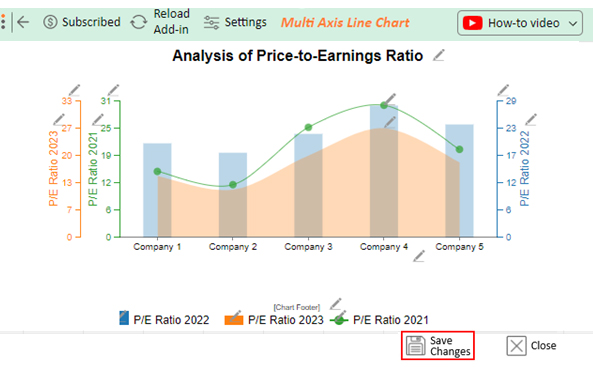
Follow these steps to create a visualization in Excel using CharExpo and glean valuable insights.

  • To get started with ChartExpo, install ChartExpo in Excel.
  • Now Click on My Apps from the INSERT menu.
insert chartexpo in excel
  • Choose ChartExpo from My Apps, then click Insert.
open chartexpo in excel
  • Once it loads, scroll through the charts list to locate and choose the “Multi-Axis Line Chart”.
search multi axis line chart in excel
  • Click the “Create Chart From Selection” button after selecting the data from the sheet, as shown.
Create Chart From Selection After Learning What is a Good Price-to-Earnings Ratio
  • ChartExpo will generate the visualization below for you.
Initial Chart After Learning What is a Good Price-to-Earnings Ratio
  • Click on Settings and change the “Data Representation” as follows.
Change Data Representation After Learning What is a Good Price-to-Earnings Ratio
  • If you want to add anything to the chart, click the Edit Chart button:
Edit Chart After Learning What is a Good Price-to-Earnings Ratio
  • Click the pencil icon next to the Chart Header to change the title.
  • It will open the properties dialog. Under the Text section, you can add a heading in Line 1 and enable Show.
  • Give the appropriate title of your chart and click the Apply button.
Add Title of Chart After Learning What is a Good Price-to-Earnings Ratio
  • Change the precision value of all Ratios as shown below:
Change Precision After Learning What is a Good Price-to-Earnings Ratio
  • Change the Legend shape of P/E Ratio 2022 to Column and click the Apply button.
Change Legends of After Learning What is a Good Price-to-Earnings Ratio
  • Change the Legend shape of P/E Ratio 2021 into a Line and Circle and click the Apply button.
Apply Changes of Lengends After Learning What is a Good Price-to-Earnings Ratio
  • Click the Save Changes button to persist the changes made to the chart.
Save Changes of Lengends After Learning What is a Good Price-to-Earnings Ratio
  • Your final Multi Axis Line Chart will look like the one below.
Final What is a Good Price-to-Earnings Ratio

Insights

  • Company 4 consistently boasts the highest P/E ratio, reflecting investor confidence and potential high growth expectations.
  • Company 2 exhibits varying P/E ratios, signaling market perception volatility.
  • Company 3 displays stability, featuring a marginal increase in its P/E ratio.
  • Companies 1 and 5 show modest upticks in their P/E ratios.

What are the Limitations of the P/E Ratio?

While the price-to-earnings (P/E) ratio is a stalwart in financial analysis, it has limitations. Understanding these constraints will help you navigate the intricate terrain of stock valuation smoothly.

  • Dependence on earnings: The P/E ratio heavily relies on reported earnings, which may fluctuate due to accounting practices. This dependence can lead to misinterpretations if earnings are manipulated or subject to volatility.
  • Ignored growth prospects: P/E ratios might overlook a company’s growth potential. High-growth firms may have elevated P/E ratios, potentially undervaluing their prospects.
  • Industry variations: Industries exhibit diverse P/E norms. Comparing ratios across sectors may not offer a clear picture, as acceptable P/E values differ significantly.
  • Cyclical nature: Economic cycles impact P/E ratios. During economic downturns, P/E ratios may spike, potentially signaling an overvaluation. On the other hand, contractions might render stocks undervalued.
  • Short-term focus: P/E ratios often reflect short-term perspectives. Investors fixated on immediate gains might overlook companies with promising long-term prospects but lower current earnings.
  • Omitted risk factors: P/E ratios omit risk considerations. Companies with similar ratios may differ in risk profiles, making evaluations beyond this metric essential.
  • Variability in earnings: Earnings can be erratic. Temporary disruptions or windfalls can distort P/E ratios, necessitating a thorough examination of earnings stability for accurate assessments.

FAQs

Is 30 a good PE ratio?

A P/E ratio of 30 is subjective. In certain industries, it might indicate optimism and growth potential. However, in others, it might be considered high. Context matters; compare it to industry averages and the company’s historical ratios for a more informed evaluation.

What does a high PE ratio mean?

A high P/E ratio often suggests investors expect robust future earnings growth. It might indicate optimism about the company’s prospects. However, caution is warranted, as excessively high ratios may signal overvaluation. This necessitates a thorough analysis of market conditions and industry standards.

How do you interpret the PE ratio?

Interpreting the P/E ratio involves assessing valuation and investor sentiment. A higher ratio may indicate optimism and growth expectations. Conversely, a lower ratio might suggest undervaluation. Compare it to industry norms and historical data for a comprehensive analysis.

Wrap Up

Determining what is a good price-to-earnings (P/E) ratio requires a nuanced approach. Armed with this knowledge, investors become adept navigators in the complex seas of stock valuation.

The ability to compare P/E ratios to industry peers offers a valuable benchmark. A higher P/E may be acceptable in sectors with high growth potential. Conversely, a lower ratio might be justified in more stable industries. This comparative analysis provides a crucial lens through which you can discern the relative attractiveness of a stock.

Examining historical data becomes an indispensable tool. A company’s current P/E ratio gains significance when viewed against its past performance. Deviations from historical averages can signal shifts in market sentiment or the company’s fundamentals, prompting further investigation.

Considering growth prospects is integral. High-growth companies may command higher P/E ratios, reflecting optimism about future earnings. You need to balance these expectations with the inherent risks associated with such investments.

Ultimately, what is a good P/E ratio resides at the intersection of industry norms, historical benchmarks, and individual risk tolerance. Armed with this holistic understanding, you can navigate the intricate world of P/E ratios. It will help you make informed decisions that align with your financial goals and risk appetite.

How much did you enjoy this article?

ExcelAd1
Start Free Trial!
134704

Related articles

next previous
Microsoft Excel8 min read

Excel Task Tracker Template for Smarter Task Insights

Task tracker template in Excel organizes tasks, tracks deadlines, and boosts efficiency. Learn its benefits, and explore expert tips to simplify task management.

Microsoft Excel10 min read

Invoice Tracker Template in Excel for Better Insights

An invoice tracker Excel template helps track invoices, due dates, and payments. Learn how to use this template for better financial management.

Microsoft Excel12 min read

Key Performance Indicators in Healthcare for Better Insights

Key Performance Indicators in healthcare track patient care and efficiency. Learn about these KPIs, top examples, and how to use them to improve outcomes.

Microsoft Excel10 min read

BMI Calculation Formula in Excel for Better Fitness Insights

The BMI calculation formula in Excel helps track and analyze body mass index. Explore step-by-step instructions and tips to simplify BMI tracking in Excel.

Microsoft Excel29 min read

How to Create a Tornado Chart in Excel? A Complete Guide

Click to learn how to plot a Tornado Chart in Excel using easy-to-follow steps. Also, we’ll address the following question: what is a Tornado Diagram?

ChartExpo logo

Turn Data into Visual
Stories

CHARTEXPO

  • Home
  • Gallery
  • Videos
  • Services
  • Pricing
  • Contact us
  • FAQs
  • Privacy policy
  • Terms of Service
  • Sitemap

TOOLS

  • ChartExpo for Google Sheets
  • ChartExpo for Microsoft Excel
  • Power BI Custom Visuals by ChartExpo
  • Word Cloud

CATEGORIES

  • Bar Charts
  • Circle Graphs
  • Column Charts
  • Combo Charts
  • Comparison Charts
  • Line Graphs
  • PPC Charts
  • Sentiment Analysis Charts
  • Survey Charts

TOP CHARTS

  • Sankey Diagram
  • Likert Scale Chart
  • Comparison Bar Chart
  • Pareto Chart
  • Funnel Chart
  • Gauge Chart
  • Radar Chart
  • Radial Bar Chart
  • Sunburst Chart
  • see more
  • Scatter Plot Chart
  • CSAT Survey Bar Chart
  • CSAT Survey Chart
  • Dot Plot Chart
  • Double Bar Graph
  • Matrix Chart
  • Multi Axis Line Chart
  • Overlapping Bar Chart
  • Control Chart
  • Slope Chart
  • Clustered Bar Chart
  • Clustered Column Chart
  • Box and Whisker Plot
  • Tornado Chart
  • Waterfall Chart
  • Word Cloud
  • see less

RESOURCES

  • Blog
  • Resources
  • YouTube
SIGN UP FOR UPDATES

We wouldn't dream of spamming you or selling your info.

© 2025 ChartExpo, all rights reserved.