Categories
When it comes to making financial decisions, understanding the difference between interest rate vs. yield is crucial. It unlocks the door to financial wisdom. However, as much as these two terms are commonly used in finance, they are often misunderstood.


This blog post seeks to demystify the difference between interest rate vs. yield.
At its core, interest rate vs. yield can be likened to the concept of cost versus return. The interest rate refers to the cost of borrowing money. Or the return on an investment, expressed as a percentage.
On the other hand, yield represents the earnings generated on an investment over a specific period. It factors in the interest rate and other potential returns. This understanding is crucial for comprehending the impact of these metrics on various financial instruments and markets.
Prepare to unravel the enigma that has puzzled many a financial enthusiast. We’ll navigate the labyrinth of interest rates, bond yields, and investment returns. This will equip you with a newfound understanding of how these factors shape our financial landscape.
So, fasten your seatbelt – let’s embark on a captivating odyssey through interest rate vs. yield.
First…
Let’s delve into an in-depth understanding of interest rate vs. yield:
Definition: Interest rate is the cost of borrowing money. It’s a percentage charged by lenders on the principal amount. The rate varies based on economic conditions, central bank policies, and individual creditworthiness.
Low interest rates encourage borrowing and spending, stimulating the economy. Conversely, high rates can curb inflation but may slow economic growth. Understanding the interest rate is crucial for individuals, businesses, and policymakers.
It impacts mortgage rates, credit card payments, and investment returns. Additionally, knowing how to calculate return on investment capital can help assess the effectiveness of your investments with interest rates.
It’s a dynamic factor influencing decisions ranging from savings and loans to investments and monetary policy. Keep an eye on interest rates to navigate the financial landscape wisely and make informed financial decisions.
Definition: Yield refers to the return on an investment, usually expressed as a percentage. It represents the income generated from an investment relative to its cost. For bonds, yield is the annual interest divided by the bond’s current market price.
In the stock market, it’s the dividend income divided by the stock price. There are various types of yield, such as current yield, dividend yield, and yield to maturity. Understanding yield is essential for investors as it provides insights into the profitability of an investment.
High yield may indicate higher risk or potentially higher returns. On the other hand, low yield may suggest a safer but less lucrative investment. In the dynamic world of finance, yield is a critical metric for evaluating and comparing investment opportunities.
While interest rate vs. yield are crucial in finance, they have distinct roles. Let’s unravel their differences, shedding light on their unique characteristics.
| Aspect | Interest Rate | Yield |
| Definition | The cost of borrowing or return on investment, is expressed as a percentage. | The return on an investment relative to its cost is also expressed as a percentage. |
| Components | Determined by lenders or central banks based on economic conditions and creditworthiness. | Calculated based on specific investment types, like bonds or stocks, and includes various components like dividends or coupon payments. |
| Role | Regulates borrowing and spending in the economy; a tool for monetary policy. | Indicates the profitability of an investment, helping investors assess potential returns. |
| Influence | Affected by central bank policies, inflation, and economic factors. | Influenced by factors like market demand, coupon payments, and dividend distributions. |
| Application | Applies broadly to loans, credit cards, and financial products. | Relevant to specific investments such as bonds, stocks, or real estate. |
| Risk and Return | Generally lower risk and the return is straightforward, as in fixed-rate loans. | Can vary in risk, with higher yields often associated with higher-risk investments. |
Interest rate vs. yield plays a pivotal role in various financial instruments. They influence decisions in bond investments, mortgage financing, and savings accounts. Let’s unravel the distinct use cases of interest rates and yields in these domains.
Interest rates in bond investments are akin to the heartbeat of the fixed-income market, distinguishing Fixed Income vs Equity. They represent the cost of borrowing for the issuer and serve as a crucial factor for investors.
Existing bond prices tend to fall when interest rates rise, affecting the yield. Conversely, lower interest rates may increase bond prices, leading to a lower yield. Investors keenly monitor these fluctuations as they impact the attractiveness of bonds as investment vehicles.
For individuals aspiring to own homes, interest rates are the lighthouse guiding their mortgage journey. Mortgage interest rates directly influence monthly payments and the overall cost of homeownership. A lower interest rate translates to reduced monthly payments and long-term interest expenses.
In the context of mortgage-backed securities, yield reflects the return for investors participating in these financial instruments. Understanding these rates empowers homebuyers and investors to make data-driven decisions in the real estate market.
Interest rates in savings accounts act as the silent architects shaping the growth of deposited funds. When you deposit money in a savings account, the interest rate determines how your balance will increase. A higher interest rate implies faster growth for your savings.
In this context, yield signifies the overall return on your savings investment. Financial institutions often compete to offer attractive interest rates and yields to attract savers. This makes it imperative to seek optimal returns on your deposits.
Interest rates and yields take center stage in finance, influencing various economic aspects. Understanding their importance is akin to decoding the language of money. Let’s delve into the significance of interest rates and yields across various dimensions.
The interest rate, calculated using simple interest, is determined by the formula:

Example: Let’s say you invest $5,000 in a savings account, and after one year, the interest earned is $250. The interest rate would be;

For bonds or income-generating investments, there are different yield calculations:
Current Yield:

Yield on Cost:

Example: Consider a bond with a face value of $1,000, a current market price of $950, and an annual interest payment of $50.
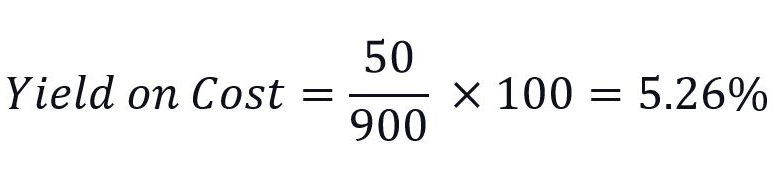
Assuming the bond was initially purchased for $900,
Ah, the tangled web of interest rate vs. yield data analysis – a puzzle worth cracking. However, tackling this financial riddle is like finding a needle in a haystack. This is where data visualization comes in to make data analysis a breeze.
Excel, while handy, falters in bringing this data to life, leaving us yearning for clarity. But don’t worry. ChartExpo swoops in as the knight in shining armor, offering a visual feast for our data-hungry minds.
Let’s learn how to install ChartExpo in Excel.
ChartExpo charts are available both in Google Sheets and Microsoft Excel. Please use the following CTA’s to install the tool of your choice and create beautiful visualizations in a few clicks in your favorite tool.
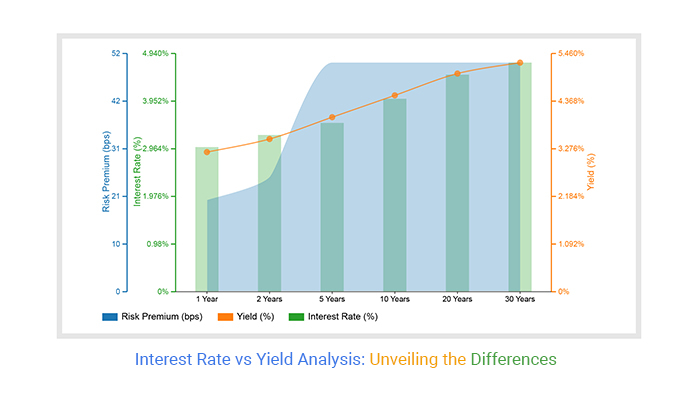
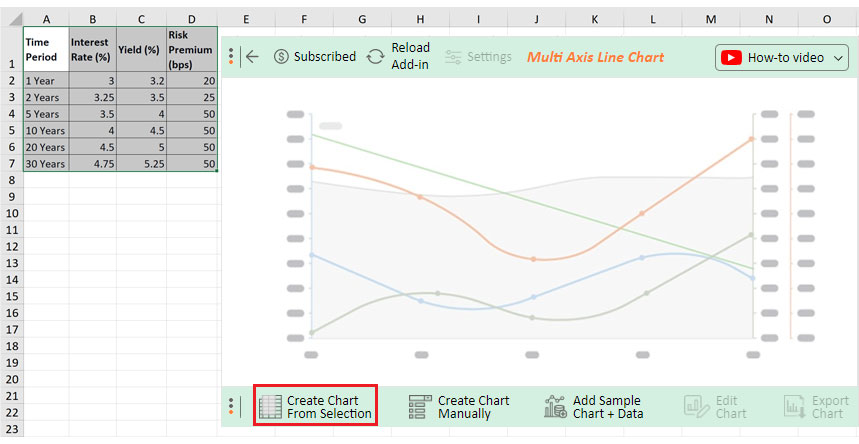
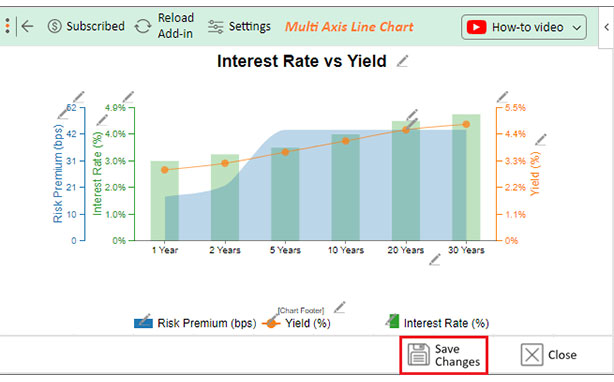
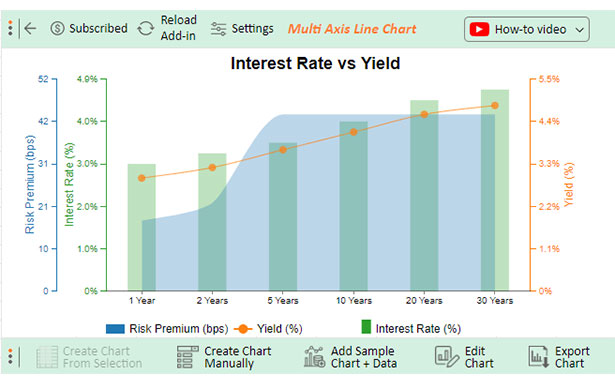
Let’s say you want to analyze the interest rate vs. yield sample data below.
| Time Period | Interest Rate (%) | Yield (%) | Risk Premium (bps) |
| 1 Year | 3 | 3.2 | 20 |
| 2 Years | 3.25 | 3.5 | 25 |
| 5 Years | 3.5 | 4 | 50 |
| 10 Years | 4 | 4.5 | 50 |
| 20 Years | 4.5 | 5 | 50 |
| 30 Years | 4.75 | 5.25 | 50 |
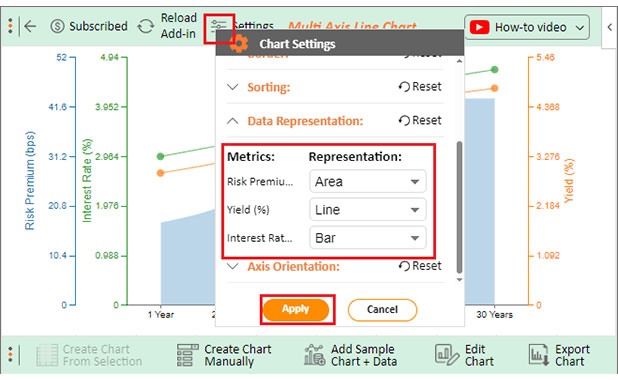
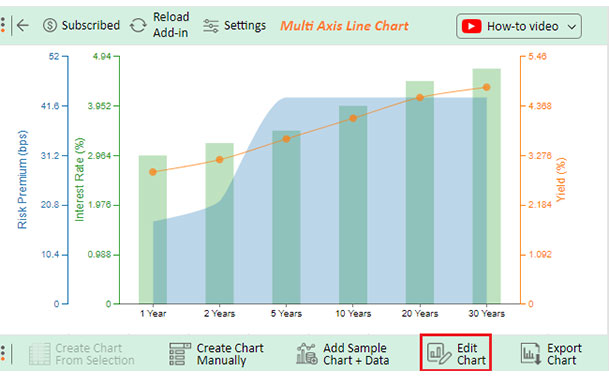
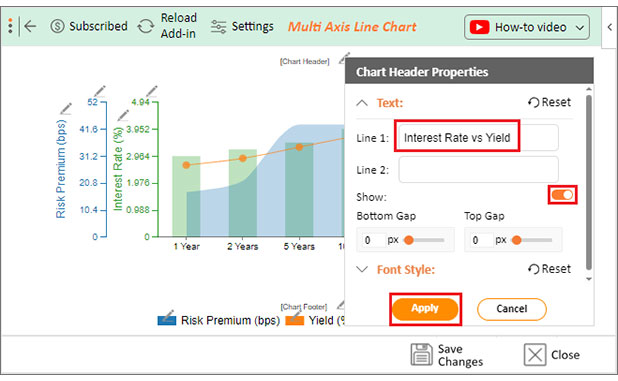
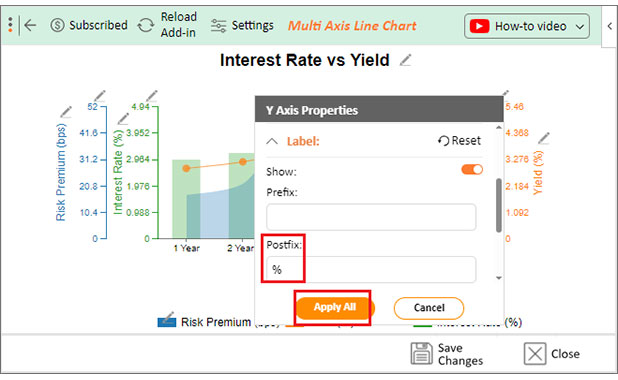
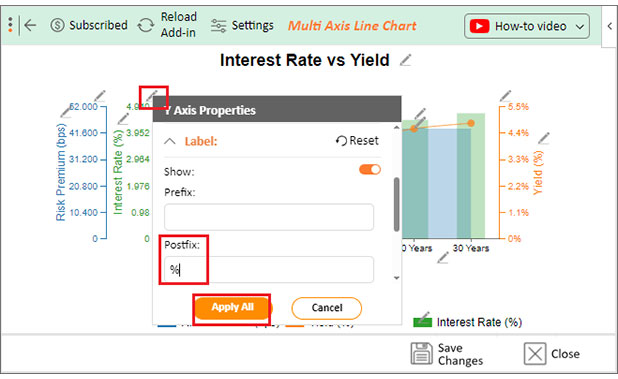
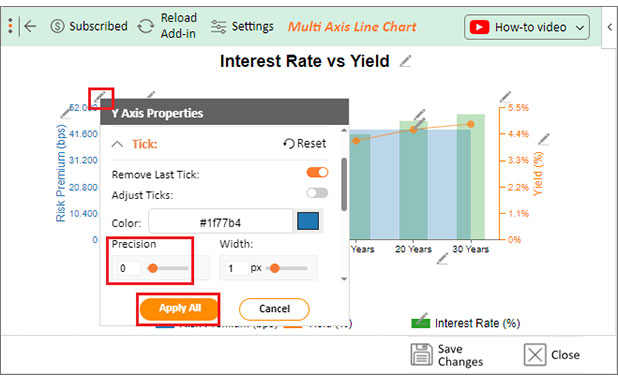
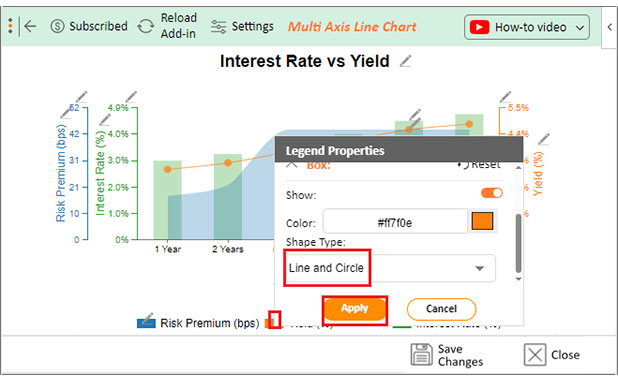
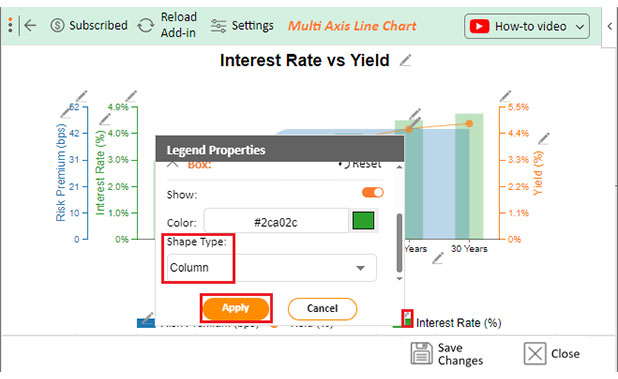
Follow these steps to visualize this data in Excel using ChartExo and glean valuable insights.


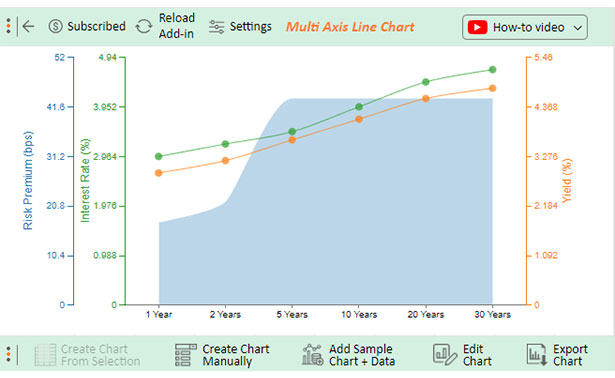
Interest rates and yields share an inverse relationship. As interest rates rise, bond prices fall, elevating yields. Conversely, lower interest rates increase bond prices, resulting in diminished yields. This dynamic interplay shapes investment decisions and portfolio performance.
Yield is often lower than the interest rate due to market factors. Bond prices impact yield inversely; when bonds trade at a premium, the effective yield decreases. Additionally, risk considerations and market conditions contribute to this disparity.
Yes, generally, higher yields correspond to higher interest rates. Yields reflect the return on investment, and when interest rates rise, new bonds offer higher yields to attract investors. This relationship is crucial in assessing investment opportunities and market conditions.
Understanding the nuances between interest rate vs. yield is pivotal in finance. While interest rates signify borrowing costs and adapt to economic shifts, yields encapsulate investment returns and sway with bond prices.
Appreciating these distinctions, particularly in bond contexts, is essential. As interest rates climb, bond values dip, creating an inverse correlation with yields. Negotiating this intricate interplay is crucial for investors striving to strike the right risk-return balance.
Yield, encompassing current yield and yield to maturity, provides a comprehensive view of an investment’s performance. It reflects not only the periodic income generated but also considers capital gains. Or losses when bonds are bought or sold.
Moreover, the disparity between yield and interest rate is evident due to market dynamics. Yield may be lower than the interest rate when bonds trade at a premium. This showcases the influence of supply, demand, and risk considerations.
While higher yields generally align with higher interest rates, it’s essential to recognize the broader economic context. Investor sentiment, inflation expectations, and central bank policies influence interest rates and yields.
Interest rates set the tempo in the financial orchestra, and yields compose the melody. Successfully navigating this symphony of interest rate vs. yield requires a deep understanding, empowering investors to make informed decisions in the ever-changing financial landscape.
Do not hesitate.
Unleash the magic with ChartExpo and witness the love story between your investments and returns. Spoiler alert: it’s a happily-ever-after investment romance.
How much did you enjoy this article?


Calculate accounts receivable turnover ratio to measure credit collection speed, improve cash flow, and strengthen your financial strategy. Read on!

Change Management KPIs are the key to tracking adoption, performance, and ROI during transitions. Find out which metrics matter. Read on!

Data collection methods and techniques determine the quality of every insight you act on. Explore key approaches for gathering reliable data. Read on!


