• Home
  • Tools dropdown img
    • Spreadsheet Charts

      • ChartExpo for Google Sheets
      • ChartExpo for Microsoft Excel
    • Power BI Charts

      • Power BI Custom Visuals by ChartExpo
    • Word Cloud

  • Charts dropdown img
    • Chart Category

      • Bar Charts
      • Circle Graphs
      • Column Charts
      • Combo Charts
      • Comparison Charts
      • Line Graphs
      • PPC Charts
      • Sentiment Analysis Charts
      • Survey Charts
    • Chart Type

      • Box and Whisker Plot
      • Clustered Bar Chart
      • Clustered Column Chart
      • Comparison Bar Chart
      • Control Chart
      • CSAT Survey Bar Chart
      • CSAT Survey Chart
      • Dot Plot Chart
      • Double Bar Graph
      • Funnel Chart
      • Gauge Chart
      • Likert Scale Chart
      • Matrix Chart
      • Multi Axis Line Chart
      • Overlapping Bar Chart
      • Pareto Chart
      • Radar Chart
      • Radial Bar Chart
      • Sankey Diagram
      • Scatter Plot Chart
      • Slope Chart
      • Sunburst Chart
      • Tornado Chart
      • Waterfall Chart
      • Word Cloud
    • Google Sheets
      Microsoft Excel
  • Services
  • Pricing
  • Contact us
  • Blog
  • Support dropdown img
      • Gallery
      • Videos
      • Contact us
      • FAQs
      • Resources
    • Please feel free to contact us

      atsupport@chartexpo.com

Categories
All Data Visualizations Data Analytics Surveys
Add-ons/
  • Google Sheets
  • Microsoft Excel
  • Power BI
All Data Visualizations Data Analytics Surveys
Add-ons
  • Google Sheets
  • Microsoft Excel
  • Power BI

We use cookies

This website uses cookies to provide better user experience and user's session management.
By continuing visiting this website you consent the use of these cookies.

Ok

ChartExpo Survey


Home > Blog > Data Analytics

Balanced Scorecard: What is It, Uses, & Implementation

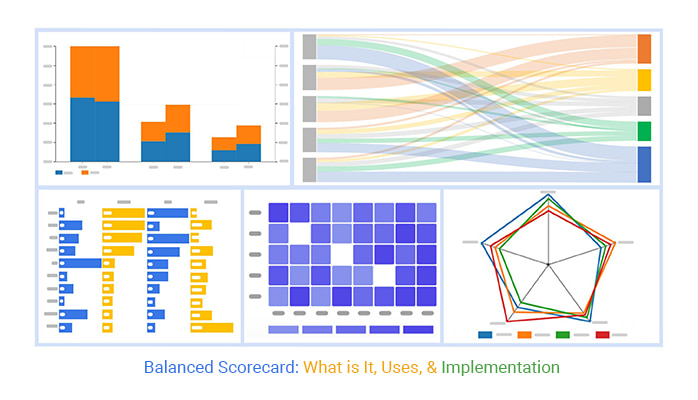
Balanced scorecard, what is it? Business leaders have been asking themselves this question for decades. In the 1990s, Harvard professors Robert Kaplan and David Norton developed the balanced scorecard (BSC). This modern management and strategic planning system goes beyond traditional financial indicators.

Balanced Scorecard What is It

Why is a balanced scorecard significant? Financial metrics are not enough. They focus on the past, providing information about previous achievements but offering limited advice for upcoming accomplishments. The BSC addresses this gap, offering a complete perspective on the health of an organization.

So, what does a balanced scorecard specifically measure? It analyzes four main viewpoints: financial, customer, internal operations, and learning and development. This comprehensive method guarantees that companies do not prioritize short-term profits over long-term prosperity.

The impact of the BSC has been remarkable. Over 50% of major US, European, and Asian companies use it. A global study by Bain & Co. ranked it as the fifth most widely used management tool worldwide. That’s impressive for a concept barely three decades old!

What is a balanced scorecard in practice? It’s a powerful tool for translating strategy into action. It helps organizations communicate goals, align daily work with strategy, prioritize projects, and track progress. Essentially, it links different strategic planning and management elements together.

Let’s clarify the balanced scorecard and investigate how it can change your organization’s strategy and performance measurement.

Table of Contents:

  1. What is a Balanced Scorecard (BSC)?
  2. Why Use the Balanced Scorecard?
  3. Who Uses the Balanced Scorecard Model?
  4. What are Balanced Scorecard Perspectives?
  5. How to Create a Balanced Scorecard: Step-by-Step?
  6. How to Analyze a Balanced Scorecard?
  7. Wrap Up

First…

What is a Balanced Scorecard (BSC)?

Definition: A Balanced Scorecard (BSC) is a strategic management tool. It helps organizations align business activities with their vision and strategy.

BSC measures performance across four key perspectives:

  • Financial
  • Customer
  • Internal Processes
  • Learning and Growth

This approach ensures that companies monitor both financial and non-financial metrics. It balances short-term goals with long-term objectives.

Using a BSC, organizations can track progress, identify areas for improvement, and make informed decisions. It encourages a comprehensive view of performance beyond financial results, promoting sustainable growth and success.

Why Use the Balanced Scorecard?

Do you feel like you’re juggling too many balls when managing your business? The balanced scorecard (BSC) could be the extra pair of hands you need. Here’s why:

  • Holistic performance measurement: The BSC goes beyond financial metrics. It provides a well-rounded view of your business, considering customer satisfaction, internal processes, and growth potential.
  • Alignment with strategy: It ensures every department’s actions align with the overall business strategy. Everyone’s on the same page, working toward common goals.
  • Improved decision-making: The BSC offers a clear snapshot of performance across key areas, informing data-driven decisions.
  • Enhanced communication: The BSC ensures better communication across all levels of the organization. Everyone understands how their work contributes to the bigger picture.
  • Focus on long-term goals: It helps balance short-term achievements and long-term financial goals, ensuring sustainable success.
  • Identification of improvement areas: The BSC highlights areas needing attention so you can take proactive steps to enhance performance.

Who Uses the Balanced Scorecard Model?

Who uses the balanced scorecard (BSC) to steer their business toward success? You might be surprised by the variety of organizations that rely on this powerful tool. Here’s a quick look:

  • Large corporations: Global giants like Apple and Walmart use the BSC to align their diverse operations with strategic goals.
  • Small and medium enterprises (SMEs): Smaller businesses leverage the BSC to keep growth on track. They also use it to ensure all departments are working towards the same objectives.
  • Non-profit organizations: Charities and non-profits use the BSC to measure success beyond financial performance, focusing on mission-driven outcomes.
  • Government agencies: Public sector entities employ the BSC to improve service delivery and accountability by tracking performance in key areas.
  • Educational institutions: Universities and schools adopt the BSC to enhance academic performance, operational efficiency, and stakeholder satisfaction.

What are Balanced Scorecard Perspectives?

Have you ever wondered how businesses keep all aspects of their operations aligned with their goals? The balanced scorecard (BSC) offers a strategic framework to do just that by focusing on four key perspectives:

  1. Financial perspective: This perspective focuses on the organization’s financial performance. It involves tracking revenue, profit margins, and return on investment. For businesses, this perspective answers the question, “How do we look to our shareholders?”
  2. Customer perspective: This is all about how the company is perceived by its customers. It involves measuring customer satisfaction, retention, and market share. The goal is to ensure that the products or services meet or exceed customer expectations.
  3. Internal business processes perspective: This perspective zooms in on the efficiency and effectiveness of the company’s operations. It tracks how well the business is running internally and whether it’s delivering value to customers. Key areas include innovation, process improvement, and quality control.
  4. Learning and growth perspective: This perspective focuses on the organization’s long-term growth and development. It examines employee training, corporate culture, and knowledge management. This perspective ensures the company is continuously improving and adapting to industry changes.

How to Create a Balanced Scorecard: Step-by-Step?

Ready to take your business strategy to the next level? Creating a balanced scorecard (BSC) can be a game-changer. Here’s a step-by-step guide to building your own BSC:

Step 1: Define the Vision and Strategy

Clearly articulate your organization’s vision and overall strategy. This sets the foundation for everything that follows, ensuring your BSC is aligned with your long-term goals.

Step 2: Identify Key Perspectives

Choose the four key perspectives guiding your scorecard: Financial, Customer, Internal Business Processes, and Learning and Growth. These perspectives will help you view your business from all angles.

Step 3: Develop Objectives for Each Perspective

For each perspective, develop specific objectives that align with your vision and strategy. These objectives should reflect what you must achieve to succeed in each area.

Step 4: Define Performance Measures

Determine how you’ll measure progress towards each objective. These performance measures should be clear, quantifiable, and directly linked to your goals.

Step 5: Establish Initiatives

Identify the key initiatives or projects that will drive progress in each perspective. These are the actions your team will take to achieve the objectives and meet the performance measures.

Step 6: Create a BSC Template

Design a template that organizes all the information into a cohesive framework. Your template should be easy to read and use, providing a clear snapshot of your strategy and how it will be executed.

Step 7: Communicate the Scorecard

Share the BSC with your team and stakeholders. Ensure everyone understands how their work contributes to the overall strategy and how progress will be measured.

Step 8: Monitor and Review Performance

Track performance regularly against the scorecard. This will allow you to see where you’re making progress and where adjustments might be needed.

Step 9: Adapt and Improve

Use the insights gained from monitoring to refine your strategy and improve the BSC over time. Flexibility is key, adjust your objectives, measures, and initiatives to stay on track.

How to Analyze a Balanced Scorecard?

Data analysis: the art of turning numbers into insights. Spreadsheets sprawl endlessly. Figures blur. Minds melt.

Enter the Balanced Scorecard, a beacon of hope. But wait! How do you make sense of it all? Data visualization comes in to save the day. It’s the superhero we need, transforming mind-numbing numbers into eye-catching insights.

Excel tries its best, but let’s face it: its charts are not as effective as we need them to be.

Fear not, data enthusiasts! ChartExpo is here to rescue us from Excel’s lackluster visuals. It will turn your Balanced Scorecard and skills matrix templates into masterpieces of clarity and comprehension.

Top 5 Charts Create in Excel by Using ChartExpo

Who knew data could look this good?

Heatmap

Heatmap for Learning Balanced Scorecard What is It

Clustered Stacked Bar Chart

Clustered Stacked Bar Chart for Learning Balanced Scorecard What is It

Multi-Axis Spider Chart

Multi Axis Spider Chart for Learning Balanced Scorecard What is It

Horizontal Waterfall Chart

Horizontal Waterfall Chart for Learning Balanced Scorecard What is It

Sankey Chart

Sankey Chart for Learning Balanced Scorecard What is It

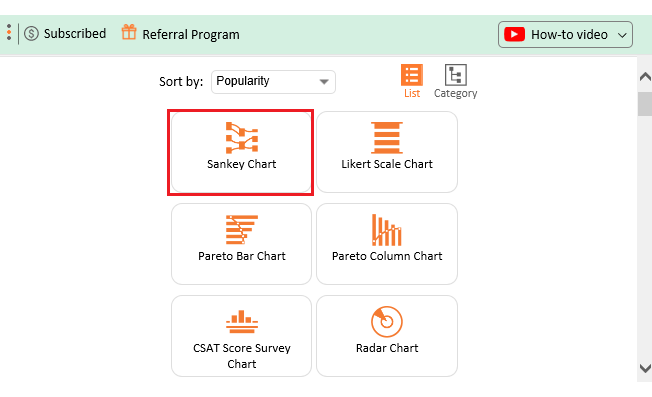
Let’s learn how to install ChartExpo in Excel.

  1. Open your Excel application.
  2. Open the worksheet and click the “Insert” menu.
  3. You’ll see the “My Apps” option.
  4. In the Office Add-ins window, click “Store” and search for ChartExpo on my Apps Store.
  5. Click the “Add” button to install ChartExpo in your Excel.

ChartExpo charts are available both in Google Sheets and Microsoft Excel. Please use the following CTAs to install the tool of your choice and create beautiful visualizations with a few clicks in your favorite tool.

Balanced Scorecard Example

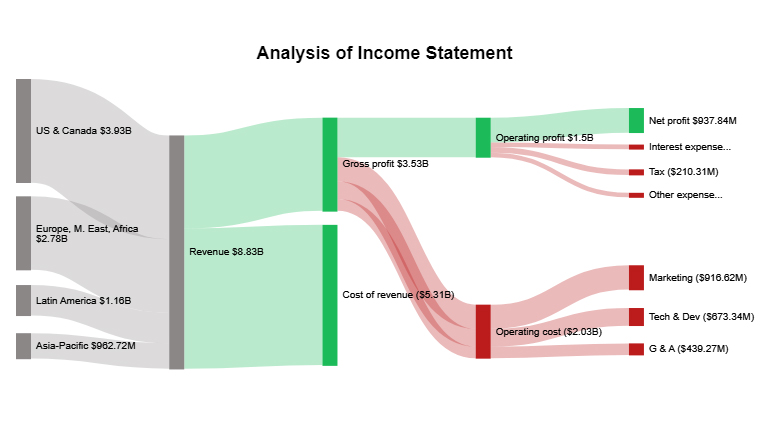
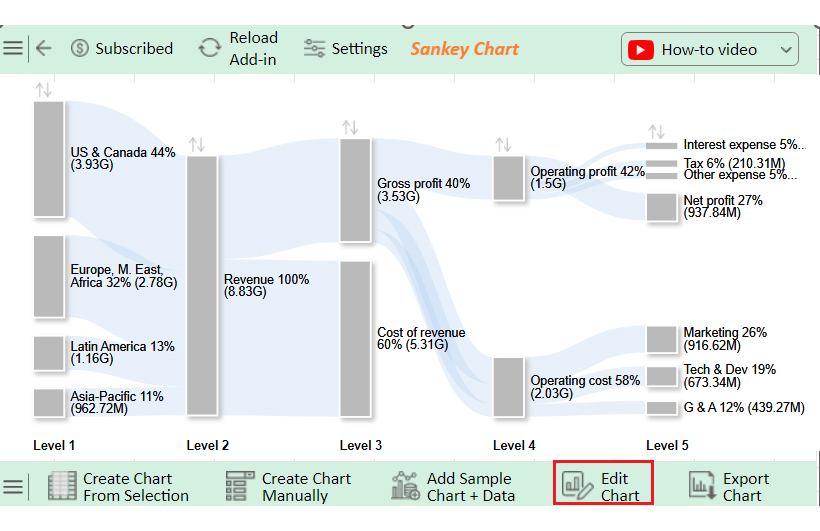
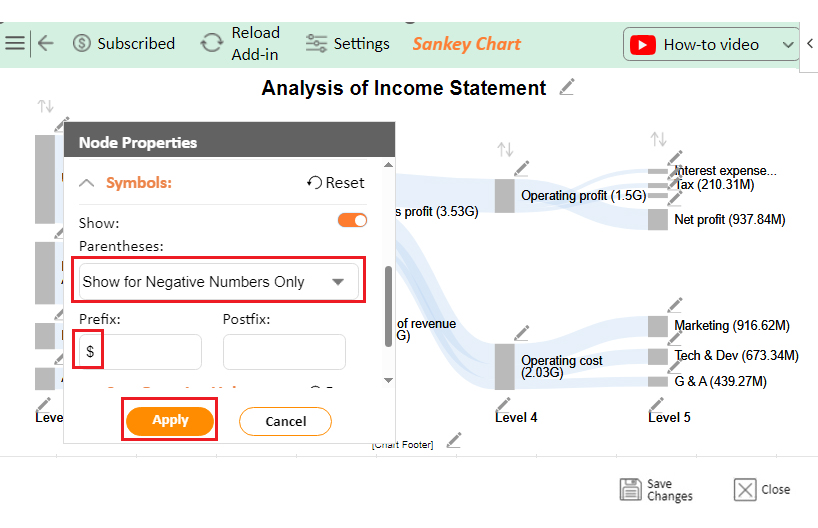
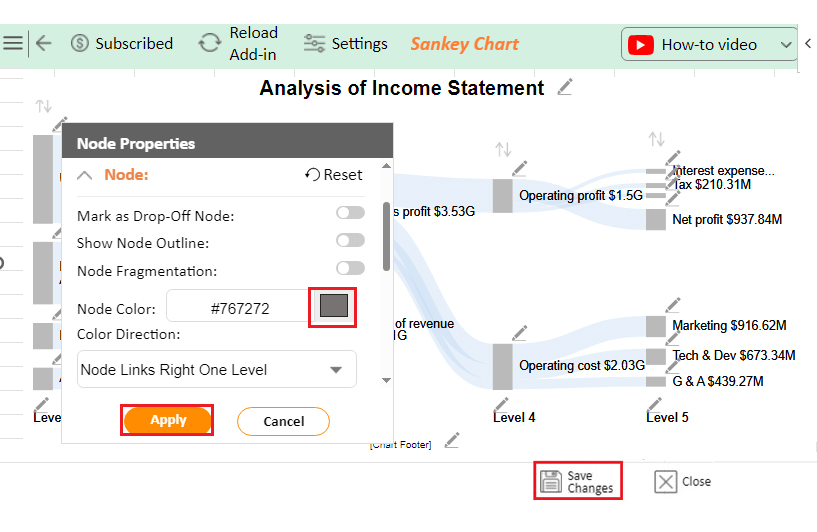
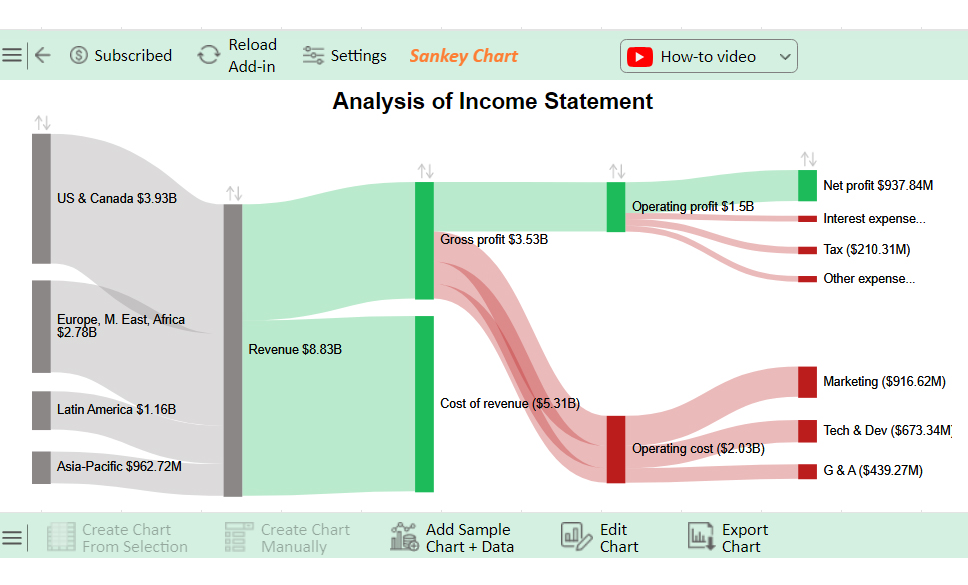
Let’s analyze the balanced scorecard example data below using ChartExpo.

Level 1 Level 2 Level 3 Level 4 Level 5 Amount
US & Canada Revenue 3930557000
Europe, M. East, Africa Revenue 2783530000
Latin America Revenue 1156023000
Asia-Pacific Revenue 962715000
Revenue Gross profit 3525340000
Revenue Cost of revenue -5307485000
Gross profit Operating profit 1496109000
Operating profit Net profit 937838000
Operating profit Interest expense -175212000
Operating profit Tax -210312000
Operating profit Other expense -172747000
Gross profit Operating cost Marketing -916617000
Gross profit Operating cost Tech & Dev -673341000
Gross profit Operating cost G & A -439273000
  • To get started with ChartExpo, install ChartExpo in Excel.
  • Now Click on My Apps from the INSERT menu.
insert chartexpo in excel
  • Choose ChartExpo from My Apps, then click Insert.
open chartexpo in excel
  • Once it loads, choose the “Sankey Chart” from the charts list.
search sankey chart in excel
  • Click the “Create Chart From Selection” button after selecting the data from the sheet, as shown.
Click Create Chart From Selection After Learning Balanced Scorecard What is It
  • ChartExpo will generate the visualization below for you.
Initial Visualzation After Learning Balanced Scorecard What is It
  • If you want to have the chart’s title, click Edit Chart, as shown in the above image.
  • Click the pencil icon next to the Chart Header to change the title.
  • It will open the properties dialog. Under the Text section, you can add a heading in Line 1 and enable Show.
  • Give the appropriate title of your chart and click the Apply button.
Add Chart Header After Learning Balanced Scorecard What is It
  • You can disable the “Show Node Outline” as follows:
Disable Show Node Outline After Learning Balanced Scorecard What is It
  • You can disable the footer labels as follows:
Disable Footer Labels After Learning Balanced Scorecard What is It
  • You can add the dollar sign and also show a negative number in Parentheses as follows:
Show Prefix and Nagetive Number After Learning Balanced Scorecard What is It
  • Let’s give colors to the nodes. Click the pencil icon at the top of the nodes and go to “Node“. Select the color and click the “Apply” button to save all changes.
  • Click the “Save Changes” button to persist the changes.
Give Colors to Nodes After Learning Balanced Scorecard What is It
  • Your final Sankey Chart will appear below.
Final Balanced Scorecard What is It

Insights

  • Regional revenue: US & Canada at $3.93B
  • Gross profit: $3.53B
  • Cost of revenue: $5.31B
  • Operating profit: $1.5B
  • Net profit: $937.8M
  • There are significant operating costs in marketing, tech, and G&A

Unlock Strategic Insights and Efficiency with the Balanced Scorecard in Excel:

  1. Open your Excel Application.
  2. Install ChartExpo Add-in for Excel from Microsoft AppSource to create interactive visualizations.
  3. Select the Sankey Chart from the list of charts.
  4. Select your data.
  5. Click on the “Create Chart from Selection” button.
  6. Customize your chart properties to add header, axis, legends, and other required information.

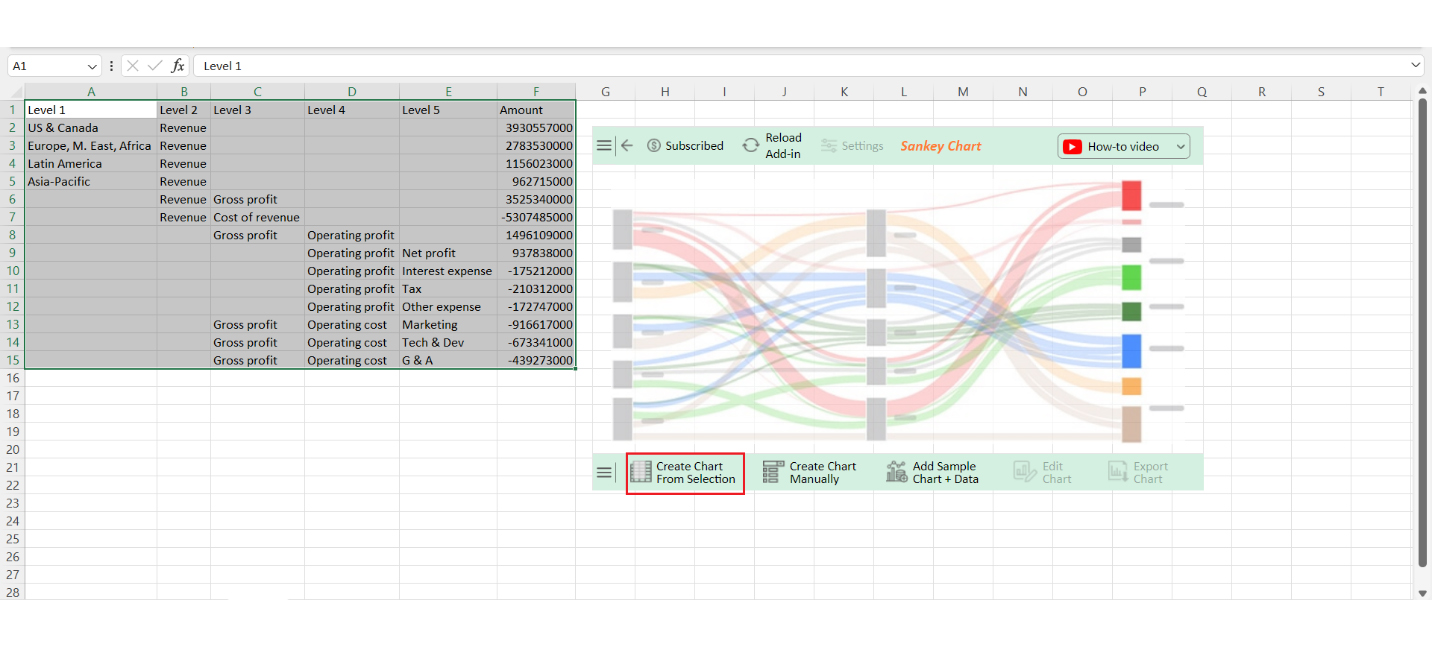
The following video will help you create a Sankey Chart in Microsoft Excel.

FAQs

What are the 4 pillars of the balanced scorecard?

The four pillars of the balanced scorecard are:

  • Financial: Focuses on financial performance and value creation.
  • Customer: Emphasizes customer satisfaction and retention.
  • Internal Processes: Improves internal business processes.
  • Learning and Growth: Develops employee skills and innovation.

What is balanced scorecard benchmarking?

Balanced scorecard benchmarking compares an organization’s performance with industry standards. It evaluates metrics across financial, customer, internal processes, and learning and growth perspectives. The goal is to identify areas for improvement and align strategies with best practices.

How do we use the balanced scorecard to measure performance?

To use the balanced scorecard:

  1. Set objectives for each perspective: financial, customer, internal processes, and learning and growth.
  2. Measure performance using relevant metrics.
  3. Regularly review results, adjust strategies, and ensure alignment with overall goals.

Wrap Up

A Balanced Scorecard (BSC) is a strategic tool. It helps organizations align activities with their vision. BSC focuses on four key perspectives: Financial, Customer, Internal Processes, and Learning and Growth.

The financial perspective tracks monetary performance. It ensures the organization meets financial goals. Revenue, profit, and return on investment are key metrics.

The customer perspective focuses on customer satisfaction. It measures how well the organization serves its clients. Customer retention and market share are important indicators.

The internal processes perspective examines operational efficiency. It looks at how well the organization runs internally. Quality control and innovation are crucial here.

The learning and growth perspective emphasizes development. It focuses on improving employees and systems. Training, culture, and knowledge management are key areas.

The BSC provides a comprehensive view of performance by covering all these perspectives. It balances short-term results with long-term success, ensuring sustainable growth and strategic alignment.

Do not hesitate.

Adopt the balanced scorecard in your business with ChartExpo and steer your business toward success!

How much did you enjoy this article?

PBIAd1
Start Free Trial!
138782

Related articles

next previous
Data Analytics31 min read

Data Analysis Without Nonsense: Fix the Right Problem, Fast

Data analysis can mislead when metrics look right but outcomes fail. Learn how to spot red flags, fix failures, and make better decisions. Read on!

Data Analytics29 min read

Variance Analysis Isn’t a Math Problem, It’s a Trust Problem

Variance analysis helps identify what went wrong, who owns it, and what to do next. Use it to drive decisions, not just reports. Learn more!

Data Analytics10 min read

Supplier Comparison Template: Download It Now

A supplier comparison template streamlines vendor evaluation by comparing cost and quality. Click here to learn its benefits and how to analyze them.

Data Analytics32 min read

Ecommerce Analytics: How to Fix What It Often Gets Wrong

Ecommerce analytics often lead to mixed signals and costly misreads. Fix attribution gaps, align teams, and act on the right data. Get started now!

Data Analytics30 min read

When Sales Funnel Breaks: Failures, Fixes, & Funnel Debt

Is your sales funnel hiding costly gaps? Learn how pipeline stalls, false metrics, and handoff chaos could be draining revenue. Get started now!

ChartExpo logo

Turn Data into Visual
Stories

CHARTEXPO

  • Home
  • Gallery
  • Videos
  • Services
  • Pricing
  • Contact us
  • FAQs
  • Privacy policy
  • Terms of Service
  • Sitemap

TOOLS

  • ChartExpo for Google Sheets
  • ChartExpo for Microsoft Excel
  • Power BI Custom Visuals by ChartExpo
  • Word Cloud

CATEGORIES

  • Bar Charts
  • Circle Graphs
  • Column Charts
  • Combo Charts
  • Comparison Charts
  • Line Graphs
  • PPC Charts
  • Sentiment Analysis Charts
  • Survey Charts

TOP CHARTS

  • Sankey Diagram
  • Likert Scale Chart
  • Comparison Bar Chart
  • Pareto Chart
  • Funnel Chart
  • Gauge Chart
  • Radar Chart
  • Radial Bar Chart
  • Sunburst Chart
  • see more
  • Scatter Plot Chart
  • CSAT Survey Bar Chart
  • CSAT Survey Chart
  • Dot Plot Chart
  • Double Bar Graph
  • Matrix Chart
  • Multi Axis Line Chart
  • Overlapping Bar Chart
  • Control Chart
  • Slope Chart
  • Clustered Bar Chart
  • Clustered Column Chart
  • Box and Whisker Plot
  • Tornado Chart
  • Waterfall Chart
  • Word Cloud
  • see less

RESOURCES

  • Blog
  • Resources
  • YouTube
SIGN UP FOR UPDATES

We wouldn't dream of spamming you or selling your info.

© 2025 ChartExpo, all rights reserved.