Categories
In business, we love to crunch numbers and examine data. But when it comes to comparing gross retention vs, net retention, things can get a tad tricky. It’s like comparing apples to oranges, or maybe more like comparing apples to a fruit salad.


Picture a bustling restaurant with customers streaming in and out. Gross retention measures the percentage of customers who stick around, no matter what. It’s like that loyal customer who always attends Taco Tuesday, rain or shine.
Simple, right?
Now, imagine that same restaurant, but this time, we’re considering the customers who left for greener pastures. Net retention considers the regulars and those returning after a brief hiatus. It’s like that customer who tried other restaurants but eventually crawled back for those mouthwatering tacos.
You might be wondering why this comparison is important.
These metrics, specifically Gross Retention vs. Net Retention, are key to measuring growth and profitability in SaaS businesses. They help you understand how much revenue you can retain from existing customers over a specific period. And that’s crucial for financial success.
So, buckle up and prepare for a ride through the world of Gross Retention vs. Net Retention and explore the nuances of customer retention metrics.
Let’s delve into an in-depth understanding of Gross Retention vs. Net Retention:
Definition: Gross retention is a financial metric measuring the total revenue retained from existing customers over a specific period. It excludes any upsells, expansions, or new customer additions.
The gross retention rate provides a straightforward view of the percentage of revenue retained from the original customer base. It offers insights into customer loyalty and the ability to maintain existing revenue streams without considering additional sales/upgrades.
Definition: Net retention is a financial metric calculating the total revenue retained from existing customers over a specific period. It includes expansions, upsells, and reductions due to churn or contraction.
This metric offers a comprehensive view of revenue performance by considering changes within the existing customer base. It highlights revenue stream growth or contraction, incorporating existing customer loyalty and additional sales efforts.
Comparing Gross Retention vs. Net Retention involves understanding the calculation methods, scope of measurement, business growth indicators, strategic insights, and decision-making implications. Here’s a detailed guide on how to compare these two key metrics:
Gross retention is calculated by dividing the total revenue retained from existing customers by the starting revenue. It provides a straightforward percentage of revenue retained without considering additional sales or expansions during the measurement period.
In contrast, net retention incorporates expansions, upsells, and reductions due to churn. Thus, it provides a more comprehensive view by factoring in changes within the existing customer base.
Gross retention focuses solely on the revenue retained from the original customer base. It excludes any changes resulting from upsells or expansions. Thus, it offers a clear snapshot of customer loyalty and the ability to maintain existing revenue streams.
On the other hand, net retention embraces a broader scope. It considers both the revenue retained and additional revenue generated from existing customers through expansions and upsells. This inclusivity provides a more holistic assessment of revenue performance.
Gross retention primarily indicates the ability to maintain existing revenue streams from the initial customer base. It offers insights into customer loyalty but does not account for revenue growth from expansions or upsells.
In contrast, net retention serves as a more comprehensive business growth indicator. It considers not only retained revenue but also the additional revenue generated through expansions. Thus, it showcases the overall revenue trajectory.
Gross retention provides strategic insights into customer loyalty and the effectiveness of maintaining revenue from existing customers. It helps you understand your ability to retain revenue without relying on additional sales efforts.
Net retention, with its inclusive approach, offers more strategic depth. This is by highlighting the impact of expansions and upsells on overall revenue. This insight guides strategic decisions related to customer engagement and revenue growth.
Gross retention informs decisions related to customer retention strategies and the effectiveness of maintaining existing revenue streams. It helps to assess the stability of the business’s customer base.
On the other hand, net retention guides decisions involving customer retention and revenue growth strategies. It provides a comprehensive picture, informing decisions related to upselling opportunities, expansion efforts, and overall business growth initiatives.
Here are actionable strategies for improving both Gross Retention and Net Retention:
Regularly conduct customer satisfaction surveys to gather feedback on their experience with your products or services. Then, address identified issues promptly to enhance overall satisfaction and loyalty.
Implement proactive customer support measures to anticipate and address issues before they become problems. Provide quick and effective solutions to customer inquiries or concerns.
Invest in consistently delivering high-quality products or services to meet or exceed customer expectations. Ensure your offerings remain competitive and aligned with market demands.
Tailor communication to individual customer needs and preferences. Offer personalized recommendations, promotions, or updates based on their past interactions with your business.
Introduce loyalty programs that reward customers for their continued business. For instance, you can incentivize repeat purchases and ongoing engagement through exclusive offers and perks.
Identify opportunities for upselling and cross-selling to existing customers. Offer complementary products or enhanced features to increase customer lifetime value.
Provide resources and educational materials to help customers maximize the value of your products or services. Invest in fostering a deeper understanding of how your offerings address their needs.
Optimize subscription models to encourage long-term commitments. You can introduce flexible plans or features that align with varying customer preferences.
Roll out regular updates or improvements to keep your offerings fresh and competitive. Also, communicate the value of these updates to customers, showcasing continuous innovation.
Implement customer success programs to guide customers actively through their journey with your products. Provide resources, support, and guidance to ensure customers achieve their desired outcomes.
Segment customers based on their behaviors, preferences, and needs. Then, tailor marketing and engagement strategies for each segment to enhance relevance, much like a Segmented bar graph helps break down and compare customer groups more effectively.
Offer incentives or discounts for timely renewals. Create a seamless renewal process and communicate the added value of ongoing partnerships.
Leverage data analytics to gain insights into customer behaviors and preferences. Data analysis will help you identify patterns, predict churn risks, and tailor strategies for individual customers.
Data visualization is the secret weapon in the world of data analysis. It’s like the cool kid in school who effortlessly transforms boring spreadsheets into captivating stories. Excel, our trusty data organization and analysis companion tries but falls short in the visual department.
But fear not! ChartExpo comes to the rescue, armed with its powerful data visualization capabilities. With ChartExpo, you can analyze gross retention vs. net retention in Excel with ease and style.
Say goodbye to dull charts and hello to insightful and visually stunning representations of your data. It’s time to level up your data analysis game with ChartExpo.
Let’s learn how to install ChartExpo in Excel.
ChartExpo charts are available both in Google Sheets and Microsoft Excel. Please use the following CTA’s to install the tool of your choice and create beautiful visualizations in a few clicks in your favorite tool.
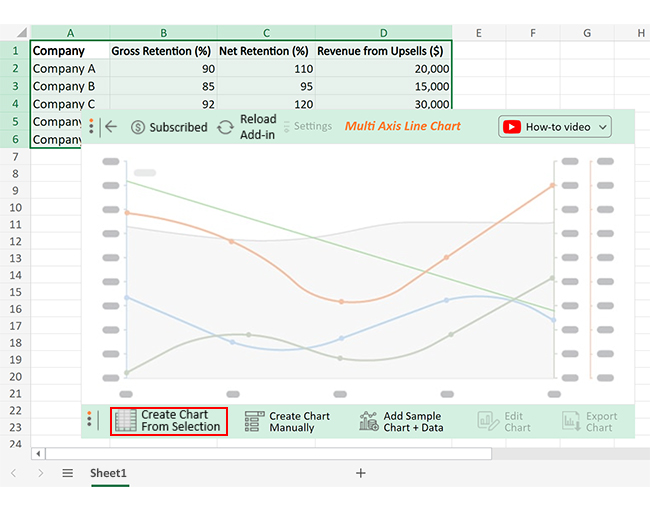
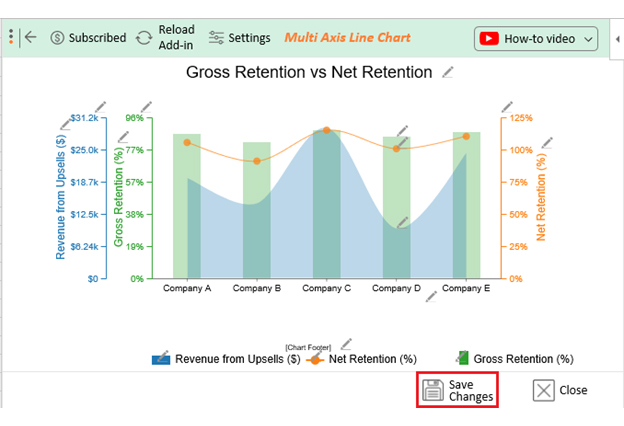
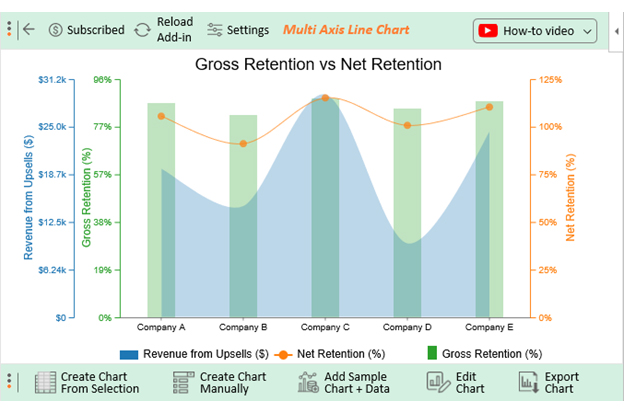
Let’s say you want to analyze the gross vs net retention data below on five companies.
| Company | Gross Retention (%) | Net Retention (%) | Revenue from Upsells ($) |
| Company A | 90 | 110 | 20,000 |
| Company B | 85 | 95 | 15,000 |
| Company C | 92 | 120 | 30,000 |
| Company D | 88 | 105 | 10,000 |
| Company E | 91 | 115 | 25,000 |
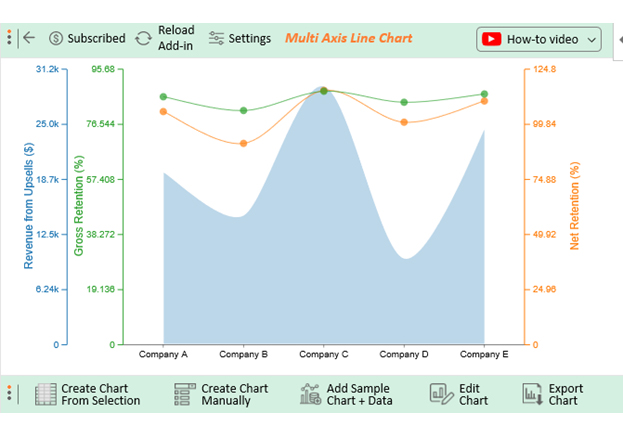
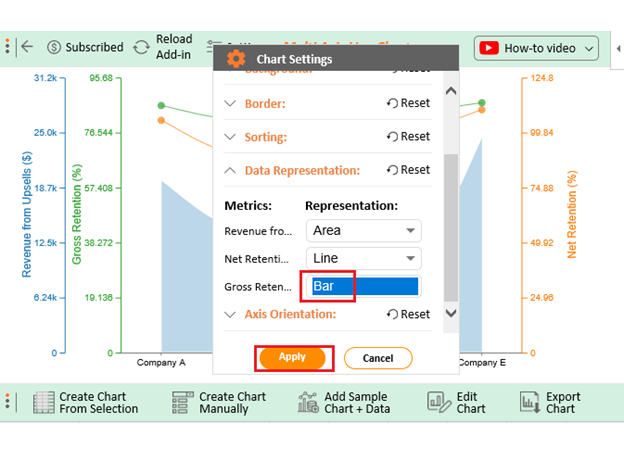
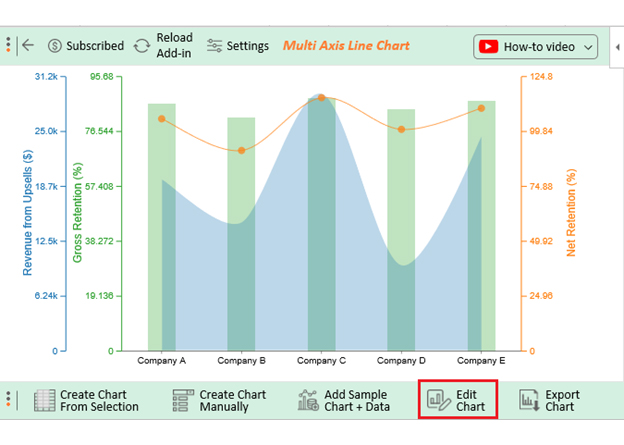
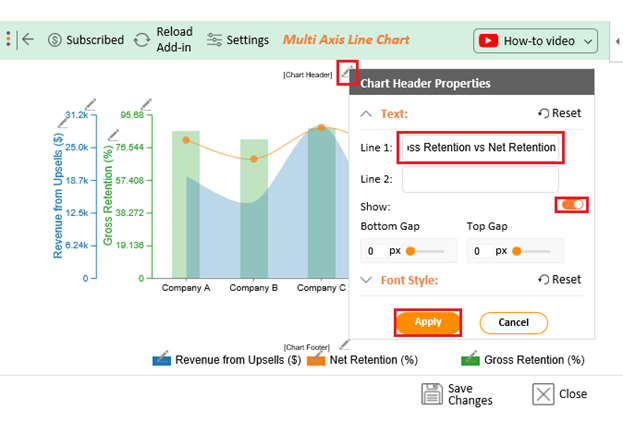
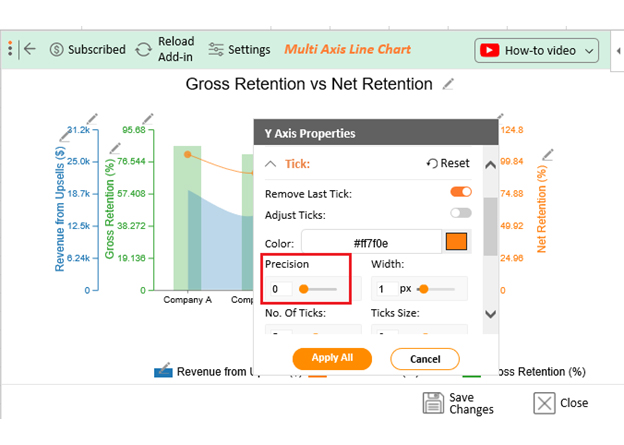
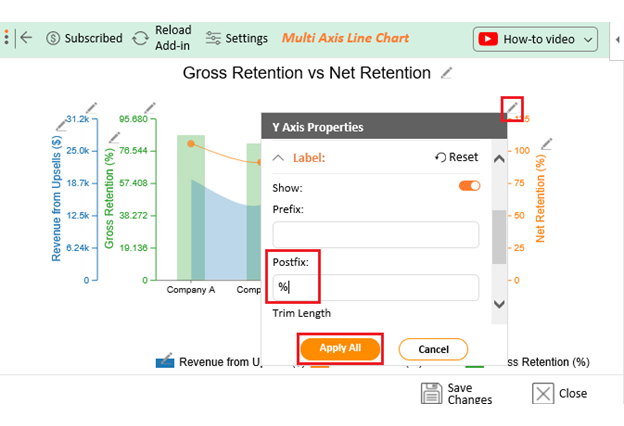
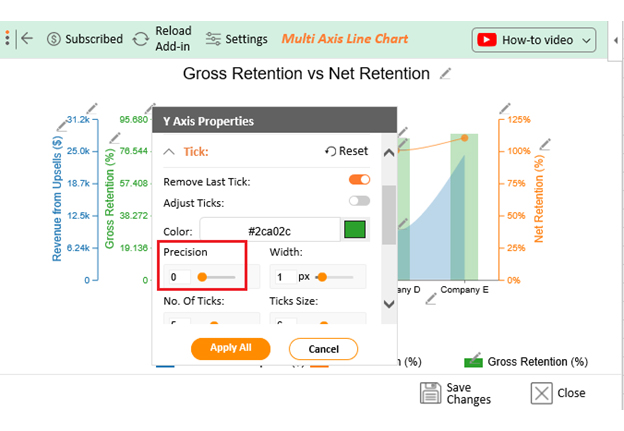
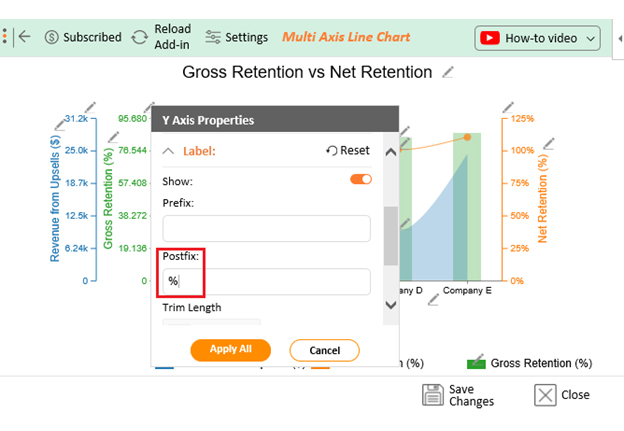
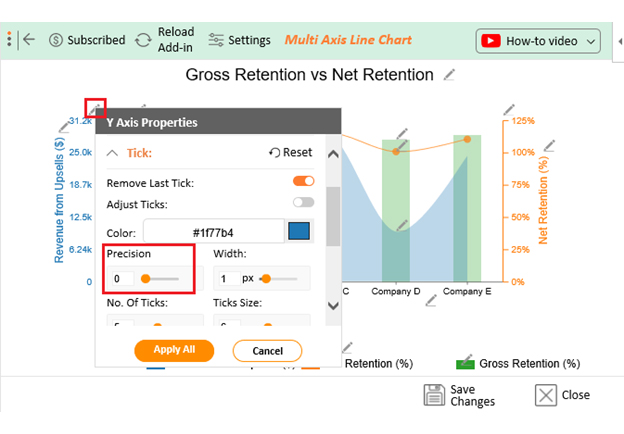
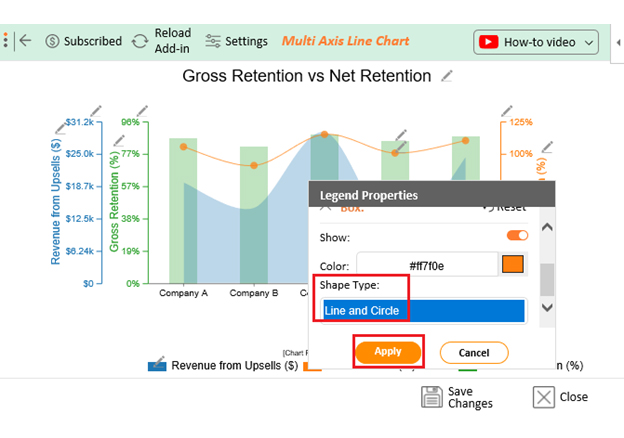
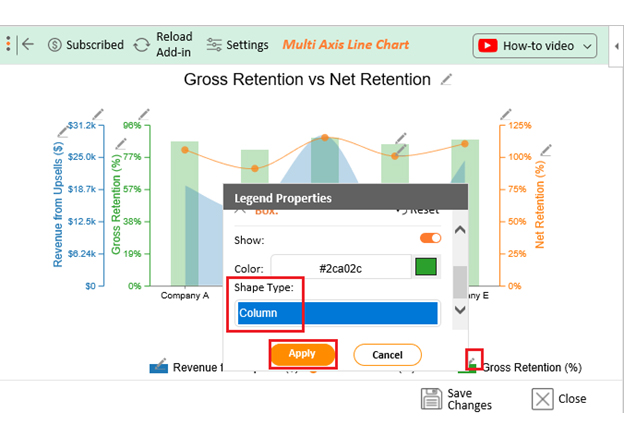
Follow the steps below to create a visualization of this data with ChartExpo and glean valuable insights.


Gross Retention Rate (GRR) measures the percentage of revenue retained from existing customers, excluding expansions. On the other hand, Net Dollar Retention (NDR) includes expansions. Thus, it provides a comprehensive view of revenue performance by considering changes within the existing customer base.
Gross Retention Rate (GRR) refers to the percentage of revenue retained from existing customers, excluding expansions. It helps assess the effectiveness of customer success efforts in maintaining ongoing revenue from the existing customer base.
Gross retention measures revenue retained from existing customers, excluding expansions. Net retention encompasses expansions, offering a comprehensive perspective on total revenue changes within the existing customer base.
The comparison between Gross Retention vs. Net Retention provides a comprehensive understanding of customer retention dynamics.
Gross retention measures the percentage of customers remaining without factoring in expansion revenue. Thus, it offers a straightforward assessment of customer base preservation.
On the other hand, net retention considers expansion revenue. It provides a more holistic view by incorporating existing customers’ upsell or cross-sell contributions.
Understanding the nuances between these metrics is essential for businesses aiming to optimize customer retention strategies. Gross retention is a fundamental metric, offering a baseline for assessing customer churn. However, net retention unveils the complete picture, factoring in the revenue growth potential within the existing customer base.
Successful businesses strike a balance between Gross Retention vs. Net Retention, recognizing that both metrics contribute unique insights. The comparison guides strategic decisions, highlighting areas for improvement and showcasing the efficacy of growth initiatives.
Ultimately, comparing Gross and Net Retention guides you toward a nuanced approach. You can develop a robust strategy that combines customer preservation with revenue maximization for lasting success.
How much did you enjoy this article?


Calculate accounts receivable turnover ratio to measure credit collection speed, improve cash flow, and strengthen your financial strategy. Read on!

Change Management KPIs are the key to tracking adoption, performance, and ROI during transitions. Find out which metrics matter. Read on!

Data collection methods and techniques determine the quality of every insight you act on. Explore key approaches for gathering reliable data. Read on!


