Categories
Economic indicators examples give analysts, investors, and business leaders a measurable window into how an economy performs over time.
From GDP shifts to employment trends, these data points shape everything from policy choices and investment strategies to detailed business planning, risk assessment, and market analysis.
Without them, evaluating whether conditions are improving, deteriorating, or simply holding steady would rely entirely on guesswork.
This guide breaks down what economic indicators examples mean, highlights the most widely tracked measures, and walks through practical methods for analyzing them. Readers will also learn how visualization tools can turn raw figures into clearer, more actionable insights.
Definition: Economic indicators are quantifiable data points that governments, financial institutions, and businesses monitor to gauge how an economy is performing. GDP, the unemployment rate, and the inflation rate rank among the most frequently cited measures.
These metrics serve a clear purpose: tracking economic health, supporting sound decision-making, and comparing performance across time periods. Key economic indicators reveal whether an economy is on an upward trajectory, pulling back, or holding steady at any given point.
Economic data provides the clearest picture of where an economy stands and where it may be heading, giving decision-makers reliable signals for planning and response. The economic indicators examples below show how these data points serve different purposes.
Economic indicators are classified by when they reflect changes in the economy. This timing distinction, familiar in how key risk indicators are used to flag threats, also defines the three main categories of economic indicators, examples applied in analysis.
Among the many economic indicators examples tracked by analysts worldwide, a core set consistently draws attention for capturing the most direct signals of growth, stability, and overall economic output.
Reviewing concrete economic indicators examples from real reports makes it easier to understand how these metrics behave in practice.
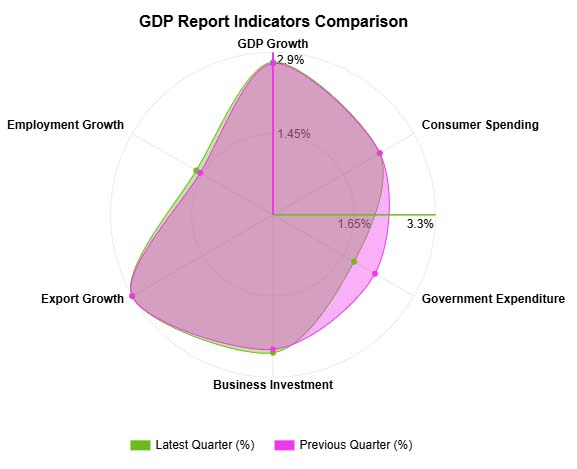
Among economic indicators examples, this GDP report captures modest overall expansion, with GDP and exports nudging upward while consumer spending pulled back and most remaining measures held flat.
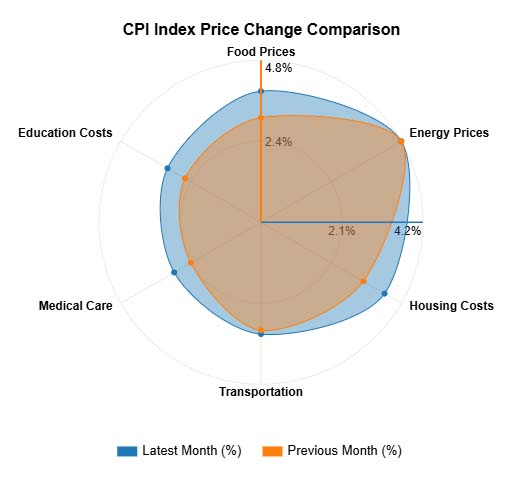
This CPI index entry, one of the most closely tracked economic indicators examples, shows that energy and food saw steeper price increases in earlier periods, while more recent figures point to moderate inflation across housing, medical care, and education.
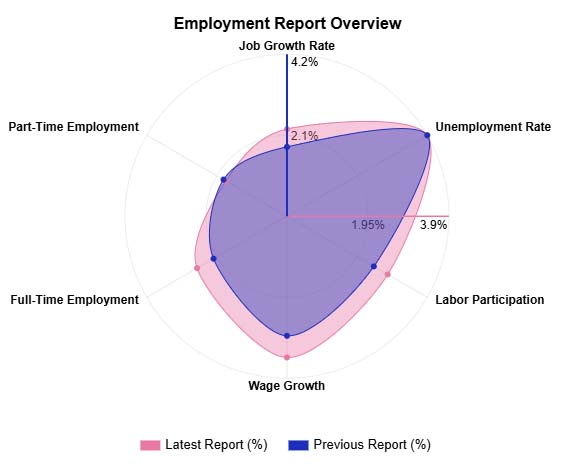
This employment report, another of the widely followed economic indicators examples, reflects a period of above-average job creation and wage increases, falling unemployment, and broadly stable conditions relative to the prior reporting period.
Working with key economic indicators in Google Sheets lets you organize figures, compare trends across periods, and generate charts that surface patterns more clearly than raw data alone.
Gather figures such as GDP, inflation rates, and unemployment numbers from trusted sources and enter them into clearly labeled columns.
Sort data by month, quarter, or year to make trend comparisons straightforward and consistent.
Run percentage change, average, and growth-rate formulas to interpret performance, applying methods similar to those used when comparing economic profit vs. accounting profit across reporting periods.
Build line charts, bar charts, or Radar Charts to display multiple indicators side by side for easier analysis.
When native chart options fall short, connect ChartExpo to Google Sheets to unlock more advanced visualization formats.
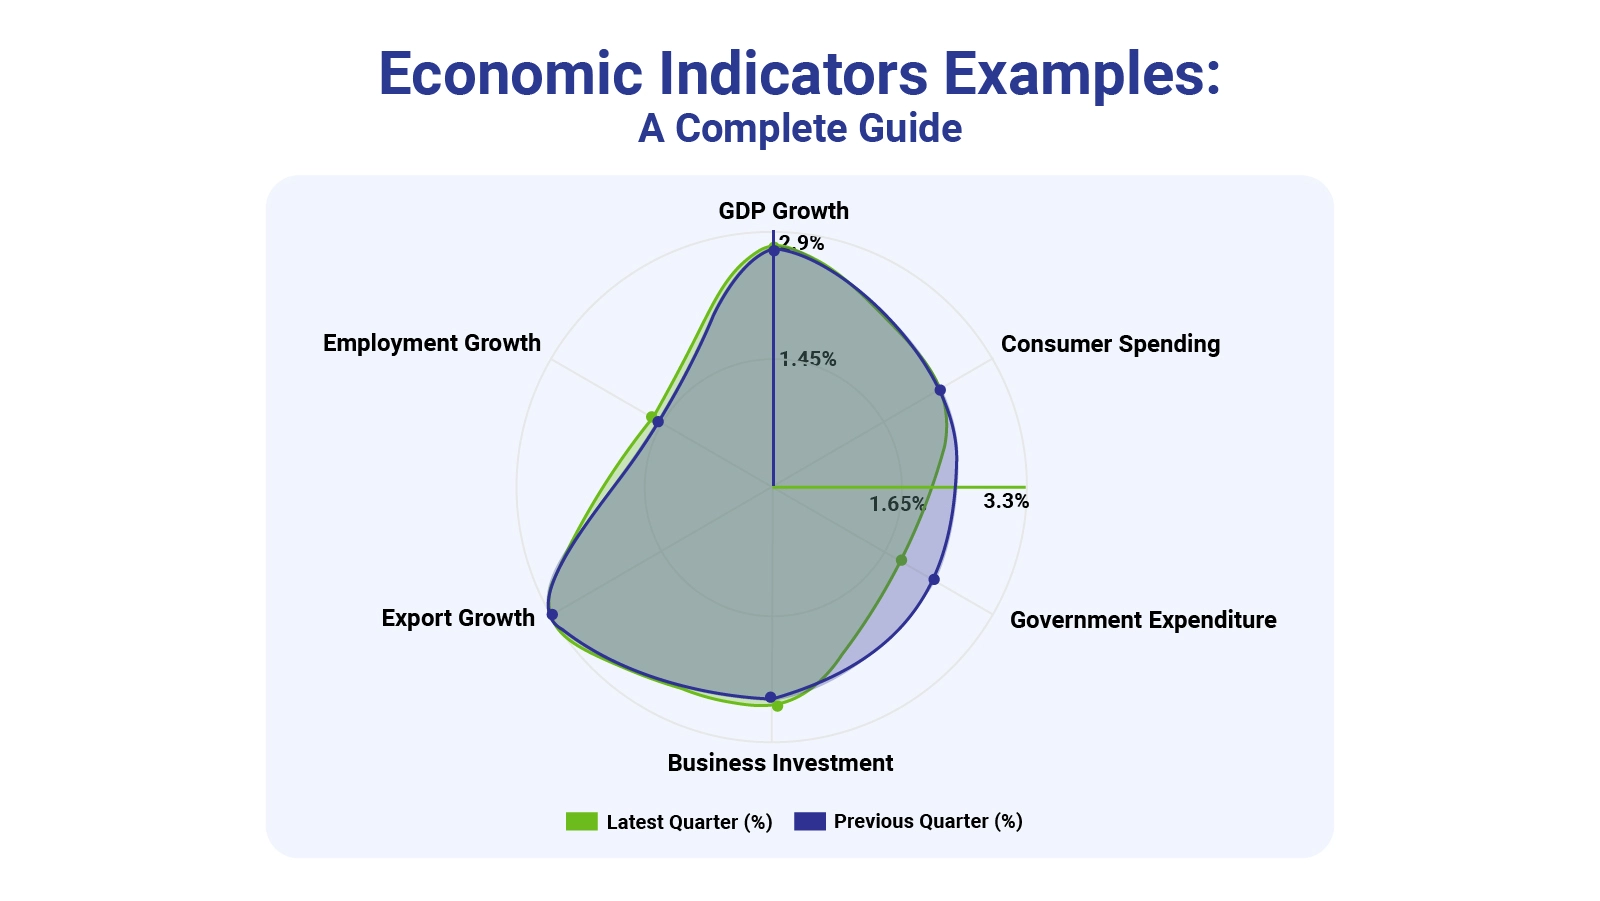
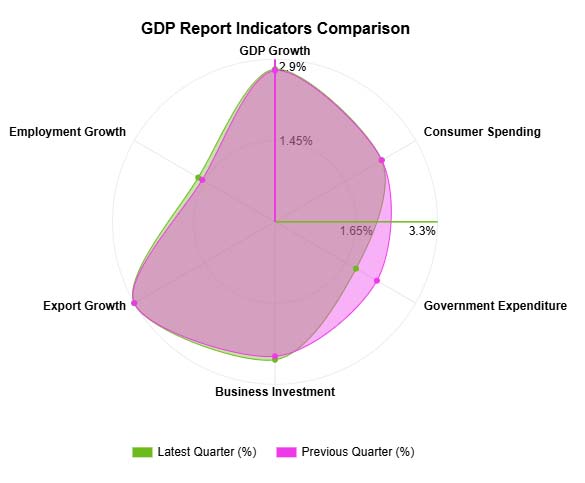
The radar chart compares key GDP indicators across the latest and previous quarters, including growth, consumer spending, government expenditure, investment, exports, and employment.
It shows relatively stable performance overall, with slight improvements in consumer spending and government expenditure, while other indicators remain largely consistent.
Consistent review of economic indicators gives individuals and organizations the foresight to anticipate changes and adjust their plans before conditions shift.
Drawing accurate conclusions from economic data requires disciplined methods. Applying these practices helps analysts extract more value from economic indicators and examples and avoid common misinterpretations.
GDP, unemployment rate, and inflation are the three measures most commonly used to assess growth. Together, they cover output levels, labor market strength, and price stability, making them the most widely relied-upon metrics in standard economic analysis.
The five most widely recognized economic indicators are GDP, CPI, unemployment rate, interest rates, and consumer confidence. Analysts use this set to evaluate both current economic conditions and expectations for the period ahead.
Governments, investors, corporations, economists, and financial analysts all draw on economic indicators examples to guide policy, allocate capital, evaluate risk, and understand market conditions across different time horizons.
Economic indicators examples provide the data foundation that policymakers, investors, and business leaders need to make sense of shifting market conditions.
By tracking the right measures consistently, it becomes possible to spot trends early, weigh risks with greater precision, and position decisions around evidence rather than assumptions.
Whether the goal is forecasting growth, managing financial exposure, or refining a longer-term strategy, the ability to read and interpret these indicators accurately is a core competency in today’s data-driven environment.
Combine that skill with strong visualization tools, and the insights embedded in the numbers become far clearer and more actionable.
How much did you enjoy this article?


Calculate accounts receivable turnover ratio to measure credit collection speed, improve cash flow, and strengthen your financial strategy. Read on!

Change Management KPIs are the key to tracking adoption, performance, and ROI during transitions. Find out which metrics matter. Read on!

Data collection methods and techniques determine the quality of every insight you act on. Explore key approaches for gathering reliable data. Read on!


