Categories
Economic profit and accounting profit sound like two peas in a pod. But don’t be fooled by their seemingly interchangeable names. These concepts are as different as a penny-pinching accountant and a risk-taking entrepreneur.


Understanding the nuances of Economic Profit vs. Accounting Profit is crucial for anyone navigating the realms of finance and business strategy.
Accounting profit loves to play by the rules. It takes into account explicit costs, like wages, materials, and other expenses. It’s the profit that puts a smile on your face when you see it on your income statement.
Economic profit, on the other hand, is the revolutionary of the profit party. It goes beyond the explicit costs and includes the opportunity cost of resources.
It considers the value of what you could have done with those resources if you had used them differently. Economic profit isn’t afraid to challenge the status quo and push the boundaries of what’s possible.
So, why does comparing economic profit vs. accounting profit matter?
It helps you see the bigger picture. You get insights into the performance of your business beyond what the numbers on your balance sheet say. Thus, you can make informed decisions and understand the real value you’re creating.
Now, let’s dig deeper into Economic Profit vs. Accounting Profit.
Accounting Profit is the difference between total revenue and explicit costs (e.g., wages, rent) recorded in financial statements. Economic Profit considers both explicit and implicit costs (e.g., opportunity costs) and measures the true profitability of a business.
Economic profit is typically lower than accounting profit because it accounts for the cost of foregone alternatives.
Definition: Economic profit is a financial metric that factors explicit and implicit costs, including opportunity costs. Unlike accounting profit, it considers the total cost of resources used, emphasizing the true profitability of an endeavor.
Economic profit accounts for the value of alternative uses of resources, providing a more comprehensive measure that considers both monetary gains and forgone opportunities. By analyzing marginal revenue vs marginal cost, it offers a deeper insight into overall financial performance
The formula for economic profit is expressed as follows:
Economic Profit = Total Revenue – Explicit Costs – Implicit Costs
Definition: Accounting profit is a financial metric representing the profit a company reports on its income statement in Excel. It is calculated by subtracting total expenses, including explicit costs like operating expenses and interest, from total revenue.
Accounting profit provides a standardized view of profitability based on accepted accounting principles. It offers a straightforward measure of a company’s financial performance without considering implicit or opportunity costs.
The formula for accounting profit is:
Accounting Profit = Total Revenue – Total Explicit Costs
Where:
Imagine a freelance graphic designer who is evaluating the profitability of their business.
Total Revenue: $80,000
Explicit Costs:
Implicit Costs:
1. Accounting Profit: Accounting Profit = Total Revenue – Total Explicit Costs = $80,000 – ($5,000 + $7,000 + $12,000 + $2,500 + $3,500) = $80,000 – $30,000 = $50,000
2. Economic Profit: Economic Profit = Total Revenue – Total Explicit Costs – Total Implicit Costs = Accounting Profit – Total Implicit Costs = $50,000 – ($40,000 + $8,000) = $50,000 – $48,000 = $2,000
Let’s separate the economic profit vs. accounting profit, shall we?
Economic profit includes explicit costs (monetary expenses) and implicit costs (non-monetary expenses, such as opportunity costs).
It considers the value of resources used in a venture, whether paid in cash or not. Conversely, accounting profit only includes explicit costs, focusing on monetary transactions recorded in financial statements.
Economic profit calculations consider the opportunity costs. These costs represent the value of the next best alternative foregone when a particular resource is used.
Thus, it reflects the actual cost of resources employed. On the other hand, opportunity costs are not factored into accounting profit. The focus is primarily on direct monetary expenses incurred by the business.
Economic profit provides a broader measure of profitability by considering both explicit and implicit costs. It offers a holistic view of the actual financial impact of an investment or business activity. Contrarily, accounting profit offers a narrower perspective, limited to the financial transactions recorded in accounting books. It provides a standardized view based on accepted accounting principles.
Economic profit assesses a business’s actual economic value by accounting for all costs involved. This leads to a more accurate evaluation of profitability. Conversely, accounting profit reflects the financial performance of a business according to conventional accounting standards. It may not capture the true economic picture due to excluding implicit costs.
Economic profit can be positive, negative, or zero. A positive economic profit indicates that the business generates returns above and beyond the cost of all resources used. In contrast, a negative economic profit suggests the venture may not be economically viable.
Typically, accounting profit results in positive values as it focuses on explicit costs. It may not reflect the true economic success of an endeavor, especially when opportunity costs are high.
Follow these steps to compare economic profit vs. accounting profit better.
Economic profit recognizes explicit and implicit costs, including opportunity costs, providing a comprehensive measure of profitability. In comparison, accounting profit focuses on explicit costs recorded in financial statements, omitting implicit costs and opportunity costs.
Economic profit comprises Net Operating Profit After Tax (NOPAT) minus the total cost of capital, including opportunity costs. On the other hand, accounting profit involves subtracting explicit costs from total revenue, providing a standard accounting measure.
Economic profit offers a broader assessment, considering all costs associated with a business activity. Thus, it provides a more accurate reflection of economic success. Accounting profit offers a more limited view, adhering to accounting principles, and may not capture all economic factors.
The economic profit is valuable for strategic decision-making, as it considers the true economic impact of an investment. Conversely, accounting profit is commonly used for financial reporting and tax purposes. However, it may not fully inform strategic decisions due to its limited scope.
Economic profit offers insights into the long-term sustainability of an endeavor by considering all costs, including opportunity costs. Accounting profit may not provide a complete picture of long-term sustainability, as it focuses on immediate financial outcomes.
Economic profit can be positive, negative, or zero, reflecting the actual economic success of an endeavor. Accounting profit typically results in positive values. This potentially masks economic realities, especially when significant opportunity costs are involved.
Economic profit informs strategic planning by providing a holistic view of profitability. This encourages decisions that consider the full economic impact. In contrast, accounting profit may lead to suboptimal decisions if not supplemented with additional economic analysis. It focuses primarily on accounting conventions.
Visualizations take center stage in data analysis, turning complex datasets into visual symphonies that resonate with insights. However, Excel, the traditional maestro of spreadsheets, sometimes falls short in the grand orchestration of data visualization.
Fear not, for there is a hero in town ChartExpo. ChartExpo adds a visual dimension to analysis, allowing for a more nuanced exploration of accounting profit, and economic profit.
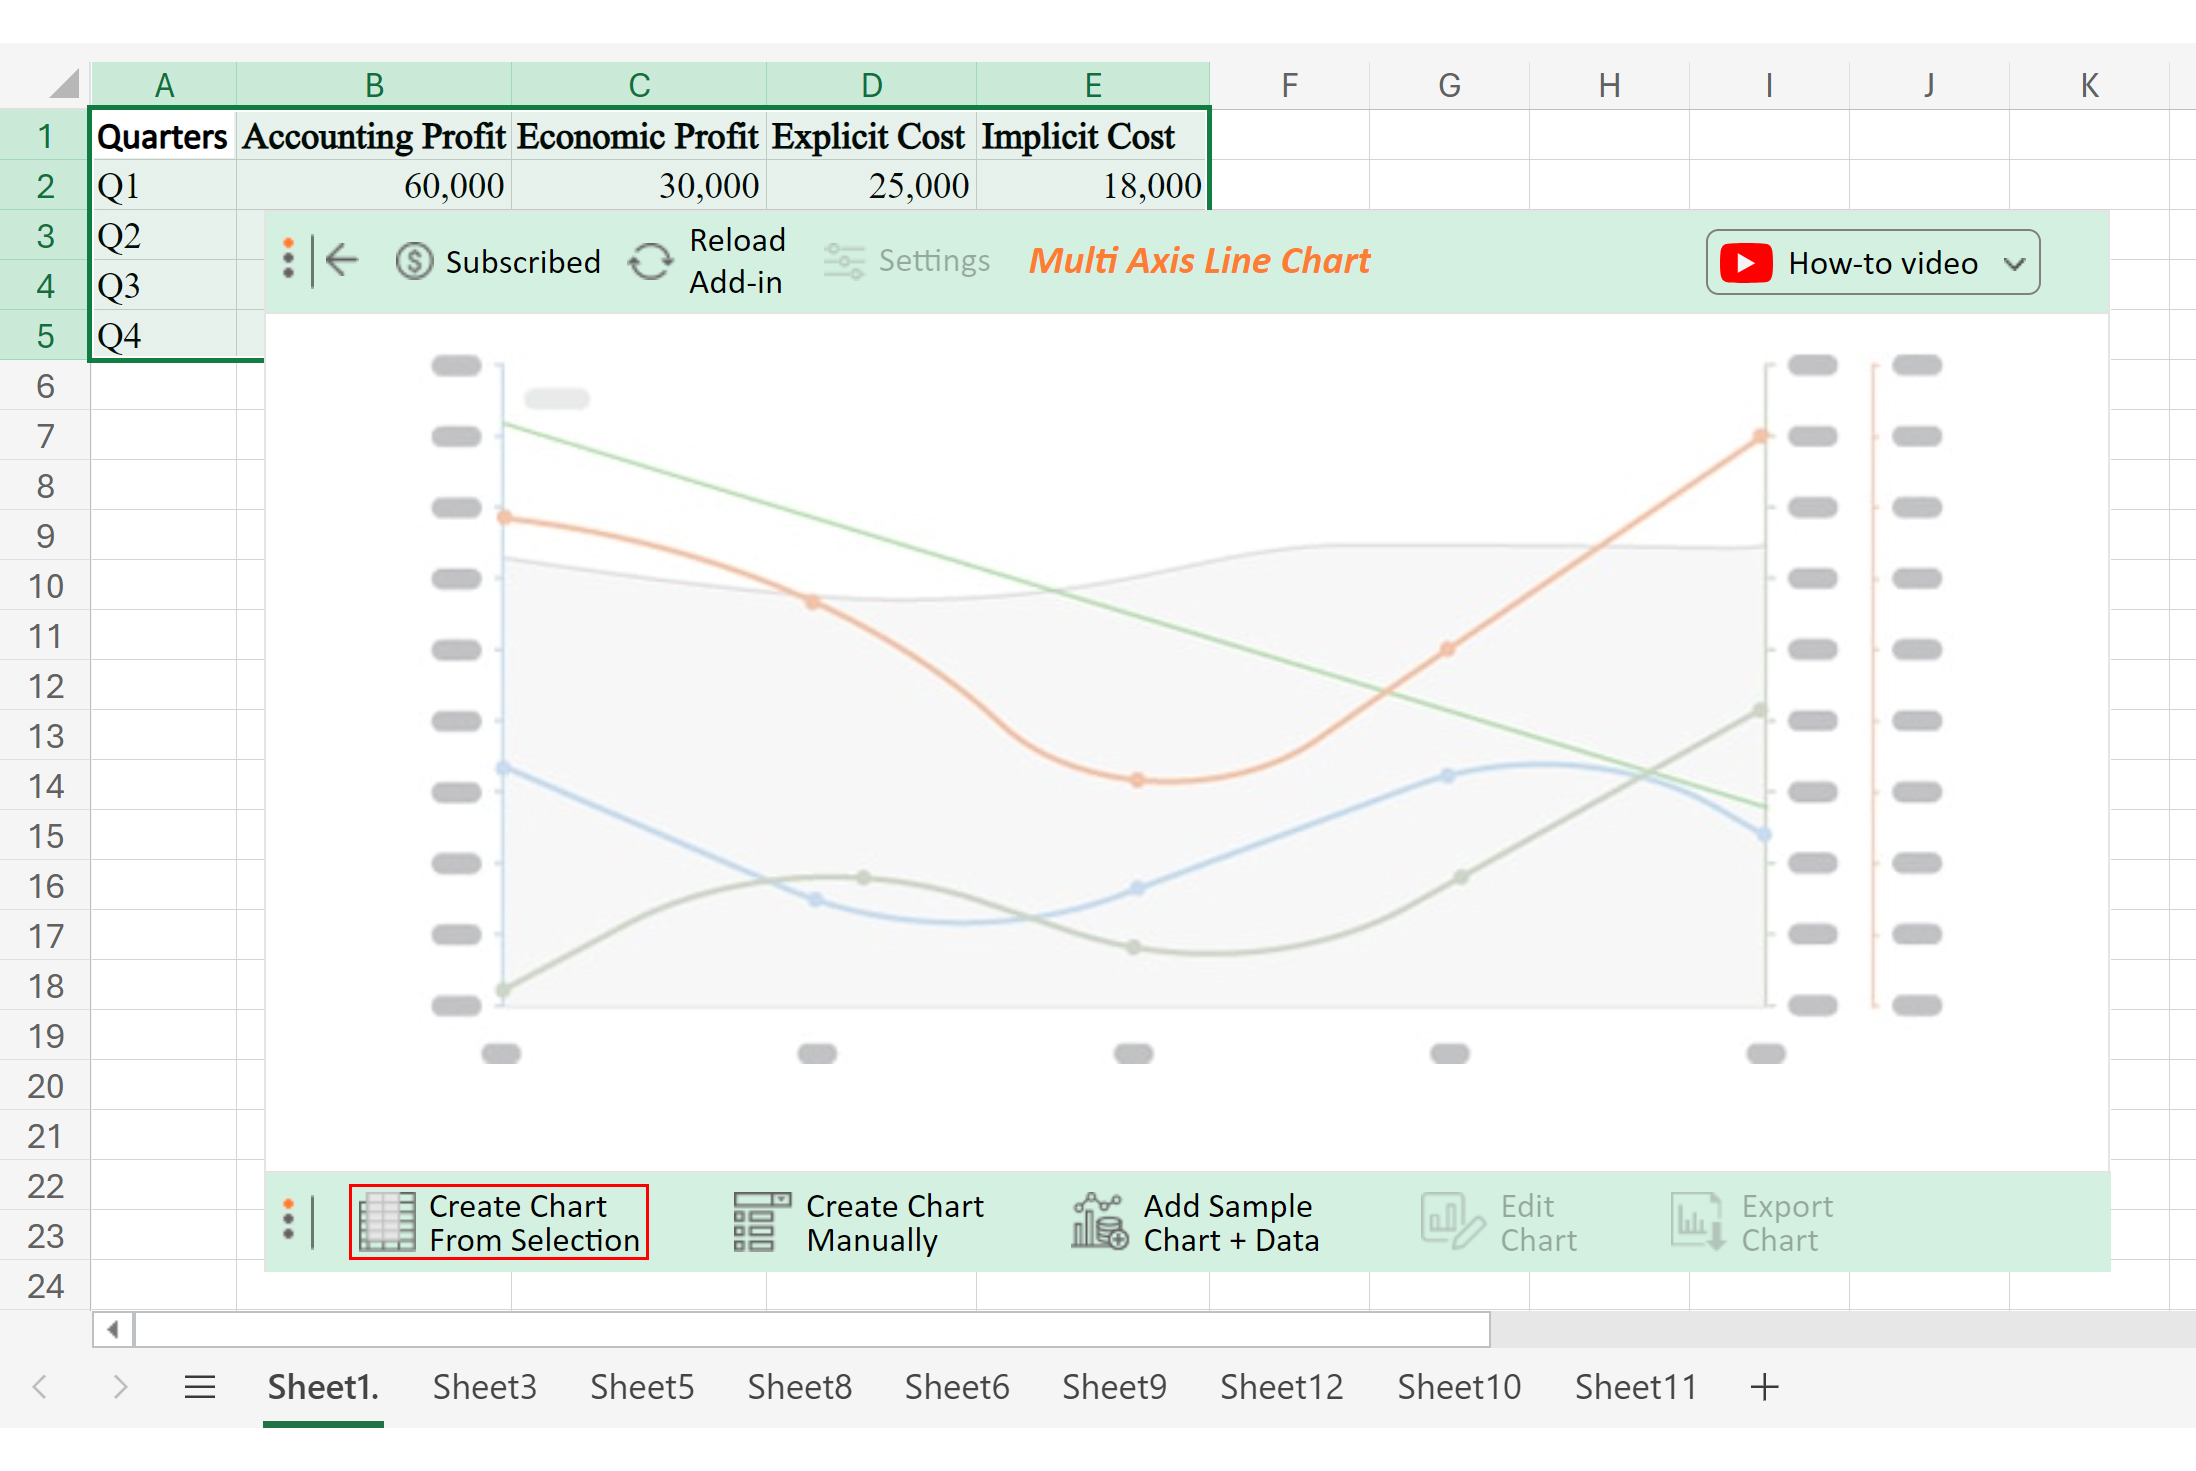
Let’s learn how to install ChartExpo in Excel.
ChartExpo charts are available both in Google Sheets and Microsoft Excel. Please use the following CTA’s to install the tool of your choice and create beautiful visualizations in a few clicks in your favorite tool.
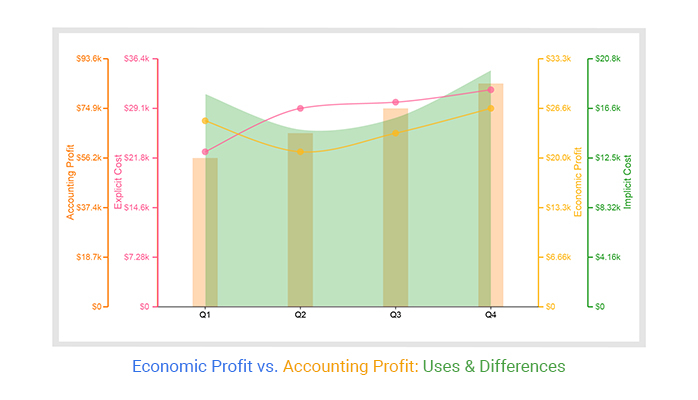
The sample data below presents quarterly financial metrics, distinguishing between accounting profit and economic profit. It also includes explicit and implicit costs, providing insights into the company’s financial performance and cost structure.
| Quarters | Accounting Profit | Economic Profit | Explicit Cost | Implicit Cost |
| Q1 | 60,000 | 30,000 | 25,000 | 18,000 |
| Q2 | 70,000 | 25,000 | 32,000 | 15,000 |
| Q3 | 80,000 | 28,000 | 33,000 | 16,000 |
| Q4 | 90,000 | 32,000 | 35,000 | 20,000 |
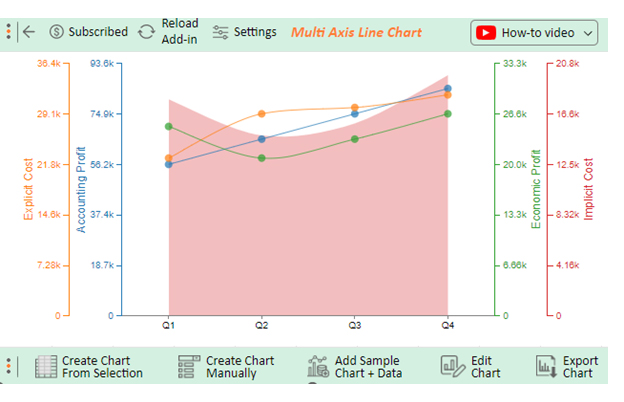
Let’s create a visualization of this data with ChartExpo to help us glean insights.


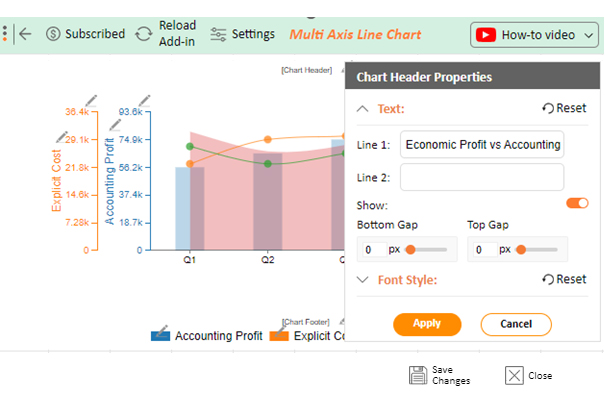
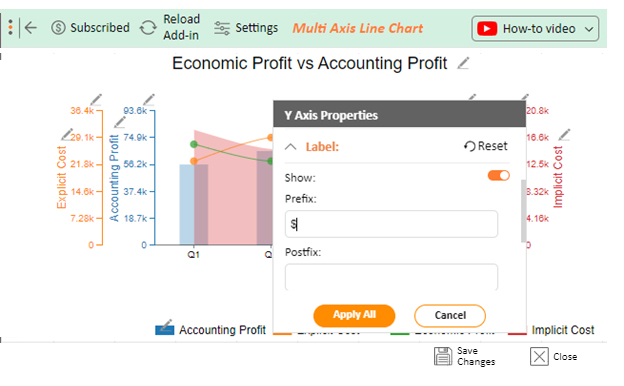
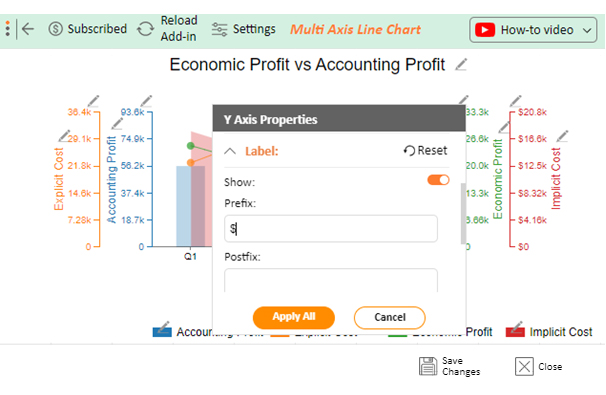
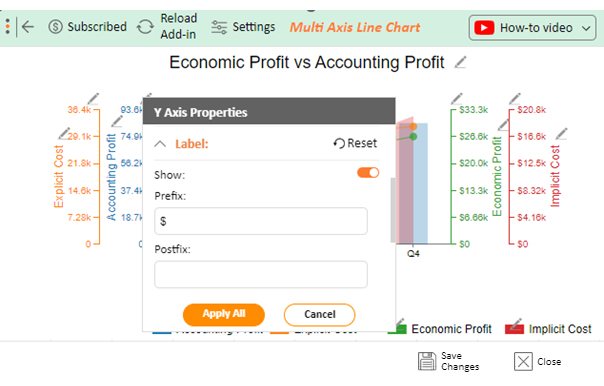
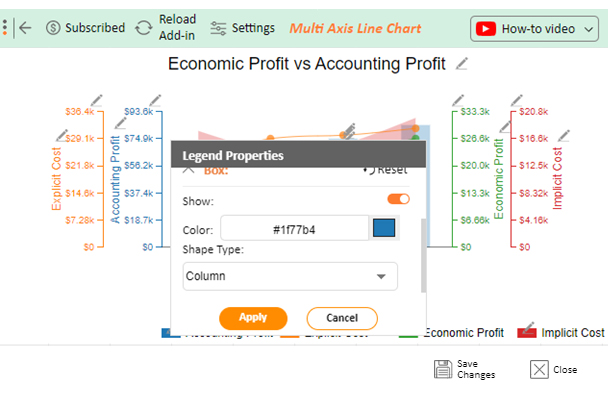
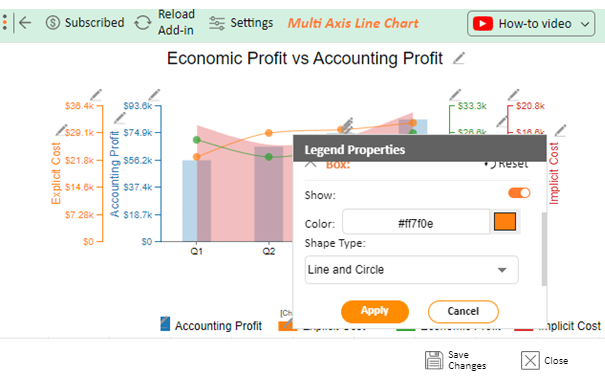
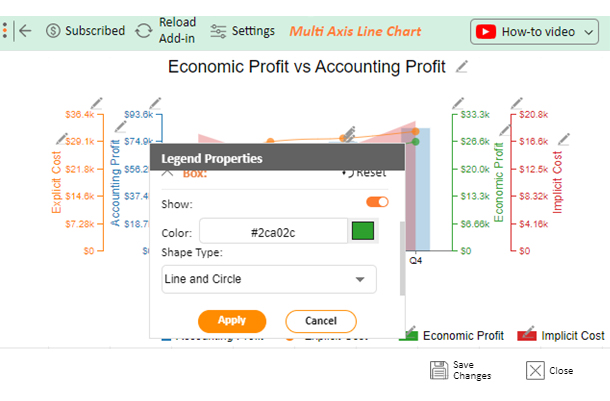
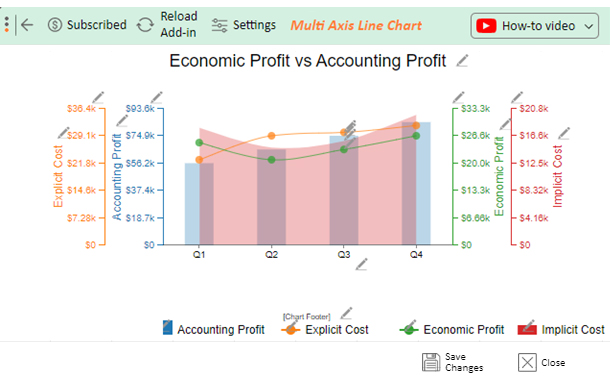
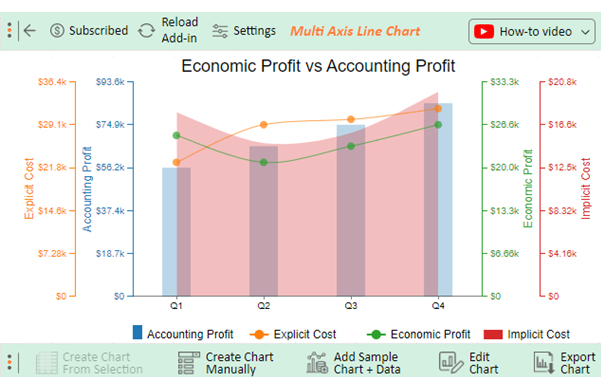
The data unveils the financial performance of the company across four quarters. Although accounting profits demonstrate a steady rise, economic profits exhibit fluctuations attributed to changing explicit and implicit costs.
Notably, elevated explicit costs in Q4 led to a boost in economic profit. This observation contributes valuable insights into deciphering the intricate relationship between financial metrics and different cost components.
No, accounting profit is not always greater than economic profit. Economic profit considers both explicit and implicit costs, including opportunity costs, providing a broader measure. Accounting profit focuses solely on explicit costs recorded in financial statements, potentially resulting in different outcomes.
A firm’s economic profit is less than its accounting profit because economic profit includes implicit and opportunity costs. Accounting profit, considering only explicit costs, tends to be a more conservative measure of profitability.
To compare economic profit vs. accounting profit, use ChartExpo. ChartExpo visualizes the nuanced relationship between these metrics, uncovering insights beyond numbers. The intuitive interface makes analysis seamless, offering a dynamic perspective on financial performance.
The comparison between Economic Profit vs. Accounting Profit delves into the intricate facets of financial performance measurement.
Accounting profit, rooted in conventional financial reporting, provides a clear snapshot based on explicit costs and revenues. However, economic profit introduces a richer dimension by considering implicit costs, notably the value of forgone opportunities. This distinction becomes pivotal in decision-making, influencing resource allocation and strategic planning.
Understanding the interplay of these metrics is paramount, as it ensures a comprehensive evaluation of profitability. Accounting profit serves as a fundamental benchmark for financial reporting, laying the groundwork for compliance with accounting practices. Economic profit extends the narrative by revealing the true profitability of an endeavor, incorporating the broader economic landscape.
With ChartExpo, the comparison journey evolves into an expedition of financial discovery. Each chart tells a story that transcends mere balance sheets. Embrace the transformative power of ChartExpo today and watch your data come to life with insights.
How much did you enjoy this article?


Calculate accounts receivable turnover ratio to measure credit collection speed, improve cash flow, and strengthen your financial strategy. Read on!

Change Management KPIs are the key to tracking adoption, performance, and ROI during transitions. Find out which metrics matter. Read on!

Data collection methods and techniques determine the quality of every insight you act on. Explore key approaches for gathering reliable data. Read on!


