Categories
Board members don’t have time for noise. They need actionable intelligence delivered in a format that cuts through complexity.
That’s where a Board Report Template earns its keep—giving leadership teams a repeatable structure for presenting performance data, strategic updates, and risk assessments without burying decision-makers in operational minutiae.
When governance conversations veer off track, it’s often because the reporting format itself creates confusion. A solid template fixes this by establishing what gets reported, how it’s organized, and where attention should focus. The result? Faster decisions, clearer accountability, and board meetings that actually move the organization forward instead of rehashing yesterday’s data.
Definition: Think of a Board Report Template as the architectural blueprint for how you package critical business intelligence. It’s a predefined structure that dictates where financial summaries go, how risk indicators appear, and what strategic commentary looks like—all before anyone starts writing.
The distinction matters: operational reports track daily execution, while board-level reports focus on outcomes and directional choices.
A properly constructed template ensures every report follows the same logic, making it easier for board members to spot trends, compare periods, and understand what actually requires their input versus what’s simply informational background.
Effective governance relies on information that’s both relevant and digestible. A Board Report Template serves this need by creating a standardized pathway for intelligence to flow from operations to oversight. Here’s what this standardization delivers:
Board reporting isn’t one-size-fits-all. The template you choose depends on what kind of oversight your board provides, what industry dynamics you’re navigating, and where governance attention needs to land. Matching template type to governance role prevents the classic mistake of reporting everything while clarifying nothing.
An effective board report format sequences information to match how decision-makers actually consume it. Start with conclusions, layer in supporting evidence, then provide context. Skip this logic, and you’ll watch board members flip pages hunting for the point. Here’s what belongs:
Including these components ensures your report to the board template stays focused, complete, and geared toward action rather than passive review.
Seeing how templates adapt to different reporting rhythms clarifies what actually works in practice. Here’s how board reporting shifts based on whether you’re reviewing monthly operations, quarterly trajectories, or annual performance.
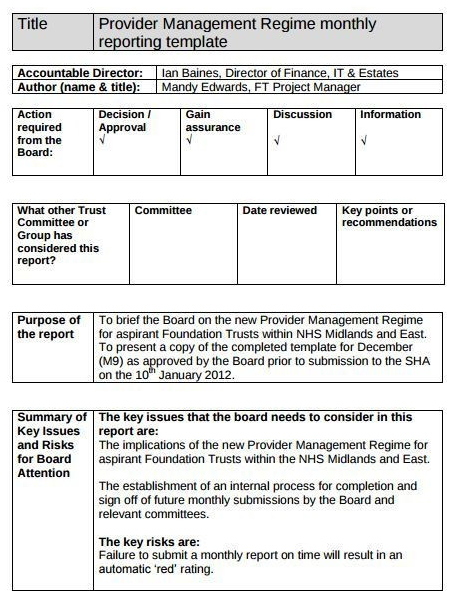
The monthly board report example zeros in on near-term liquidity and operational velocity. This format typically draws from a monthly finance report that tracks cash positioning and immediate spending patterns.
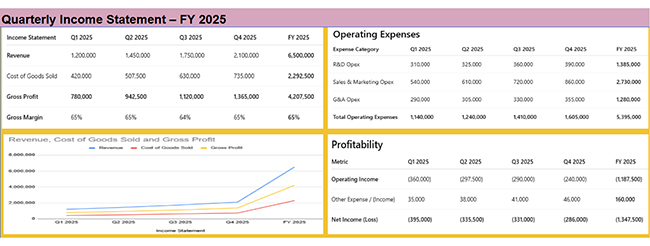
This quarterly performance board report example shows steady revenue growth and stable margins, with investment-driven operating losses gradually improving toward Q4.
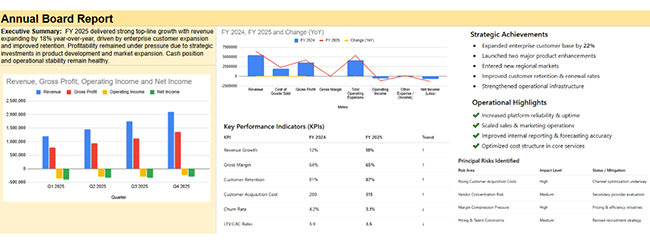
The annual board report template delivers a comprehensive review of performance outcomes, revenue growth, improved retention, and implementation progress for full-year board accountability and strategic assessment.
Building a reusable Board Report Template begins with understanding what your board actually needs to make informed choices. Start there, then work backward to structure the information flow. Here’s the creation sequence:
This approach mirrors best practices in management reporting, where executive clarity and format consistency prevent governance confusion.
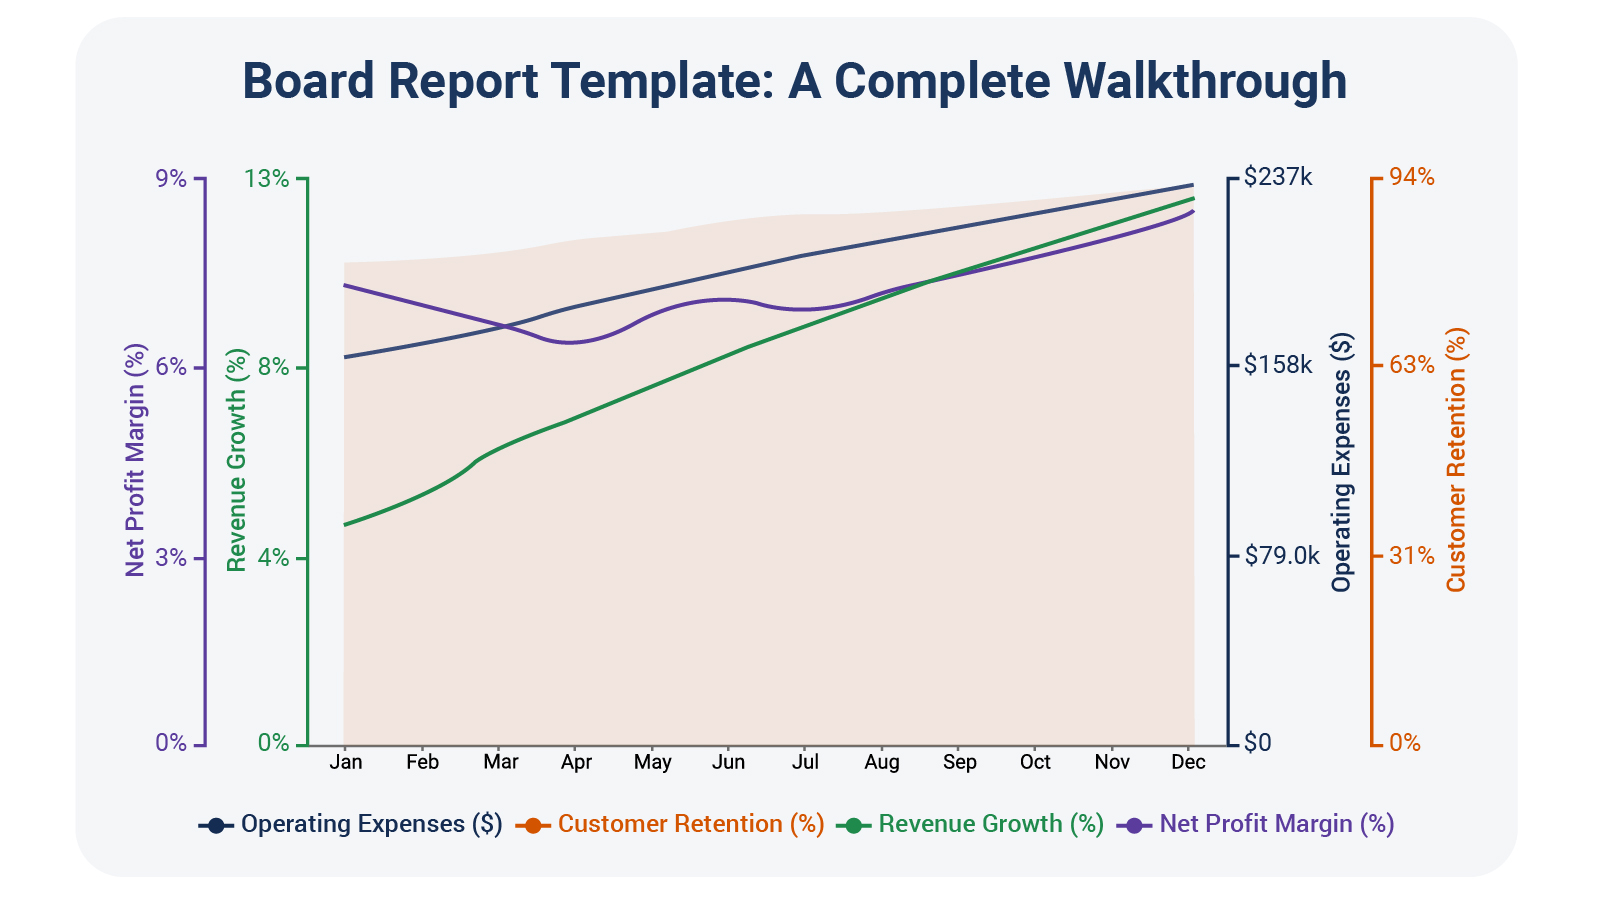
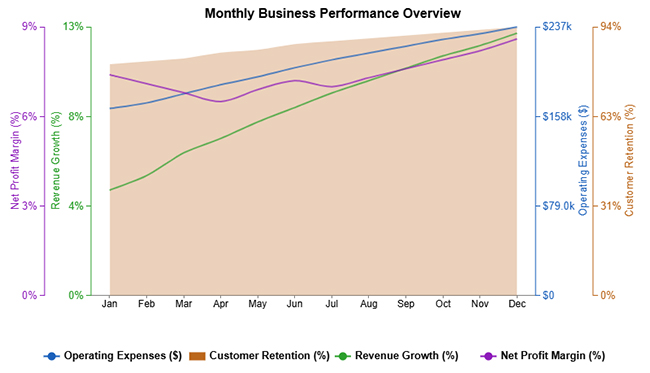
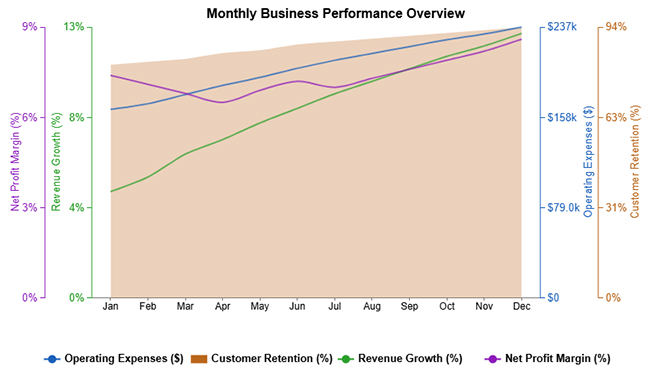
This monthly business performance example tracks revenue expansion and customer retention alongside climbing operational costs and a rebounding net profit margin throughout the reporting period.
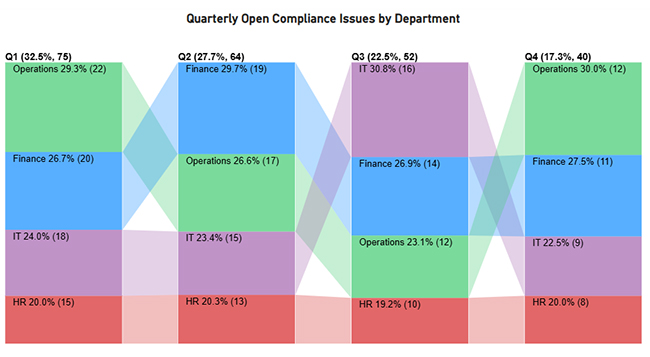
The quarterly open compliance issue example demonstrates how unresolved compliance items fluctuate across departments and quarters, giving boards immediate visibility into risk concentration and accountability for ownership.
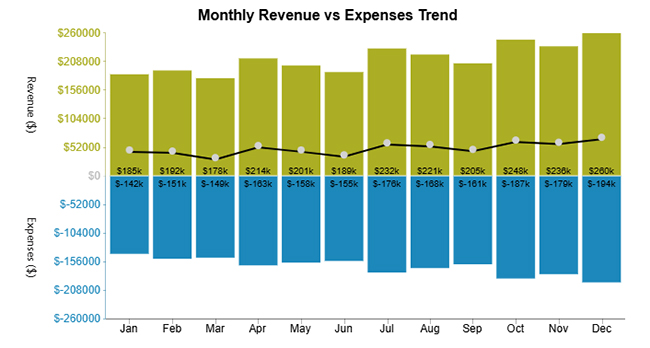
This monthly revenue vs expense trend example reveals expanding top-line performance paired with escalating cost structures, enabling boards to evaluate margin sustainability and expense discipline.
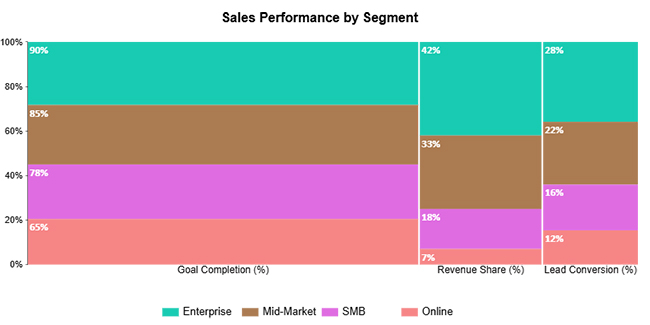
The sales performance example breaks down contribution by customer segment, providing the strategic context boards need to direct resources toward high-value opportunities.
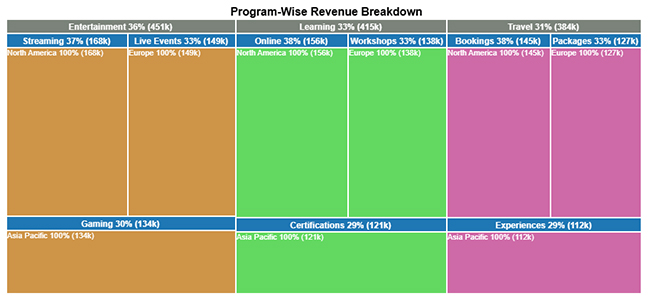
This program-wise revenue breakdown example quantifies each program’s revenue share, giving boards the data required to prioritize strategic investments and resource allocation.
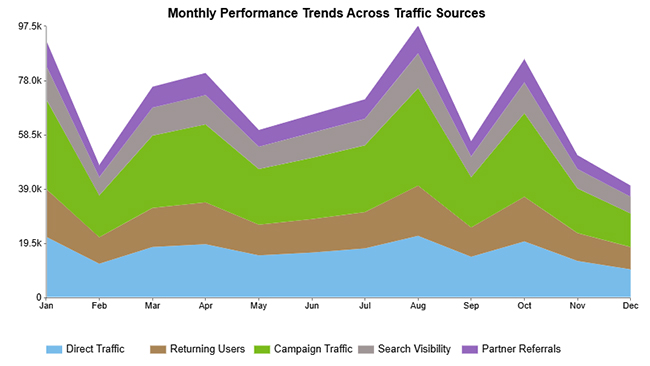
This monthly performance trend across traffic sources example illustrates how individual channels drive overall performance metrics, delivering the channel-specific intelligence boards need for go-to-market decisions.
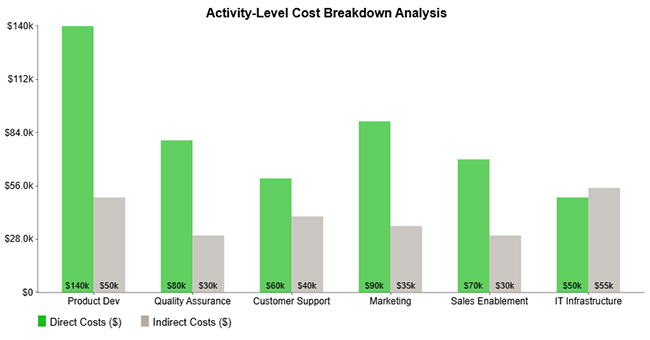
The activity-level cost breakdown analysis contrasts direct versus indirect spending across critical activities, exposing the primary cost drivers and efficiency gaps boards can address.
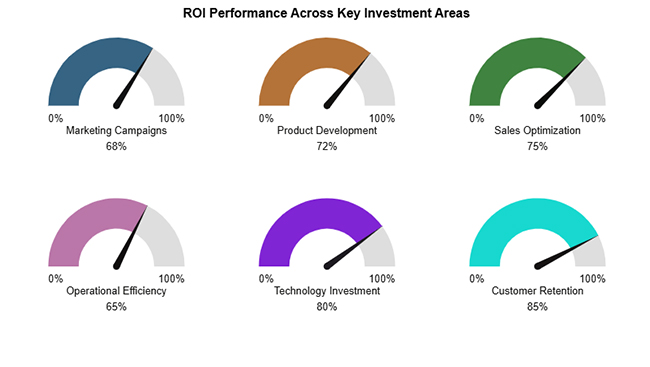
This ROI performance across key investment areas example shows how successfully priority initiatives generate returns relative to capital deployed.
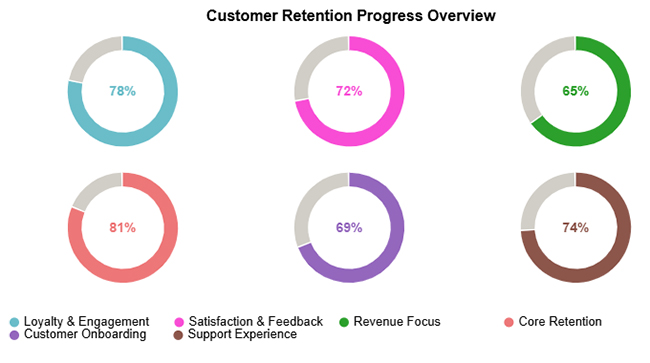
The customer retention progress example captures retention metrics across strategic focus areas, enabling rapid board assessment of customer loyalty initiatives.
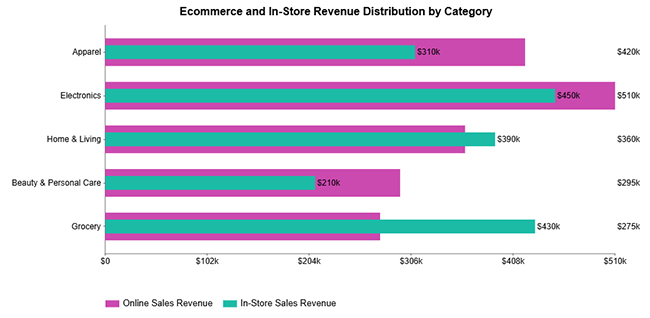
This e-commerce and in-store revenue distribution example compares digital versus physical sales performance by product category, informing channel strategy and investment priorities.
Analyzing a board report format in Google Sheets lets teams verify trends, benchmark performance across periods, and surface decision-ready insights from raw data.
ChartExpo integrates directly with Google Sheets to transform how board data gets visualized.
How to install ChartExpo in Google Sheets?
The final result is shown below.
A Board Report Template gives leadership teams a proven structure for communicating with board members clearly, consistently, and with decision-focused precision. Here’s what this consistency delivers:
Reliable board reporting complements insights from a progress report, which monitors execution milestones and implementation velocity over time.
Implementing best practices keeps your template focused, readable, and valuable for board members who review it under time pressure.
These practices echo the same principles applied in a consulting report template, where executive-focused communication clarity is non-negotiable.
Even well-intentioned templates lose impact when common design pitfalls sneak in. These errors diminish clarity and weaken board engagement. Avoid them:
Some teams mistakenly repurpose formats like a construction project daily report template, which introduces operational granularity unsuitable for board review. Similarly, structured updates such as a project status reports template require careful adaptation before being elevated to governance-level reporting.
A board report is often referred to as a board pack, board briefing, or executive board report.
A Board Report Template standardizes how performance, risks, and strategic updates are communicated to the board.
Board reports are typically prepared by senior management and leadership teams responsible for organizational performance.
Most organizations update their template monthly or quarterly, depending on governance requirements.
A well-constructed Board Report Template strengthens governance by delivering intelligence that’s clear, consistent, and ready for action.
When you pair effective template design with powerful visualization tools like ChartExpo, board reports transform from routine documentation into strategic assets that drive smarter decisions, sharper focus, and better alignment between operational execution and strategic oversight.
The payoff shows up in faster board meetings, clearer accountability trails, and governance discussions centered on what actually moves the business forward instead of rehashing historical data.
Templates don’t guarantee perfect decisions, but they eliminate the friction that prevents decision-makers from seeing what matters most and acting on it with the confidence that comes from having reliable, actionable information.
How much did you enjoy this article?


Calculate accounts receivable turnover ratio to measure credit collection speed, improve cash flow, and strengthen your financial strategy. Read on!

Change Management KPIs are the key to tracking adoption, performance, and ROI during transitions. Find out which metrics matter. Read on!

Data collection methods and techniques determine the quality of every insight you act on. Explore key approaches for gathering reliable data. Read on!


