• Home
  • Tools dropdown img
    • Spreadsheet Charts

      • ChartExpo for Google Sheets
      • ChartExpo for Microsoft Excel
    • Power BI Charts

      • Power BI Custom Visuals by ChartExpo
    • Word Cloud

  • Charts dropdown img
    • Chart Category

      • Bar Charts
      • Circle Graphs
      • Column Charts
      • Combo Charts
      • Comparison Charts
      • Line Graphs
      • PPC Charts
      • Sentiment Analysis Charts
      • Survey Charts
    • Chart Type

      • Box and Whisker Plot
      • Clustered Bar Chart
      • Clustered Column Chart
      • Comparison Bar Chart
      • Control Chart
      • CSAT Survey Bar Chart
      • CSAT Survey Chart
      • Dot Plot Chart
      • Double Bar Graph
      • Funnel Chart
      • Gauge Chart
      • Likert Scale Chart
      • Matrix Chart
      • Multi Axis Line Chart
      • Overlapping Bar Chart
      • Pareto Chart
      • Radar Chart
      • Radial Bar Chart
      • Sankey Diagram
      • Scatter Plot Chart
      • Slope Chart
      • Sunburst Chart
      • Tornado Chart
      • Waterfall Chart
      • Word Cloud
    • Google Sheets
      Microsoft Excel
  • Services
  • Pricing
  • Contact us
  • Blog
  • Support dropdown img
      • Gallery
      • Videos
      • Contact us
      • FAQs
      • Resources
    • Please feel free to contact us

      atsupport@chartexpo.com

Categories
All Data Visualizations Data Analytics Surveys
Add-ons/
  • Google Sheets
  • Microsoft Excel
  • Power BI
All Data Visualizations Data Analytics Surveys
Add-ons
  • Google Sheets
  • Microsoft Excel
  • Power BI

We use cookies

This website uses cookies to provide better user experience and user's session management.
By continuing visiting this website you consent the use of these cookies.

Ok

ChartExpo Survey


Home > Blog > Data Analytics

Cost Breakdown Template for Better Budget Visibility

Budgets rarely fall apart in one big moment. They usually bleed out in small, avoidable charges. A cost breakdown worksheet puts a spotlight on where cash is going and what it’s buying. That kind of clarity keeps planning honest and accountability real.

Cost Breakdown Template

When expenses get sorted into clean buckets, the worksheet turns noise into a workable plan. Teams can see what’s driving spend, control the budget, and defend decisions without hand-waving. It fits projects, operations, and department planning, and it helps stop ugly surprises.

Table of Contents:

  1. What is a Cost Breakdown Template?
  2. Why is the Cost Breakdown Template Important?
  3. When to Use a Cost Breakdown Template?
  4. Key Components and Features of a Cost Breakdown Template
  5. Cost Breakdown Template Examples
  6. How to Create a Cost Breakdown Template in Excel?
  7. How to Analyze a Cost Breakdown Template in Excel?
  8. Benefits of a Cost Breakdown Template
  9. Best Practices for Using a Cost Breakdown Template
  10. Limitations of a Cost Breakdown Template
  11. FAQs
  12. Wrap-Up

What is a Cost Breakdown Template?

Definition: A Cost Breakdown template is a structured worksheet that lists every expected expense for a project, activity, or operation and groups each line into clear categories. It shows how money is split across direct and indirect costs, plus fixed and variable items, so costs don’t hide in the totals.

The goal is simple: build a budget that can stand up to real life. The template makes cost drivers obvious, supports approvals, and keeps scope and spending connected. It’s common in project work, construction, manufacturing, and corporate planning because it keeps financial conversations grounded.

Why is the Cost Breakdown Template Important?

Clear cost detail tightens decisions and keeps surprise spending off the agenda.

  • Clearer cost visibility across activities and departments.
  • More accurate budgets and smarter fund allocation.
  • Easier reporting for stakeholders and managers.
  • Stronger forecasting support for planning teams later on.
  • Lower risk of late cost overruns.

When to Use a Cost Breakdown Template?

It pays off any time cost clarity is needed before money moves, while work is underway, or after results are reviewed. The format supports upfront planning and steady tracking.

  • At the kickoff and early project planning stages.
  • For proposals and competitive bid work.
  • For leadership and stakeholder approvals.
  • During execution for steady cost tracking.
  • Run cost-benefit analysis early.

Key Components and Features of a Cost Breakdown Template

A solid Cost Breakdown Template has a few non-negotiables that keep the numbers clean and comparable. These pieces make the layout easy to scale, even when the work gets complicated.

  • Well-defined cost categories and subcategories upfront.
  • Item-level descriptions that stay clear.
  • Quantity and unit-cost fields for accuracy each time.
  • Subtotals and a total.
  • Time-based allocation for phased spend tracking.

Put these elements together and Excel becomes a reliable home for the template, with totals that update quickly and issues that surface early.

Cost Breakdown Template Examples

Different teams need different layouts, yet the objective stays the same. A Cost Breakdown Template should make spending easy to explain and hard to misread.

Example #1:

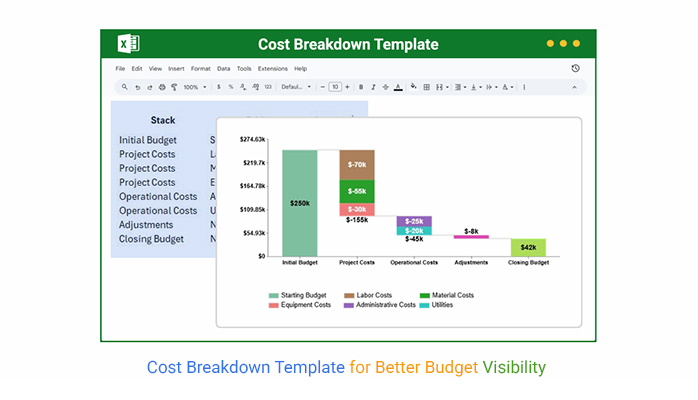
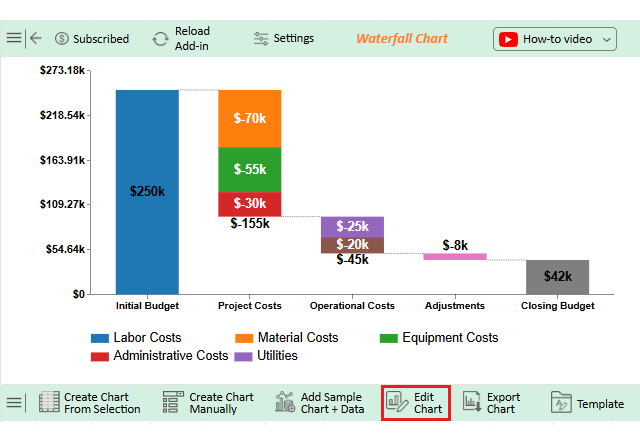
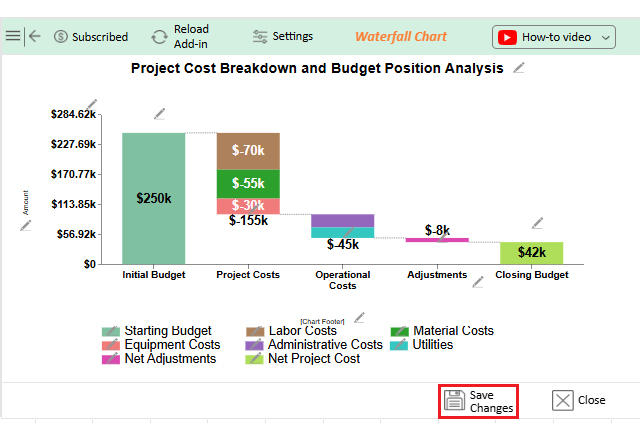
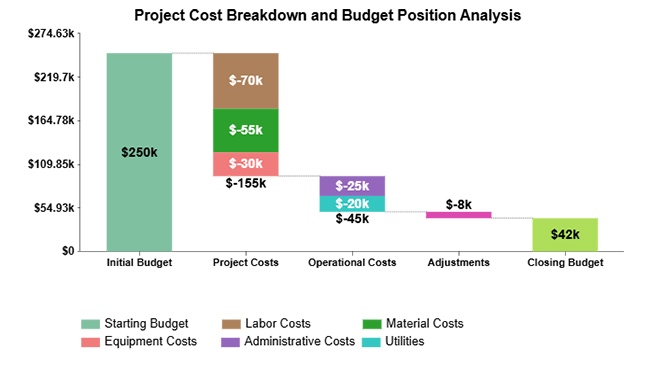
A stacked waterfall view shows how separate cost blocks pull down an opening budget and where the closing number finally lands. It’s a fast way to spot the biggest hits.

Cost Breakdown Template

Example #2:

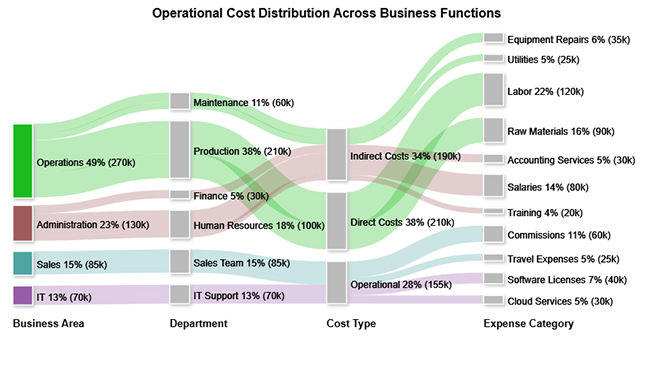
A Sankey Diagram shows how costs flow across departments, cost types, and categories, so concentration points stand out. It’s handy when operational spend keeps drifting.

Cost Breakdown Template

Example #3:

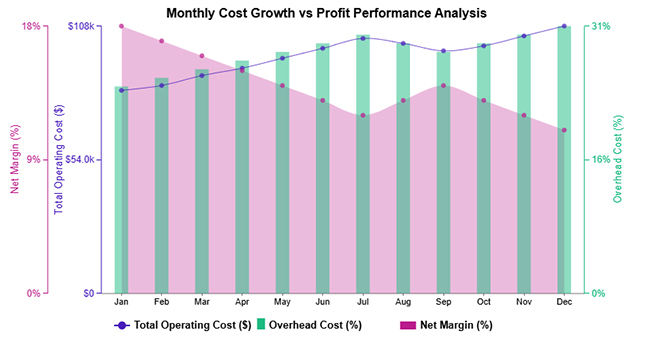
A multi-axis line view tracks operating costs alongside overhead rates so the impact on profit margins is easier to see. Trends don’t stay hidden.

Cost Breakdown Template

Example #4:

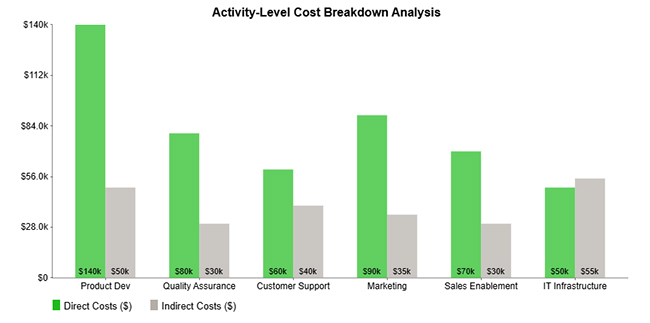
A clustered column view compares direct and indirect spending across activities, making the heavy consumers obvious. It answers the “where’s it going” question fast.

Cost Breakdown Template

Example #5:

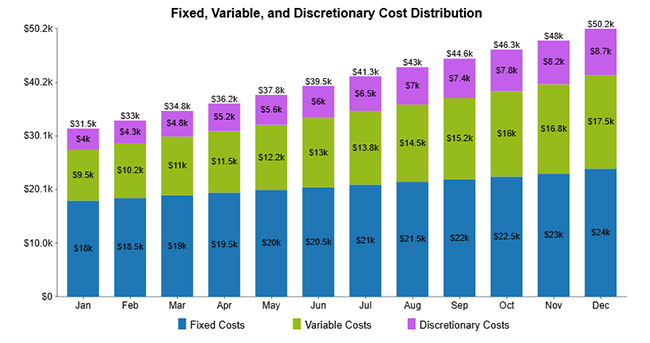
A stacked column view rolls fixed, variable, and discretionary costs into monthly totals so shifts in the cost mix are easy to compare over time. It’s useful when the structure changes month to month.

Cost Breakdown Template

How to Create a Cost Breakdown Template in Excel?

A structured template keeps cost tracking consistent, even when the work stream changes. An Excel cost breakdown template sets up a standard place to capture inputs, calculate totals, and review spending without manual rework. Fewer hand edits mean fewer quiet errors.

  • Set cost categories first so expense types don’t mix in reports.
  • Enter each cost item with a clear description for later review.
  • Use formulas for subtotals and totals so math stays consistent each time.
  • Format headers, borders, and numbers so the sheet reads cleanly.
  • Add charts or an add-in when visuals are needed for trends and mix.
  • Save it as a template so future projects start fast and stay consistent too.

How to Analyze a Cost Breakdown Template in Excel?

An Excel cost breakdown template isn’t just for totals. The real value comes from spotting what’s driving spend, where it’s drifting, and what needs a decision.

  1. Review categories to spot big drivers and unusual variances quickly, then flag them.
  2. Compare plan and actual costs with a budget vs actual Excel template to find gaps.
  3. Review fixed versus variable spend, plus direct cost vs indirect cost, to see what’s really controllable here.
  4. Use ChartExpo to visualize trends, similar to Excel chart templates, so results are easier to explain.

Why use ChartExpo?

  • Turns cost tables into clear, readable visuals fast.
  • Shows trends, variances, and inefficiencies fast.
  • Links costs to performance tracked through a sales pipeline template for better decisions.
  • Includes a 7-day free trial and costs about $10/month after that period ends.

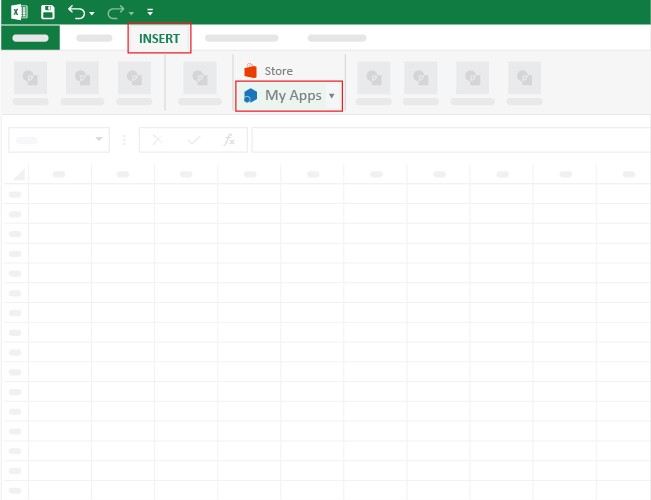
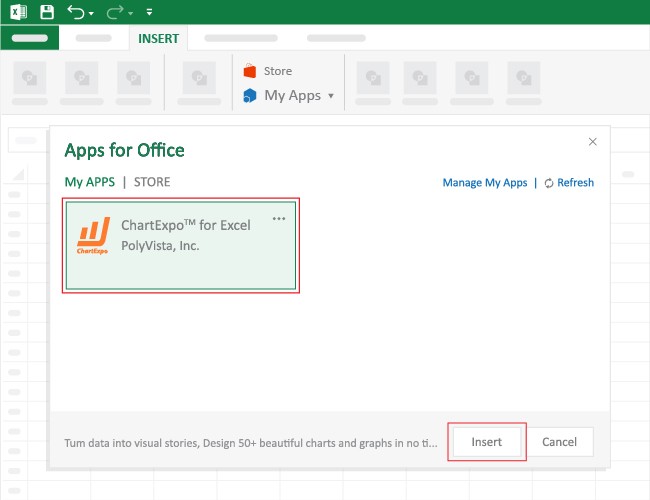
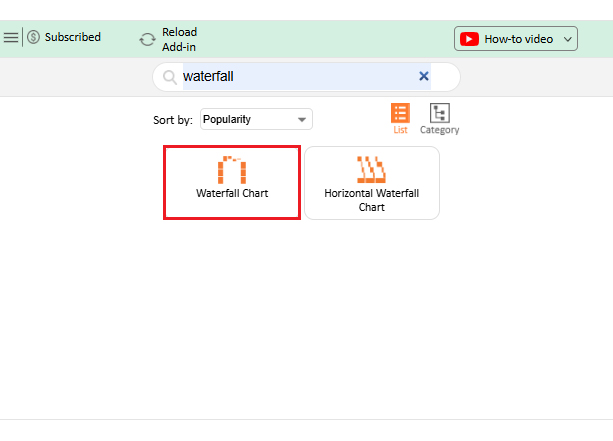
 How to install ChartExpo in Excel?

  1. Open Microsoft Excel first.
  2. Start a worksheet and go to the Insert tab on the ribbon.
  3. Click My Apps to open the Office Add-ins window on screen.
  4. In the Store tab, search for ChartExpo in the Add-ins window list.
  5. Find ChartExpo, then click Add to install the add-in inside Excel.

Example (walkthrough):

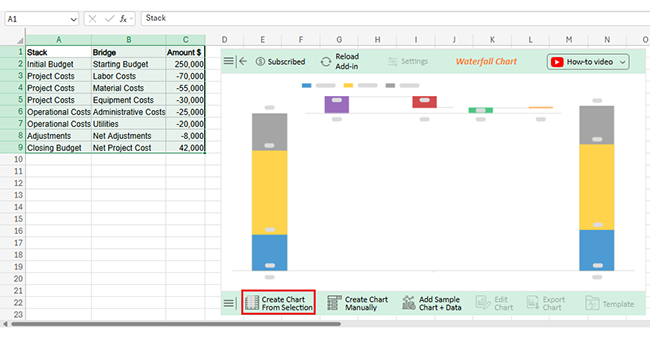
Use the dataset below to build the Stacked Waterfall Chart example in Excel.

Stack

Bridge

Amount $

Initial Budget Starting Budget 250,000
Project Costs Labor Costs -70,000
Project Costs Material Costs -55,000
Project Costs Equipment Costs -30,000
Operational Costs Administrative Costs -25,000
Operational Costs Utilities -20,000
Adjustments Net Adjustments -8,000
Closing Budget Net Project Cost 42,000
  • After ChartExpo is installed, click the Microsoft Excel “INSERT” menu, then open “My Apps” to launch the add-in panel properly.
Cost Breakdown Template
  • The Apps for Office window will open. Find ChartExpo in the list, then press Insert, so it shows up inside your Excel workbook sidebar for use.
Cost Breakdown Template
  • After ChartExpo loads in the sheet, search for or select “Waterfall Chart” from the available chart list.
Cost Breakdown Template
  • Select the dataset range, then click the ‘Create Chart from Selection’ button.
Cost Breakdown Template
  • To adjust the chart, click “Edit Chart” and tweak settings without extra steps or rework.
Cost Breakdown Template
  • To rename the chart, click the pencil icon in the header, type the new title, then press Apply to confirm changes.
Cost Breakdown Template
  • Change bar colors by using the “Legend Properties” option.
Cost Breakdown Template
  • Once the edits look right, click “Save” to store the changes and refresh the chart view.
Cost Breakdown Template
  • The finished Stacked Waterfall Chart should look like the one below.
Cost Breakdown Template

Key Insights

  • Core project costs drive the biggest drop from the initial budget.
  • Operational expenses reduce the budget, but the hit is usually smaller.
  • Controlled adjustments help keep a positive closing budget.

Benefits of a Cost Breakdown Template

A Cost Breakdown Template brings structure to planning and discipline to execution. It keeps discussions focused on drivers, not vague totals, and it supports both day-to-day control and bigger calls.

  • Clearer cost transparency across teams.
  • Tighter financial control and accountability.
  • Easier reporting and cleaner analysis.
  • More accurate planning and forecasting.
  • Stronger ownership of cost lines.
  • Strategic decisions get support via a cost-volume-profit chart.

Best Practices for Using a Cost Breakdown Template

To get real value, the process has to stay consistent. Small lapses in structure turn into big messes later, so discipline pays off.

  • Keep categories consistent and logically grouped always.
  • Update cost data often to avoid errors.
  • Use standard names everywhere.
  • Document assumptions and calculation logic clearly.
  • Validate sources before approvals happen.
  • Review results with stakeholders often.

Pairing it with a business budget template in Excel improves consistency and makes reviews smoother.

Limitations of a Cost Breakdown Template

Even a strong template has limits, and pretending otherwise causes problems.

  • Surprise costs won’t appear automatically in the sheet.
  • Accurate inputs are required on time.
  • Big projects can make it complex.
  • Forecasting stays weak without analysis.
  • Manual updates can take time.

To close these gaps, many teams pair the template with tools such as a cost-versus-value report. Tracking systems, such as a project tracker template in Excel, can also help monitor progress and keep costs under control.

FAQs

How is a cost breakdown structure created?

It’s built by splitting total costs into logical categories and subcategories that match activities, deliverables, or operating needs. Each line should include a description, quantity, and rate so totals can be checked.

Can a cost breakdown template be built using Excel?

Yes. List cost items, quantities, and rates, then use formulas for totals so tracking stays consistent. Add subtotals by category and lock number formats to prevent math drift.

Which projects need a cost breakdown template?

 Any effort with a budget benefits, including construction, IT, marketing, and internal initiatives that need cost control. If vendors, labor, or materials are involved, the template keeps approvals and changes cleaner.

Wrap-Up

A well-built Cost Breakdown Template makes spending patterns easier to spot, control, and explain. When ChartExpo is used for visualization, cost tables become clearer for reviews and updates. The result is better transparency and steadier decisions across projects and operations.

How much did you enjoy this article?

PBIAd1
Start Free Trial!
158352

Related articles

next previous
Data Analytics12 min read

Agile Performance Metrics: From Activity to Real Outcomes

Agile performance metrics track team progress, quality, and delivery. Discover the key KPIs, examples, and best practices to boost results.

Data Analytics13 min read

Cash Flow Forecasting Template: A Complete Guide

Cash flow forecasting template designed to help businesses monitor liquidity, plan expenses, and prepare for financial changes.

Data Analytics13 min read

Social Media Marketing Plan Template for SMM Success

A template for a social media marketing plan organizes goals and tracking. This blog shows you how to plan, analyze, and report smarter for better results.

Data Analytics12 min read

Cash Flow Analysis Template: A Complete Guide

A cash flow analysis template helps track inflows and outflows with clarity. Discover how Google Sheets and smart tools improve analysis and decision-making.

Data Analytics12 min read

Cap Table Template: Simplifying Equity Analysis

A cap table template tracks ownership and dilution. This blog shows how to create, analyze, and visualize cap tables in Google Sheets for better decisions.

ChartExpo logo

Turn Data into Visual
Stories

CHARTEXPO

  • Home
  • Gallery
  • Videos
  • Services
  • Pricing
  • Contact us
  • FAQs
  • Privacy policy
  • Terms of Service
  • Sitemap

TOOLS

  • ChartExpo for Google Sheets
  • ChartExpo for Microsoft Excel
  • Power BI Custom Visuals by ChartExpo
  • Word Cloud

CATEGORIES

  • Bar Charts
  • Circle Graphs
  • Column Charts
  • Combo Charts
  • Comparison Charts
  • Line Graphs
  • PPC Charts
  • Sentiment Analysis Charts
  • Survey Charts

TOP CHARTS

  • Sankey Diagram
  • Likert Scale Chart
  • Comparison Bar Chart
  • Pareto Chart
  • Funnel Chart
  • Gauge Chart
  • Radar Chart
  • Radial Bar Chart
  • Sunburst Chart
  • see more
  • Scatter Plot Chart
  • CSAT Survey Bar Chart
  • CSAT Survey Chart
  • Dot Plot Chart
  • Double Bar Graph
  • Matrix Chart
  • Multi Axis Line Chart
  • Overlapping Bar Chart
  • Control Chart
  • Slope Chart
  • Clustered Bar Chart
  • Clustered Column Chart
  • Box and Whisker Plot
  • Tornado Chart
  • Waterfall Chart
  • Word Cloud
  • see less

RESOURCES

  • Blog
  • Resources
  • YouTube
SIGN UP FOR UPDATES

We wouldn't dream of spamming you or selling your info.

© 2026 ChartExpo, all rights reserved.