• Home
  • Tools dropdown img
    • Spreadsheet Charts

      • ChartExpo for Google Sheets
      • ChartExpo for Microsoft Excel
    • Power BI Charts

      • Power BI Custom Visuals by ChartExpo
    • Word Cloud

  • Charts dropdown img
    • Chart Category

      • Bar Charts
      • Circle Graphs
      • Column Charts
      • Combo Charts
      • Comparison Charts
      • Line Graphs
      • PPC Charts
      • Sentiment Analysis Charts
      • Survey Charts
    • Chart Type

      • Box and Whisker Plot
      • Clustered Bar Chart
      • Clustered Column Chart
      • Comparison Bar Chart
      • Control Chart
      • CSAT Survey Bar Chart
      • CSAT Survey Chart
      • Dot Plot Chart
      • Double Bar Graph
      • Funnel Chart
      • Gauge Chart
      • Likert Scale Chart
      • Matrix Chart
      • Multi Axis Line Chart
      • Overlapping Bar Chart
      • Pareto Chart
      • Radar Chart
      • Radial Bar Chart
      • Sankey Diagram
      • Scatter Plot Chart
      • Slope Chart
      • Sunburst Chart
      • Tornado Chart
      • Waterfall Chart
      • Word Cloud
    • Google Sheets
      Microsoft Excel
  • Services
  • Pricing
  • Contact us
  • Blog
  • Support dropdown img
      • Gallery
      • Videos
      • Contact us
      • FAQs
      • Resources
    • Please feel free to contact us

      atsupport@chartexpo.com

Categories
All Data Visualizations Data Analytics Surveys
Add-ons/
  • Google Sheets
  • Microsoft Excel
  • Power BI
All Data Visualizations Data Analytics Surveys
Add-ons
  • Google Sheets
  • Microsoft Excel
  • Power BI

We use cookies

This website uses cookies to provide better user experience and user's session management.
By continuing visiting this website you consent the use of these cookies.

Ok

ChartExpo Survey


Home > Blog > Surveys

Education Survey Questions: From Survey to Visual Report

Bad feedback forms can waste an entire term. Education Survey Questions keep that from happening. No fluff, no guessing. People respond—every time. When the wording is tight, the answers are usable, not fuzzy.

Education Survey Questions

Students, families, and staff can point out friction that grades won’t show. Education Survey Questions also force choices to be backed by patterns, not hallway rumors. Done well, they turn real classroom moments into changes that stick, from pacing to program design.

Table of Contents:

  1. What is an Education Survey?
  2. Why Should You Use Education Survey Questions?
  3. When Should You Use Education Surveys?
  4. What Should Be Included in Education Survey Questions?
  5. Education Survey Question Examples
  6. How to Create an Education Survey Questionnaire in Power BI?
  7. How to Analyze Educational Surveys in Power BI?
  8. Education Survey Visualization: Selecting the Perfect Tool
  9. Benefits of Educational Survey Questions
  10. Tips for Creating Effective Education Survey Questions
  11. FAQs
  12. Wrap-up

What is an Education Survey?

Definition: Education Survey Questions are the prompts that collect feedback in schools. An education survey is a simple form that holds those prompts and checks teaching, learning, and operations. Done right, the results show what supports outcomes and what blocks them.

Students, parents, teachers, staff, and administrators can respond, depending on the goal. Digital tools keep the collection consistent and scalable. With clear wording and stable scales, results compare across grades and programs without extra cleanup. That saves time when reporting starts.

Why Should You Use Education Survey Questions?

Education Survey Questions help schools hear from stakeholders and act. A Google survey works when questions drive decisions, not vanity.

  • Students: Clearer classes and better support overall.
  • Parents: More visibility into learning and communication today.
  • Teachers: Feedback that improves instruction quickly.
  • Administrators: Planning backed by evidence now.
  • Institutions: Trust built through follow-through always.

Strong design also reduces survey bias, so responses reflect real experiences instead of leading wording. Education Survey Questions should stay neutral.

When Should You Use Education Surveys?

Timing matters. Educational surveys work best when people still remember what happened and still care enough to respond.

  • End of a course, term, or year works best overall.
  • After a new curriculum or method launches schoolwide.
  • During accreditation or compliance reviews.
  • When checking engagement and satisfaction.
  • To assess school climate and safety trends.
  • After workshops, training, or major initiatives end.

Good timing improves participation and the reliability of survey results.

What Should Be Included in Education Survey Questions?

Effective Education Survey Questions stay specific, stay plain, and cover the perspectives that matter for the decision at hand.

  • Student prompts on learning outcomes and engagement.
  • Parent prompts on communication and academic support.
  • Teacher prompts on classroom environment and resources.
  • Program evaluation prompts on structure, pacing, and relevance, too.
  • Optional demographic survey questions, like role or grade level, only.

Education Survey Question Examples

Examples keep answers consistent. Education Survey Questions should sound like real school moments, not policy talk, and stick to one idea.

Education Survey Questions

Student items often target instruction clarity, engagement, and expectations. Teacher items look at strategies, constraints, and support needs. School climate items cover safety and how well communication works when problems show up.

 Common question formats show up again and again:

  • Rating scale items for satisfaction measurement.
  • Multiple-choice items for structured responses.
  • Open-ended questionnaire items for detailed feedback, too.

How to Create an Education Survey Questionnaire in Power BI?

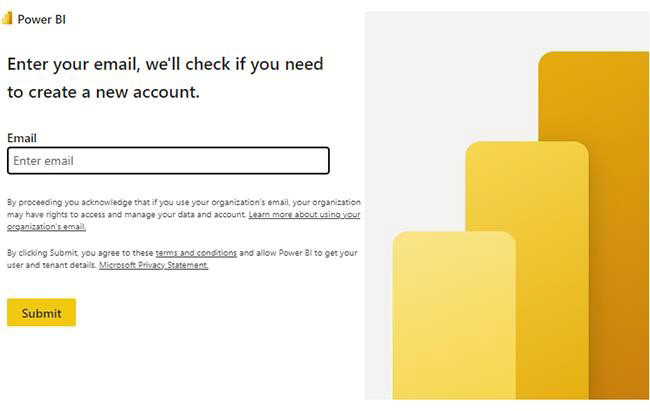
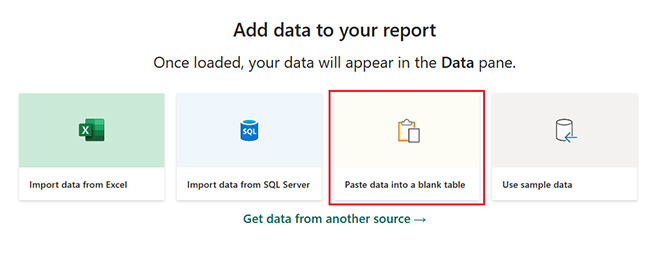
Power BI turns responses into dashboards, so manual tallying doesn’t drag on.

  1. Design your survey using Microsoft Survey tools.
  2. Publish the survey created with Google Forms for the survey and collect responses.
  3. Connect response data to Power BI.
  4. Clean and transform data using Power Query.
  5. Define metrics and relationships.
  6. Build dashboards to visualize insights.

With the data connected, reporting gets repeatable, and patterns start to show up fast.

How to Analyze Educational Surveys in Power BI?

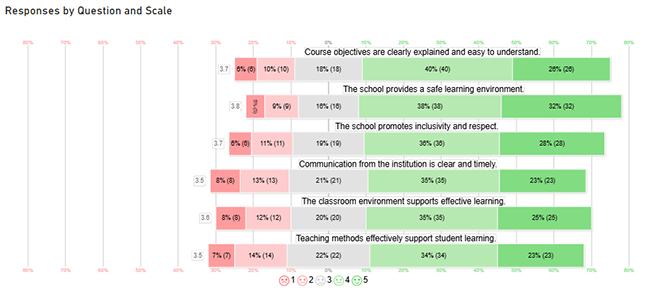
Education Survey Questions in Power BI turn raw responses into trends worth acting on.

  1. Import survey response data.
  2. Segment responses by role, grade, or department.
  3. Create calculated measures for averages and trends.
  4. Apply filters for comparisons across groups.
  5. Visualize insights using charts and tables.

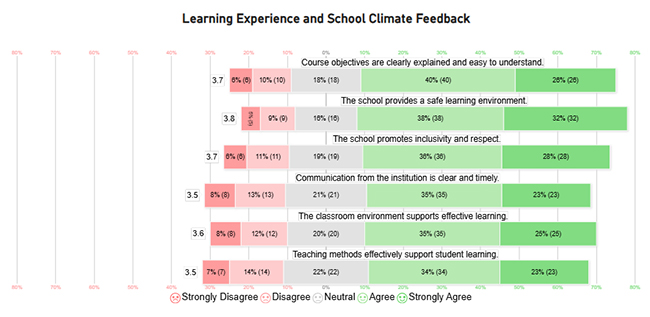
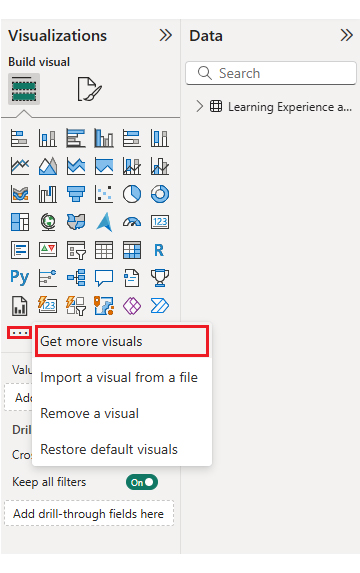
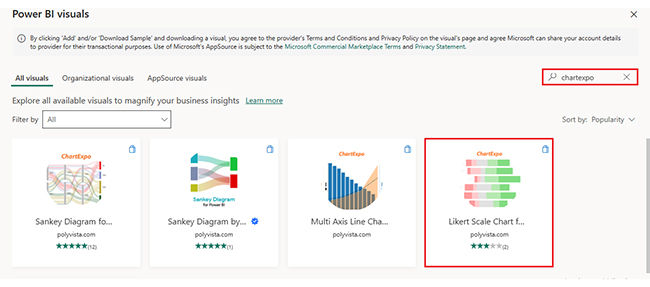
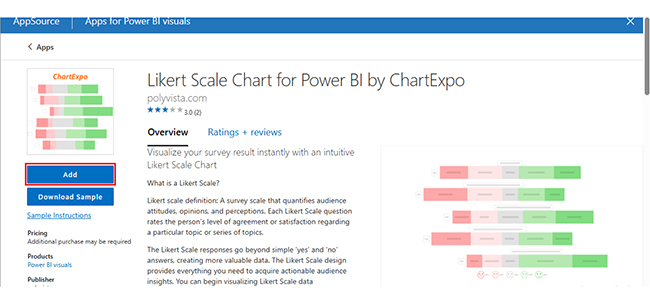
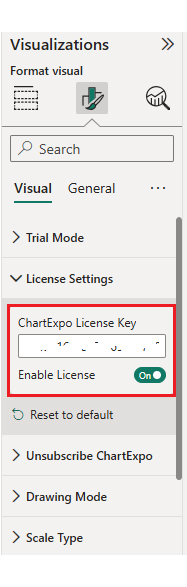
For better visuals, ChartExpo plugs into Power BI and adds survey-focused charts, including Likert Scale Charts for agreement data.

Why use ChartExpo?

  • ChartExpo speeds survey visualization with ready-made charts that show sentiment and agreement clearly.
  • It tracks CSAT survey responses across programs over time, cleanly too.
  • It supports trend reviews when results come from a longitudinal survey and are checked on a set schedule.
  • It offers a 7-day free trial and costs $10/month for added visuals today.

Example:

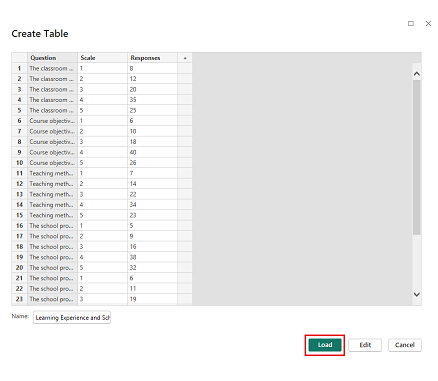
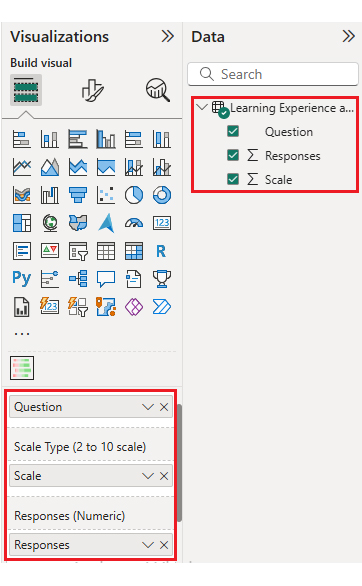
Assume the following table is available for building a Likert Chart.

Question

Scale

Responses

The classroom environment supports effective learning. 1 8
The classroom environment supports effective learning. 2 12
The classroom environment supports effective learning. 3 20
The classroom environment supports effective learning. 4 35
The classroom environment supports effective learning. 5 25
Course objectives are clearly explained and easy to understand. 1 6
Course objectives are clearly explained and easy to understand. 2 10
Course objectives are clearly explained and easy to understand. 3 18
Course objectives are clearly explained and easy to understand. 4 40
Course objectives are clearly explained and easy to understand. 5 26
Teaching methods effectively support student learning. 1 7
Teaching methods effectively support student learning. 2 14
Teaching methods effectively support student learning. 3 22
Teaching methods effectively support student learning. 4 34
Teaching methods effectively support student learning. 5 23
The school provides a safe learning environment. 1 5
The school provides a safe learning environment. 2 9
The school provides a safe learning environment. 3 16
The school provides a safe learning environment. 4 38
The school provides a safe learning environment. 5 32
Communication from the institution is clear and timely. 1 8
Communication from the institution is clear and timely. 2 13
Communication from the institution is clear and timely. 3 21
Communication from the institution is clear and timely. 4 35
Communication from the institution is clear and timely. 5 23
  • First, install Power BI, then log in to Power BI.
  • Enter your email. Click the “Submit” button.
Education Survey Questions
  • You are redirected to your Microsoft account.
  • Enter your password and click “Sign in”.
Education Survey Questions
  • Choose whether to stay signed in.
Education Survey Questions
  • First, you need to add data to your report and click on the “Paste data into a blank report”.
Education Survey Questions
  • Paste the data table above into a blank table, name it, and click on the “Load” button.


Education Survey Questions
  • To build a Likert Chart, import the visual from App Source by opening the Visualizations panel in Power BI.
  • Select “Get more Visuals”.
Education Survey Questions
  • Search ChartExpo and select the Likert
Education Survey Questions
  • Click on the “Add” button.
Education Survey Questions
  • After that, you can select the “Likert Chart” icon in the visualization panel.
Education Survey Questions
  • To add a Likert Chart visual, click on the chart icon and choose the dimension and measures.
Education Survey Questions
  • In Visualization’s properties, click on License Settings and add the key so that you’ll see the Likert Chart without a watermark.
Education Survey Questions
  • Now, after applying the key, the watermark is removed from the chart, and the chart is shown below.
Education Survey Questions
  • Next, modify the chart’s title so it matches the story the data is telling.
Education Survey Questions
  • You can change the legend text as well.
Education Survey Questions
  • The final look of the Likert Chart is shown below.
Education Survey Questions

Key Insights

  • Course clarity and school safety score the most agreement, so those areas look stable for now.
  • Teaching methods and institutional communication sit nearer neutral, which points to follow-up work.
  • Overall disagreement stays low, which fits a generally satisfied learning environment.

Education Survey Visualization: Selecting the Perfect Tool

Aspects Likert Chart in Power BI  ChartExpo
Visualization focus General BI visuals Survey-focused visuals
Survey analysis Manual setup for complex surveys Simplified survey visualization
Likert scale support Limited native support Built-in Likert charts
Customization High, technical High, easy to configure
Interpretation Standard metrics Faster survey insights

Benefits of Educational Survey Questions

Educational surveys provide structured feedback for steady academic improvement today, and Education Survey Questions keep that feedback usable.

  • Stronger student learning outcomes.
  • Better parent-institution communication overall.
  • More effective instruction.
  • Smarter administrative decisions.
  • Greater transparency and accountability.

They work across different types of surveys used for academic assessment and feedback collection. These insights are especially useful when reviewing outcomes gathered through exit survey questions during program evaluation later.

Tips for Creating Effective Education Survey Questions

Well-designed Education Survey Questions improve response quality, reduce noise, and keep analysis honest.

  • Keep items clear and concise.
  • Use both numeric and open formats.
  • Avoid leading or biased wording.
  • Ensure accessibility for all.
  • Pilot test before full rollout.

Education Survey Questions should mix closed-ended questions and a few open-ended prompts, so numbers still have context.

FAQs

Who should participate in an education survey?

Students, parents, teachers, administrators, and support staff should be included so feedback reflects the full experience, not just one viewpoint.

How often should an education survey be conducted?

Most schools run it at the end of a term or year, then add a shorter check after major changes so issues don’t linger for months.

What are good educational questions to ask?

Strong items cover clarity, engagement, communication, resources, and overall satisfaction, with wording that’s easy to answer quickly.

Wrap-up

Education Survey Questions turn feedback into decisions that hold up. Power BI helps spot patterns and track changes, and ChartExpo makes Likert results readable fast. A clean education survey, built with care, keeps teams focused on fixes that matter, not noise. That’s how improvements stop being random.

How much did you enjoy this article?

PBIAd1
Start Free Trial!
158918

Related articles

next previous
Surveys11 min read

Likert Satisfaction Scale for Structured Response Analysis

Discover what a Likert Satisfaction Scale is, its structure, and why it’s used in customer and employee feedback surveys.

Surveys12 min read

Candidate Experience Survey Template: Insights Made Easy

A candidate experience survey template collects hiring feedback. Click here to learn when to send it, what to ask, and how to analyze the results.

Surveys12 min read

Voice of Customer Examples for Business Insights

Discover real-world Voice of Customer examples that show how businesses collect feedback, improve experiences, and build stronger customer relationships.

Surveys14 min read

Google Forms Survey Template Exploration: Key Features

Google Forms survey templates make it easy to design surveys fast. Discover their benefits, examples, and how to personalize them for your needs.

Surveys12 min read

Top Market Analysis Templates: Unlocking Potential

Discover a ready-to-use Market Analysis Template to evaluate industry trends, customers, and competitors. Perfect for business planning and strategy.

ChartExpo logo

Turn Data into Visual
Stories

CHARTEXPO

  • Home
  • Gallery
  • Videos
  • Services
  • Pricing
  • Contact us
  • FAQs
  • Privacy policy
  • Terms of Service
  • Sitemap

TOOLS

  • ChartExpo for Google Sheets
  • ChartExpo for Microsoft Excel
  • Power BI Custom Visuals by ChartExpo
  • Word Cloud

CATEGORIES

  • Bar Charts
  • Circle Graphs
  • Column Charts
  • Combo Charts
  • Comparison Charts
  • Line Graphs
  • PPC Charts
  • Sentiment Analysis Charts
  • Survey Charts

TOP CHARTS

  • Sankey Diagram
  • Likert Scale Chart
  • Comparison Bar Chart
  • Pareto Chart
  • Funnel Chart
  • Gauge Chart
  • Radar Chart
  • Radial Bar Chart
  • Sunburst Chart
  • see more
  • Scatter Plot Chart
  • CSAT Survey Bar Chart
  • CSAT Survey Chart
  • Dot Plot Chart
  • Double Bar Graph
  • Matrix Chart
  • Multi Axis Line Chart
  • Overlapping Bar Chart
  • Control Chart
  • Slope Chart
  • Clustered Bar Chart
  • Clustered Column Chart
  • Box and Whisker Plot
  • Tornado Chart
  • Waterfall Chart
  • Word Cloud
  • see less

RESOURCES

  • Blog
  • Resources
  • YouTube
SIGN UP FOR UPDATES

We wouldn't dream of spamming you or selling your info.

© 2026 ChartExpo, all rights reserved.