• Home
  • Tools dropdown img
    • Spreadsheet Charts

      • ChartExpo for Google Sheets
      • ChartExpo for Microsoft Excel
    • Power BI Charts

      • Power BI Custom Visuals by ChartExpo
    • Word Cloud

  • Charts dropdown img
    • Chart Category

      • Bar Charts
      • Circle Graphs
      • Column Charts
      • Combo Charts
      • Comparison Charts
      • Line Graphs
      • PPC Charts
      • Sentiment Analysis Charts
      • Survey Charts
    • Chart Type

      • Box and Whisker Plot
      • Clustered Bar Chart
      • Clustered Column Chart
      • Comparison Bar Chart
      • Control Chart
      • CSAT Survey Bar Chart
      • CSAT Survey Chart
      • Dot Plot Chart
      • Double Bar Graph
      • Funnel Chart
      • Gauge Chart
      • Likert Scale Chart
      • Matrix Chart
      • Multi Axis Line Chart
      • Overlapping Bar Chart
      • Pareto Chart
      • Radar Chart
      • Radial Bar Chart
      • Sankey Diagram
      • Scatter Plot Chart
      • Slope Chart
      • Sunburst Chart
      • Tornado Chart
      • Waterfall Chart
      • Word Cloud
    • Google Sheets
      Microsoft Excel
  • Services
  • Pricing
  • Contact us
  • Blog
  • Support dropdown img
      • Gallery
      • Videos
      • Contact us
      • FAQs
      • Resources
    • Please feel free to contact us

      atsupport@chartexpo.com

Categories
All Data Visualizations Data Analytics Surveys
Add-ons/
  • Google Sheets
  • Microsoft Excel
  • Power BI
All Data Visualizations Data Analytics Surveys
Add-ons
  • Google Sheets
  • Microsoft Excel
  • Power BI

We use cookies

This website uses cookies to provide better user experience and user's session management.
By continuing visiting this website you consent the use of these cookies.

Ok

ChartExpo Survey


Home > Blog > Data Analytics

What is ROI in Business: ROI Insights Made Simple

You can’t manage what you can’t measure. That’s why understanding ROI in Business matters so much when you’re trying to figure out if your investments actually pay off.

What is ROI in Business

It’s the difference between throwing money at problems and making strategic bets that drive real growth.

From scrappy startups weighing their first hires to Fortune 500 companies optimizing billion-dollar projects, ROI in Business serves as the universal scorecard.

It keeps teams honest, budgets tight, and strategies grounded in what actually works.

Table of Contents:

  1. What is ROI in Business?
  2. Why is ROI in Business Important?
  3. What is the ROI Formula in Business?
  4. How to Calculate ROI in Business?
  5. Top 5 ROI in Business Examples
  6. How to Analyze Business ROI in Google Sheets?
  7. Key Benefits of ROI in Business
  8. Best Practices of ROI in Business
  9. Limitations of ROI in Business
  10. FAQs
  11. Wrap-up

What is ROI in Business?

Definition: ROI in Business is a financial metric that measures how much profit you’re generating relative to what you’re spending. Think of it as your investment’s report card.

In practical terms, ROI in Business shows the percentage return a company earns when it deploys resources into a project, campaign, or asset. This metric lets organizations stack different initiatives against each other without getting lost in the weeds.

Whether you’re evaluating marketing spend, tech infrastructure upgrades, or process improvements, business return on investment cuts through the noise and delivers a clean snapshot of value creation and financial efficiency.

Why is ROI in Business Important?

It’s what separates guesswork from data-backed decision-making. ROI gives organizations the ability to translate messy performance into clean, measurable outcomes that actually align with profitability goals. Here’s why it matters:

  • Enables informed decisions through ROI analysis.
  • Supports smarter allocation of capital and resources.
  • Measures performance across projects and departments.
  • Strengthens credibility when presenting returns to stakeholders.
  • Improves oversight of budgets and spending efficiency.
  • Reinforces accountability across teams and leadership.

What is the ROI Formula in Business?

The standard ROI formula is:

ROI (%) = (Net Profit ÷ Investment Cost) × 100

Net profit represents the total financial gain after you’ve subtracted all associated expenses from revenue.

Investment cost includes every single expense required to execute the initiative, from operational costs to supporting resources. Don’t skip the small stuff. Those hidden costs add up.

How to Calculate ROI in Business?

Calculating ROI demands structured data and disciplined evaluation. When you apply it correctly, it reveals the true business return on investment for any initiative. Here’s the breakdown:

  • Identify the total investment cost using accurate financial records.
  • Calculate net profit after subtracting all expenses.
  • Apply the standard ROI formula.
  • Convert the result into a percentage.
  • Interpret positive ROI as value creation and negative ROI as loss.
  • Validate figures to ensure accuracy and consistency.

Understanding how to calculate return on investment capital ensures your ROI reflects genuine financial outcomes rather than wishful thinking.

Top 5 ROI in Business Examples

To better understand ROI in Business, consider a marketing campaign example. A company invests $10,000 in a digital campaign and generates $15,000 in revenue. After deducting the initial cost, the net profit is $5,000.

Using the formula:

ROI = ($5,000 ÷ $10,000) × 100 = 50%

This result shows a positive ROI, indicating the campaign delivered measurable value. Visualizing such outcomes using financial charts can enhance interpretation and communication even further.

Example # 1:

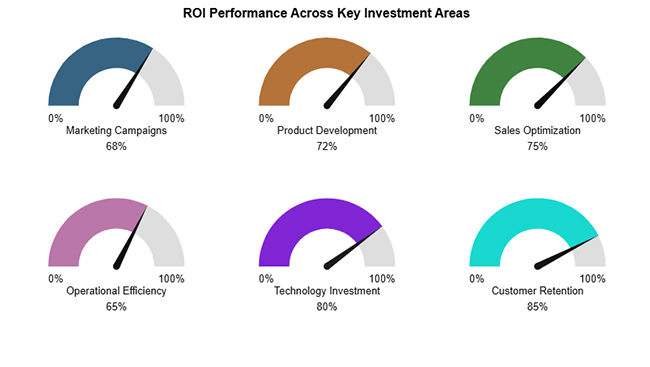
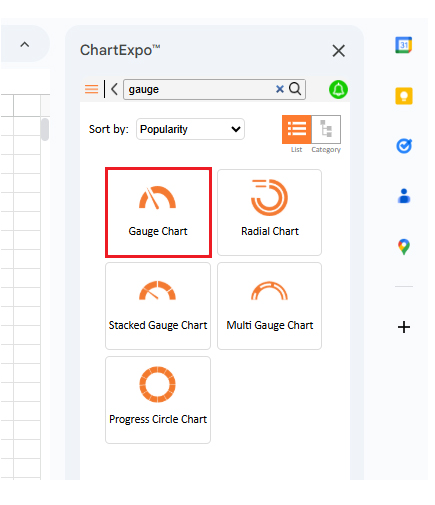
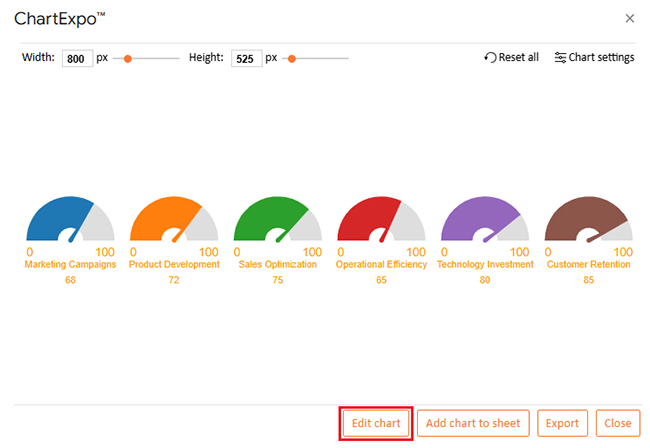
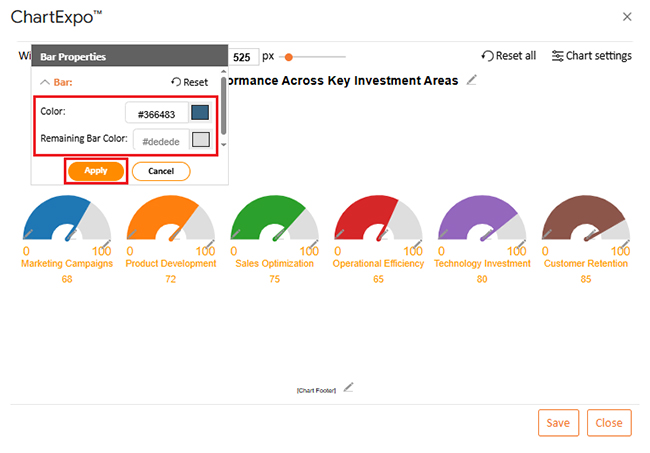
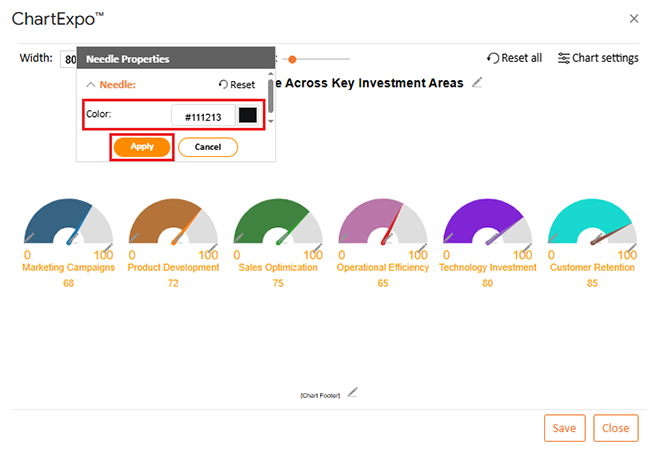
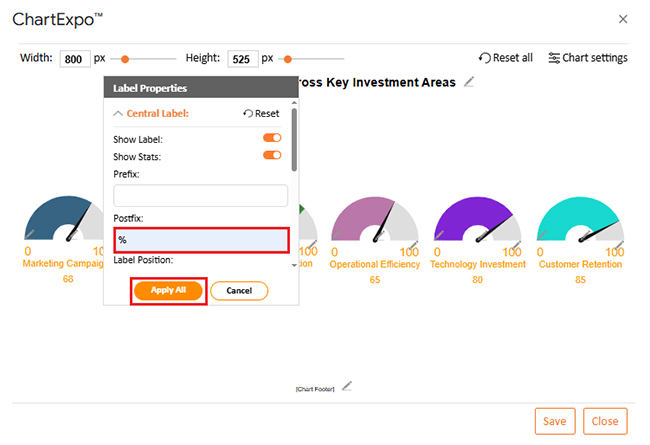
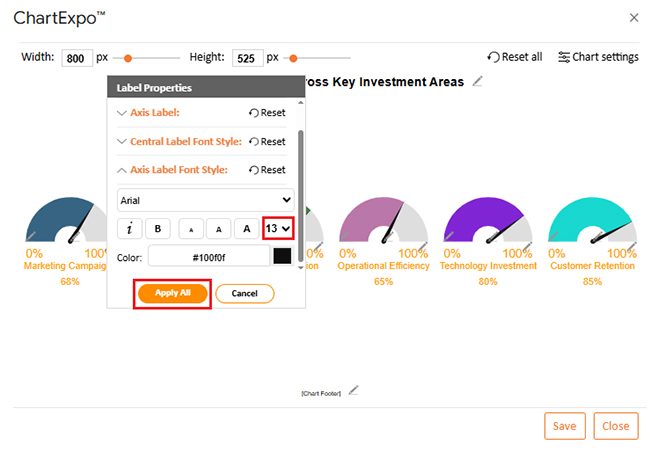
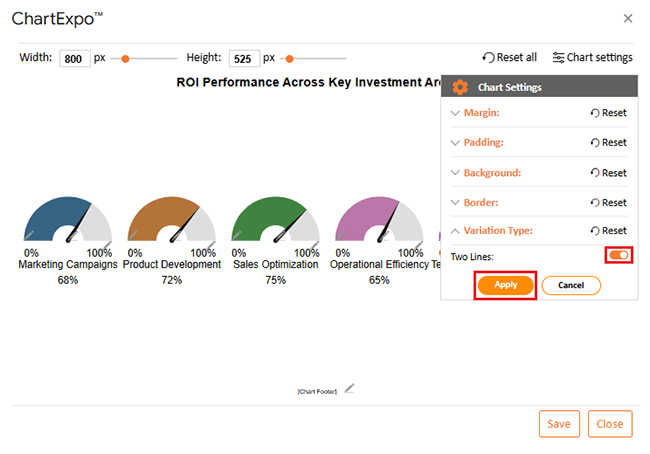
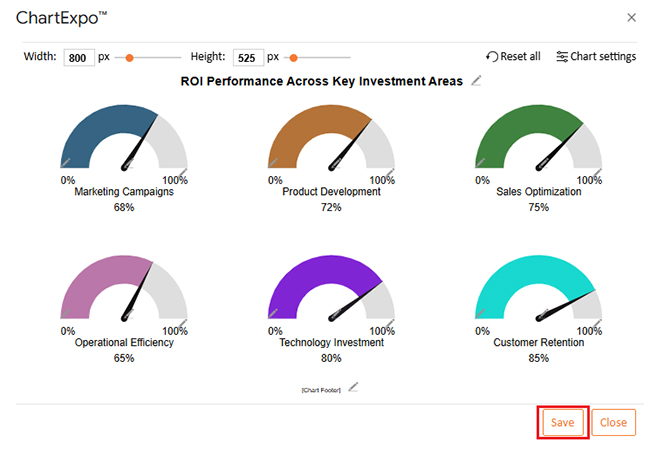
The Gauge Chart highlights how key investment areas are progressing toward their ideal ROI targets, clearly showing strengths and improvement opportunities.

What is ROI in Business

Example # 2:

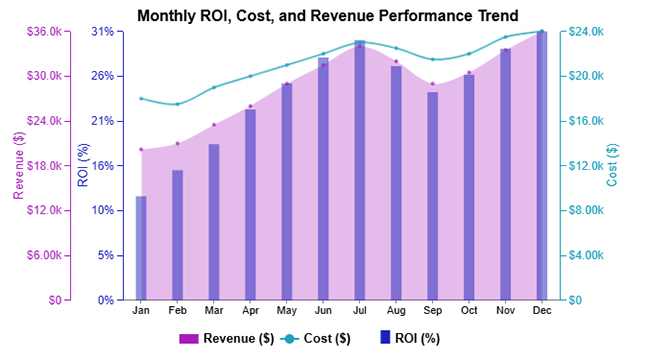
The Multi Axis Line Chart illustrates how revenue, costs, and ROI move together over time to reflect overall performance trends.

What is ROI in Business

Example # 3:

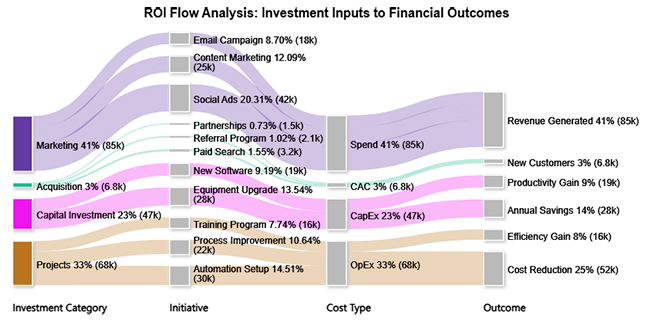
The Sankey chart shows how business investments flow across different expense categories, clarifying resource allocation and ROI impact.

What is ROI in Business

Example # 4:

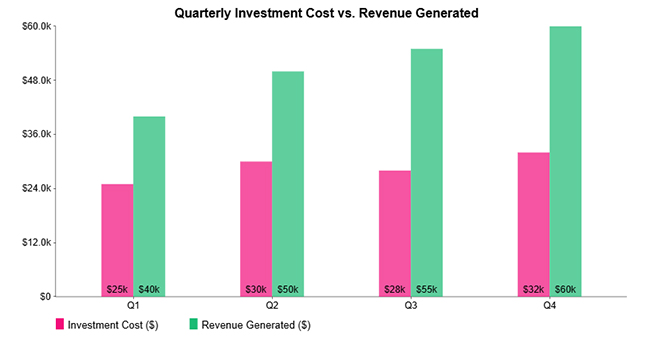
The Clustered Column Chart compares quarterly investment costs with generated revenue to highlight ROI performance trends.

What is ROI in Business

Example # 5:

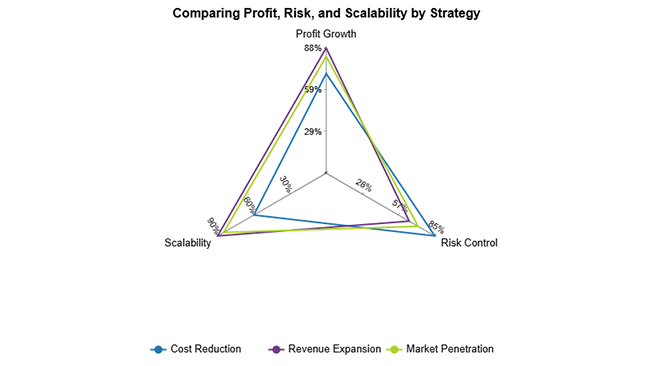
The Multi Axis Spider Chart compares investment strategies across profit growth, risk control, and scalability to support ROI-focused evaluation.

What is ROI in Business

How to Analyze Business ROI in Google Sheets?

Analyzing ROI in Business in spreadsheets gives you clarity, flexibility, and transparency when handling financial data. It’s where the numbers stop hiding and start telling stories. Here’s how to set it up right:

  1. Create structured columns for costs, revenues, and net profit.
  2. Use formulas to automate ROI calculations.
  3. Segment data by project or timeline for deeper insights.
  4. Validate inputs using a reliable business expenses spreadsheet.
  5. Enhance interpretation through visuals powered by ChartExpo.

ChartExpo transforms static spreadsheet data into meaningful visual narratives. By turning ROI figures into dynamic visuals, it bridges the gap between numbers and business insights, helping stakeholders quickly understand performance trends. This approach supports better business analytics without drowning you in complexity.

Why use ChartExpo?

  • Turns complex spreadsheet data into clear, easy-to-read visuals.
  • Reduces time spent creating charts while improving clarity and accuracy.
  • Offers a 7-day free trial and costs just $10/month for enhanced visualization.

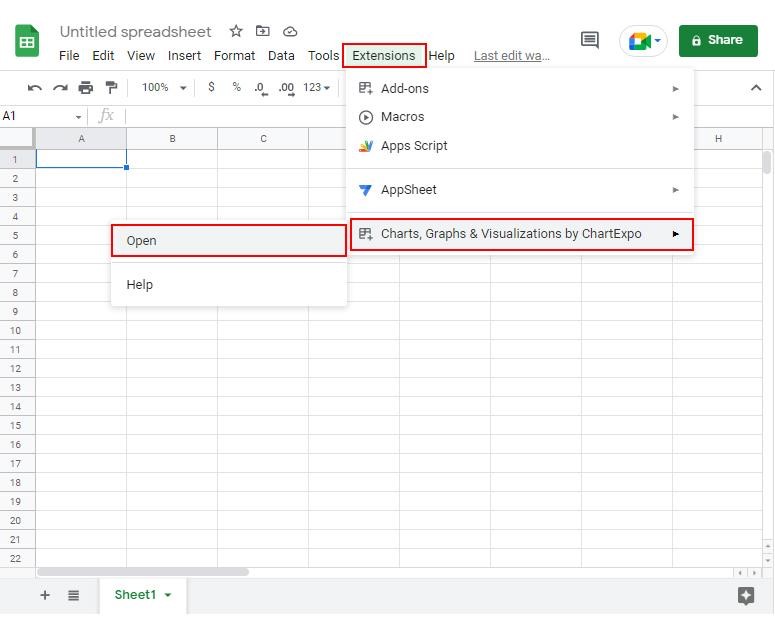
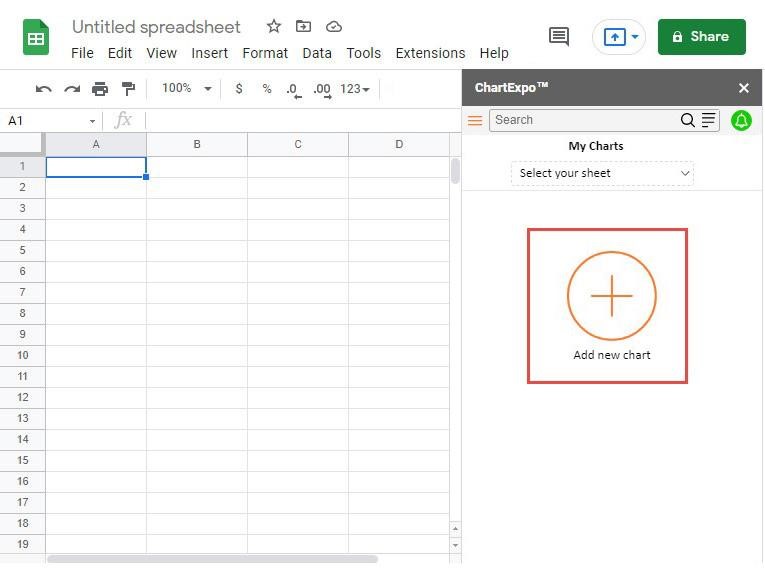
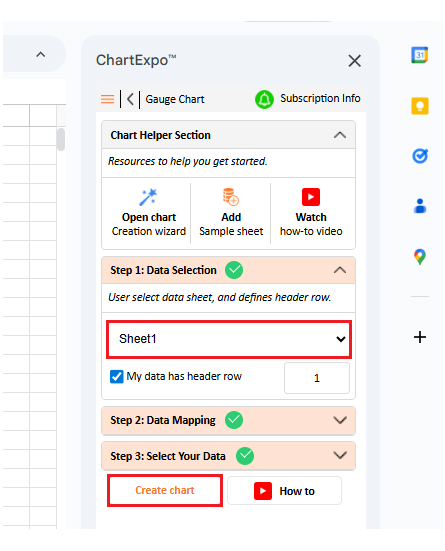
How to install ChartExpo in Google Sheets?

  • Go to Google Sheets and open the file you are interested in. Then click on the Extensions tab in the upper menu.
  • Click on the Add-ons and enter “Get add-ons.”
  • Go to the Google Workspace Marketplace and search for ChartExpo.
  • Explore “Charts, Graphs & Visualizations by ChartExpo, and click the “Install” button.
  • Allow the necessary access and confirm your Google account when asked.

Example:

Consider we have the following data for the Gauge Chart.

Investment Area Actual ROI (%) Target ROI (%)
Marketing Campaigns 68 100
Product Development 72 100
Sales Optimization 75 100
Operational Efficiency 65 100
Technology Investment 80 100
Customer Retention 85 100
  • To get started with ChartExpo, install ChartExpo in Google Sheets.
  • Go to Extensions > Charts, Graphs & Visualizations by ChartExpo > Open.
What is ROI in Business
  • Once ChartExpo is installed in Google Sheets, click on the “Add new chart” button.
What is ROI in Business
  • Once it loads, scroll through the charts list to locate and choose the “Gauge Chart”.
What is ROI in Business
  • Then, select your worksheet and confirm the data range; your data is automatically mapped, and click on the Create button.
What is ROI in Business
  • If you want to customize your chart, select the ‘Edit Chart’ option and design it to your specifications.
What is ROI in Business
  • To change the chart’s title, select the pencil icon on the header. Then, enter the text you want and select “Apply”.
What is ROI in Business
  • You can change the bar color from “Bar Properties” as well.
What is ROI in Business
  • Now, set the needle color to black by clicking the pencil icon on the needle.
What is ROI in Business
  • You can add a percentage sign on the central label and axis label from “Label Properties” as well.
What is ROI in Business
  • You can change font size and color for better readability as well.
What is ROI in Business
  • You can change the variation type from “Chart Settings” to make the chart look more presentable.
What is ROI in Business
  • When you are done with all the changes, click the “Save” button to save them.
What is ROI in Business
  • The final Gauge Chart is shown below.
What is ROI in Business

Key Insights

  • Customer Retention and Technology Investment lead in ROI performance.
  • Operational Efficiency and Marketing Campaigns show the most improvement potential.
  • All areas perform positively but remain below the ideal target.

Key Benefits of ROI in Business

It offers organizations a structured way to evaluate success and improve strategic alignment across operations. It’s not just about tracking numbers. It’s about making those numbers work for you:

  • Drives effective strategic resource allocation.
  • Enables performance benchmarking across initiatives.
  • Encourages data-driven decision-making.
  • Helps mitigate financial and operational risks.
  • Enhances appeal to investors and funding partners.
  • Supports operational efficiency improvements.
  • Strengthens goal alignment and accountability.

When combined with analytics tools for business, ROI becomes a powerful driver of informed growth.

Best Practices of ROI in Business

Applying ROI in Business effectively requires consistency and context. Following best practices ensures accurate interpretation and meaningful comparisons:

  • Use consistent calculation methods across projects.
  • Include all direct and indirect costs.
  • Compare ROI across similar initiatives.
  • Pair ROI with complementary financial metrics.
  • Review ROI regularly rather than one-time evaluations.
  • Align ROI goals with long-term strategy.

Limitations of ROI in Business

Despite its value, ROI in Business has limitations that decision-makers must understand to avoid misinterpretation. No single metric tells the whole story:

  • Ignores the time factor of returns.
  • Does not account for risk variability.
  • Excludes qualitative benefits like brand value.
  • It can be manipulated by selective cost inclusion.
  • Neglects the time value of money (TVM).
  • Omits opportunity costs of alternative investments.
  • Overlooks cash flow timing issues.

To address these gaps, ROI in Business should be reviewed alongside return on assets vs. return on equity for a more complete financial view. Long-term accuracy can be further improved through financial forecasting for startups and established businesses.

FAQs

What is a good ROI for a business?

A good ROI for Business depends on industry standards, risk tolerance, and investment type. Generally, a positive ROI exceeding capital costs is considered favorable. Different sectors have different benchmarks, so context matters.

How does ROI in Business differ across industries?

Industries vary in margins, capital intensity, and growth cycles. As a result, acceptable business return on investment levels differ significantly between sectors like technology, manufacturing, and services. What’s strong in one industry might be weak in another.

How often should ROI in Business be measured?

ROI in Business should be measured regularly, monthly, quarterly, or annually, depending on project duration and strategic importance. More frequent measurement helps you catch problems early and capitalize on wins.

Wrap-up

Understanding ROI in Business enables smarter investment decisions, clearer performance evaluation, and sustainable growth.

When paired with structured analysis and visualization tools like ChartExpo, businesses can transform numbers into insights that support confident, data-driven strategies across projects, teams, and long-term objectives.

It’s the metric that keeps you honest about what’s working and what isn’t.

How much did you enjoy this article?

PBIAd1
Start Free Trial!
158699

Related articles

next previous
Data Analytics9 min read

Healthcare Datasets: Step-by-Step Guide for Insights

Learn what datasets for healthcare are, why they matter, real-world examples, and how to analyze medical data effectively with Power BI and advanced visuals.

Data Analytics7 min read

Customer Retention Metrics: Key KPIs Explained Visually

Customer Retention Metrics help track churn, loyalty, engagement, and revenue trends so teams can spot risks early and improve long-term customer value.

Data Analytics8 min read

Cost Breakdown Template for Better Budget Visibility

Understand how a cost breakdown template improves budget clarity, controls spending, and supports smarter planning with Excel examples and visuals.

Data Analytics12 min read

Agile Performance Metrics: From Activity to Real Outcomes

Agile performance metrics track team progress, quality, and delivery. Discover the key KPIs, examples, and best practices to boost results.

Data Analytics13 min read

Cash Flow Forecasting Template: A Complete Guide

Cash flow forecasting template designed to help businesses monitor liquidity, plan expenses, and prepare for financial changes.

ChartExpo logo

Turn Data into Visual
Stories

CHARTEXPO

  • Home
  • Gallery
  • Videos
  • Services
  • Pricing
  • Contact us
  • FAQs
  • Privacy policy
  • Terms of Service
  • Sitemap

TOOLS

  • ChartExpo for Google Sheets
  • ChartExpo for Microsoft Excel
  • Power BI Custom Visuals by ChartExpo
  • Word Cloud

CATEGORIES

  • Bar Charts
  • Circle Graphs
  • Column Charts
  • Combo Charts
  • Comparison Charts
  • Line Graphs
  • PPC Charts
  • Sentiment Analysis Charts
  • Survey Charts

TOP CHARTS

  • Sankey Diagram
  • Likert Scale Chart
  • Comparison Bar Chart
  • Pareto Chart
  • Funnel Chart
  • Gauge Chart
  • Radar Chart
  • Radial Bar Chart
  • Sunburst Chart
  • see more
  • Scatter Plot Chart
  • CSAT Survey Bar Chart
  • CSAT Survey Chart
  • Dot Plot Chart
  • Double Bar Graph
  • Matrix Chart
  • Multi Axis Line Chart
  • Overlapping Bar Chart
  • Control Chart
  • Slope Chart
  • Clustered Bar Chart
  • Clustered Column Chart
  • Box and Whisker Plot
  • Tornado Chart
  • Waterfall Chart
  • Word Cloud
  • see less

RESOURCES

  • Blog
  • Resources
  • YouTube
SIGN UP FOR UPDATES

We wouldn't dream of spamming you or selling your info.

© 2026 ChartExpo, all rights reserved.