• Home
  • Tools dropdown img
    • Spreadsheet Charts

      • ChartExpo for Google Sheets
      • ChartExpo for Microsoft Excel
    • Power BI Charts

      • Power BI Custom Visuals by ChartExpo
    • Word Cloud

  • Charts dropdown img
    • Chart Category

      • Bar Charts
      • Circle Graphs
      • Column Charts
      • Combo Charts
      • Comparison Charts
      • Line Graphs
      • PPC Charts
      • Sentiment Analysis Charts
      • Survey Charts
    • Chart Type

      • Box and Whisker Plot
      • Clustered Bar Chart
      • Clustered Column Chart
      • Comparison Bar Chart
      • Control Chart
      • CSAT Survey Bar Chart
      • CSAT Survey Chart
      • Dot Plot Chart
      • Double Bar Graph
      • Funnel Chart
      • Gauge Chart
      • Likert Scale Chart
      • Matrix Chart
      • Multi Axis Line Chart
      • Overlapping Bar Chart
      • Pareto Chart
      • Radar Chart
      • Radial Bar Chart
      • Sankey Diagram
      • Scatter Plot Chart
      • Slope Chart
      • Sunburst Chart
      • Tornado Chart
      • Waterfall Chart
      • Word Cloud
    • Google Sheets
      Microsoft Excel
  • Services
  • Pricing
  • Contact us
  • Blog
  • Support dropdown img
      • Gallery
      • Videos
      • Contact us
      • FAQs
      • Resources
    • Please feel free to contact us

      atsupport@chartexpo.com

Categories
All Data Visualizations Data Analytics Surveys
Add-ons/
  • Google Sheets
  • Microsoft Excel
  • Power BI
All Data Visualizations Data Analytics Surveys
Add-ons
  • Google Sheets
  • Microsoft Excel
  • Power BI

We use cookies

This website uses cookies to provide better user experience and user's session management.
By continuing visiting this website you consent the use of these cookies.

Ok

ChartExpo Survey


Home > Blog > Google Sheets

Business Expenses Spreadsheet: Improving Insights

What is a spreadsheet for business expenses? It’s the tool every business owner should use—but many still don’t. A spreadsheet for business expenses keeps spending visible.

Business Expenses Spreadsheet

Why does this matter? Because smart tracking leads to intelligent business insights. You start to see where the leaks are and learn which expenses are worth it and which aren’t. You spot patterns, cut waste, and grow margins. It’s not about doing more. It’s about spending smarter.

And when decisions are based on facts, not feelings, planning becomes sharper. That’s where business forecasting gains power. You look ahead using data from today, predict better, budget better, and stress less.

This isn’t optional. It’s survival. Whether you’re running a bakery, a tech startup, or a solo consulting gig, how you track expenses matters. You can’t rely on memory or scattered receipts in a shoebox. You need clarity. You need a spreadsheet for business expenses that gives you control. And once you see how much you’re spending—and where—it changes how you run your business.

It’s time to take expenses seriously. Every dollar has a story, and this spreadsheet helps you hear it.

Let’s dive into it…

Table of Contents:

  1. What is a Business Expenses Spreadsheet?
  2. Why Use a Business Expenditure Spreadsheet?
  3. Key Features of a Business Expense Spreadsheet
  4. How to Create a Business Expense in Google Sheets?
  5. How to Analyze Business Expenses in Google Sheets?
  6. Limitations of a Business Expenditure Spreadsheet
  7. FAQs
  8. Wrap Up

What is a Business Expenses Spreadsheet?

Definition: A business expenses spreadsheet is a simple tool for recording, categorizing, and monitoring spending. It helps track daily, weekly, or monthly costs, including fixed, variable, and one-time expenses. A clear spreadsheet supports accurate business analytics.

This tool also improves decision-making. You can see where the money goes and where to cut back. It’s essential for creating a profit and loss statement for a small business. With better tracking, you reduce waste and gain financial control. Every small business should use one.

Top 5 Charts to Show Business Expenses

Sankey Chart:

Business Expenses Spreadsheet

Clustered Stacked Bar Chart:

Business Expenses Spreadsheet

Stacked Waterfall Chart:

Business Expenses Spreadsheet

Horizontal Waterfall Chart:

Business Expenses Spreadsheet

Multi Axis Line Chart:

Business Expenses Spreadsheet

Why Use a Business Expenditure Spreadsheet?

Managing business expenses can feel like juggling too many balls at once. Without a clear method, significant costs can slip through the cracks.

Here’s why a small business expense report spreadsheet is a game-changer.

  • Clear expense tracking: A spreadsheet shows every expense in one place. This helps you spot patterns and avoid missing payments.
  • Better budget management: Accurate tracking allows you to create realistic budgets, which prevent overspending and keep your cash flow healthy.
  • Simplified tax preparation: Organized expenses make tax filing faster and less stressful. You won’t scramble to find receipts or details.
  • Improved financial decision-making: When you understand where money goes, you make smarter choices. This helps cut unnecessary costs and boost profits.
  • Easy customization and analysis: You can tailor the spreadsheet to your business needs. This flexibility makes reviewing expenses straightforward.
  • Supports small and growing businesses: A clear expense report builds financial discipline. It gives you control as your business expands and faces new challenges.

Key Features of a Business Expense Spreadsheet

A solid spreadsheet for business expenses does more than list numbers. It helps you understand spending with useful features that save time and reduce errors.

Here are the key parts to look for in a great expense spreadsheet.

  • Expense categories: Organizing expenses into groups makes it easier to track costs. This helps in business analytics by showing where most money is spent.
  • Date and vendor details: Recording when and where you paid adds clarity. It helps verify transactions and spot trends over time.
  • Amount and payment method: Knowing how much was paid and how to ensure accurate records helps avoid duplicate payments or missed bills.
  • Recurring vs. one-time expenses: Separating regular payments from one-offs simplifies forecasting. This is crucial for business forecasting and planning.
  • Comments or notes section: Adding details explains unusual expenses or special cases. It keeps the data clear for future review.
  • Built-in formulas and totals: Automatic calculations save time and reduce errors. They show totals instantly, making it easier to spot overspending.
  • Visual charts and graphs: Graphs turn numbers into clear pictures. They help you see patterns fast and communicate insights with ease.

How to Create a Business Expense in Google Sheets?

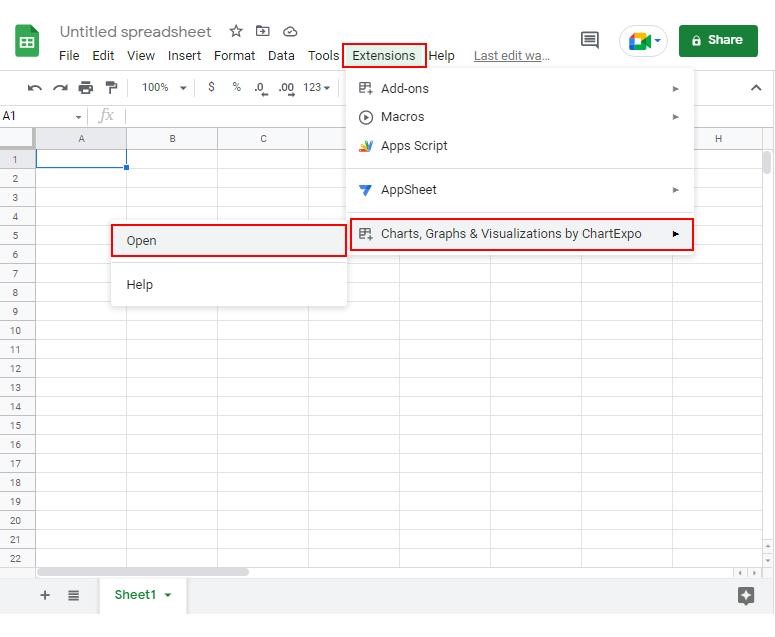
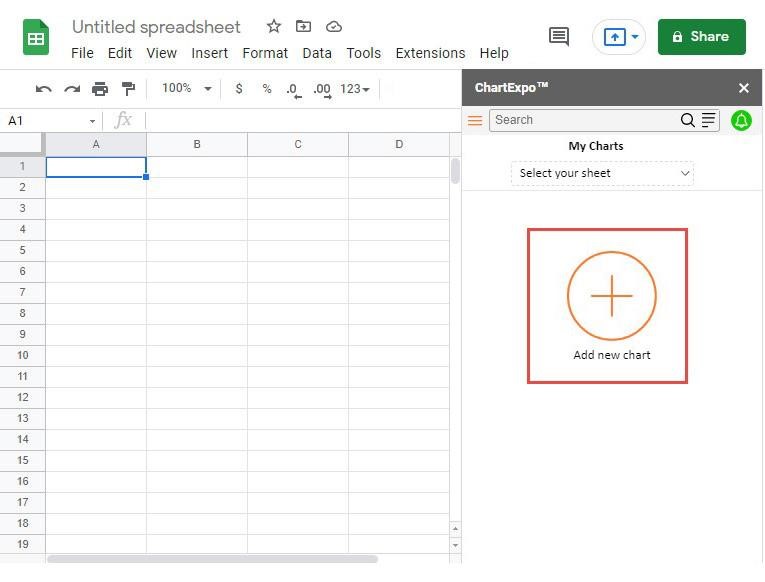
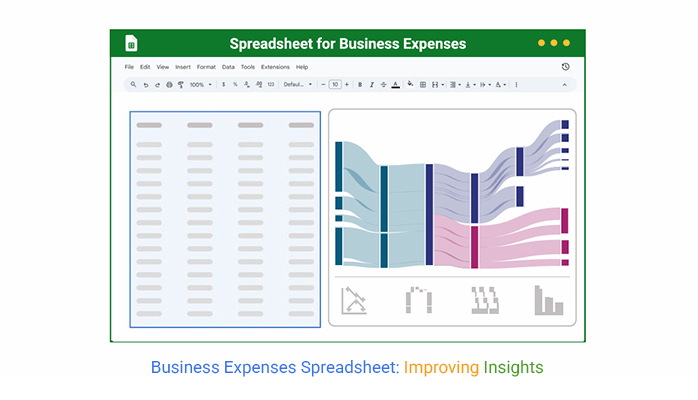
Getting started with a spreadsheet for business expenses in Google Sheets is easier than you think. You don’t need to be a tech expert. Follow these simple steps to build a tool that keeps your finances clear and organized.

  1. Open a new spreadsheet: Log in to Google Sheets and create a blank file. This is your workspace to track every cost.
  2. Set up column headings: Label columns for Date, Vendor, Amount, Payment Method, and Category. Clear headings keep data organized and easy to enter.
  3. Categorize your expenses: Group costs like rent, supplies, and utilities. Categories help with business analytics and show where money flows.
  4. Use formulas: Add simple formulas to total expenses automatically. This saves time and ensures accuracy.
  5. Add charts: Create charts to visualize spending trends. Visual data helps with business forecasting and spotting budget issues early.
  6. Share and collaborate: Give access to your accountant or team members. Collaboration keeps everyone on the same page and improves decision-making.

How to Analyze Business Expenses in Google Sheets?

What is a business expenses spreadsheet? It’s where your money stories get told. But raw numbers can be boring—and hard to understand. But don’t worry; data visualization turns those numbers into clear pictures.

Google Sheets does the job, but falls short with fancy charts and easy insights. That’s where ChartExpo steps in. It makes your data pop and helps you see the full picture—fast and simple. No more guessing—just smart visuals that work.

How to Install ChartExpo in Google Sheets?

  1. To start using ChartExpo, download it directly from the Google Sheets program. To do this, select Extensions from the top toolbar.
  2. A menu will appear. Click the Get add-ons option.
  3. Search for ChartExpo, and click on Charts, Graphs & Visualizations by ChartExpo when it appears in the results.
  4. Click the Install button. You will have to confirm your Google account and accept some permissions.

ChartExpo charts are available both in Google Sheets and Microsoft Excel. Please use the following CTAs to install the tool of your choice and create beautiful visualizations in a few clicks in your favorite tool.

Example

Let’s visualize and analyze this sample data in Google Sheets using ChartExpo.

Level 1 Level 2 Level 3 Level 4 Level 5 Amount
US & Canada Revenue 3930557000
Europe, M. East, Africa Revenue 2783530000
Latin America Revenue 1156023000
Asia-Pacific Revenue 962715000
Revenue Gross profit 3525340000
Revenue Cost of revenue -5307485000
Gross profit Operating profit 1496109000
Operating profit Net profit 937838000
Operating profit Interest expense -175212000
Operating profit Tax -210312000
Operating profit Other expense -172747000
Gross profit Operating cost Marketing -916617000
Gross profit Operating cost Tech & Dev -673341000
Gross profit Operating cost G & A -439273000
  • To get started with ChartExpo, install ChartExpo in Google Sheets.
  • Go to Extensions > Charts, Graphs & Visualizations by ChartExpo > Open.
Business Expenses Spreadsheet
  • To access the charts library, click the Add new chart button.
Business Expenses Spreadsheet
  • Once ChartExpo is loaded. Click on “Sankey Chart”.
Business Expenses Spreadsheet
  • First, insert the data table into the sheet. Then, choose the Sheet name from the drop-down menu in the ChartExpo section.
  • Select the metric column; metric is the numeric column in your data sheet.
  • Select the dimensions column; the dimension is the categorical column in your datasheet that contains text information.
Business Expenses Spreadsheet
  • Click the Create chart button to complete the process.
Business Expenses Spreadsheet
  • Click on Settings and enable the “Enable Negative Data” option as follows:
Business Expenses Spreadsheet
  • ChartExpo will generate the visualization below for you.
Business Expenses Spreadsheet
  • If you want to have the chart’s title, click Edit Chart, as shown in the above image.
  • Click the pencil icon next to the Chart Header to change the title.
  • It will open the properties dialog. Under the Text section, you can add a heading in Line 1 and enable Show.
  • Give the appropriate title of your chart and click the Apply button.
Business Expenses Spreadsheet
  • You can disable the “Show Node Outline” and change the width of Nodes to 15:
Business Expenses Spreadsheet
  • You can disable the percentage value:
Business Expenses Spreadsheet
  • Change the format into Currency and enable the show upper case as follows:
Business Expenses Spreadsheet
  • You can disable the chart footer labels as follows:
Business Expenses Spreadsheet
  • Change the colors of the center Nodes:
Business Expenses Spreadsheet
  • Change all the legend shapes into circles and click the “Save” button:
Business Expenses Spreadsheet
  • Your final chart will appear as below.
Business Expenses Spreadsheet

Insights

  • Regional revenue: US & Canada lead with $3.93B
  • Gross profit: $3.53B
  • Cost of revenue: $5.31B
  • Operating expenses (marketing, tech, G&A) heavily affect profitability
  • Operating profit: $1.5B
  • Net profit after taxes and interest: $937.8M

Limitations of a Business Expenditure Spreadsheet

A spreadsheet for business expenses is a powerful tool, but it’s not without its limits. Knowing these shortcomings helps you avoid surprises and plan better:

  • Manual data entry: Typing in every expense takes time and can lead to mistakes. This slows down your small business expense report and affects accuracy.
  • Lack of real-time integration: Spreadsheets don’t automatically sync with your bank or accounting software. That means your data might be outdated, making profit and loss statements for a small business less reliable.
  • Limited collaboration: Sharing spreadsheets can get messy, with multiple users editing simultaneously. It’s hard to keep track of changes and avoid conflicts.
  • Scalability challenges: Your spreadsheet can become cluttered and slow as your business grows. Managing large data sets becomes difficult without specialized tools.
  • Security risks: Spreadsheets often lack advanced security features. Sensitive information can be exposed if files aren’t protected properly.
  • Limited reporting and automation: Generating reports takes extra work since most spreadsheets don’t automate this. You miss out on deeper insights that come from automated systems.

FAQs

How to track business expenses in Google Sheets?

  • List expenses by date and category.
  • Enter amounts for each transaction.
  • Use formulas to calculate totals automatically.
  • Update the sheet regularly for accuracy.
  • Add charts to visualize spending trends.

Can Google Sheets be used for business?

Yes, Google Sheets can be used for business. It helps organize data, track finances, and collaborate with teams. It’s free and accessible anywhere – perfect for small businesses needing flexible tools without extra cost.

Wrap Up

A business expenses spreadsheet helps track where your money goes. It keeps every cost visible. No surprises. No guesswork.

Understanding COGS vs. operating expenses is key. COGS are tied to what you sell while operating expenses keep the business running. A good spreadsheet separates both.

Business overhead costs can easily grow unnoticed. Rent, utilities, and admin costs add up. Tracking them helps you cut waste and boost profit.

A spreadsheet also helps with a small business’s profit and loss statement. It clearly shows income, costs, and profit, making reporting easier and decisions smarter.

Spreadsheets make budgeting more accurate. They reveal spending patterns. You plan better when you know where your money goes.

Every small business needs control, and a business expenses spreadsheet provides it. Start small, stay consistent, and watch your business grow.

How much did you enjoy this article?

GSAd2
Start Free Trial!
154398

Related articles

next previous
Google Sheets8 min read

Debt Tracker in Google Sheets: A Complete Guide

A debt tracker Google Sheet helps you manage and monitor debt easily. Learn how to build, customize, and analyze it for smarter financial decisions.

Google Sheets8 min read

Assignment Tracker Google Sheet Template: Quick Insights

An assignment tracker Google Sheet template helps track tasks and deadlines. Click here to learn how to create one, who can use it, and see real examples.

Google Sheets7 min read

Goal Tracking Spreadsheet: A Complete Walkthrough

A goal-tracking spreadsheet helps you set and track goals. Click here to learn how to build one, use it in Google Sheets, and boost your progress.

Google Sheets11 min read

How to Save a Google Sheet: A Complete Walkthrough

Discover how to save Google Sheets with autosave, copies, and downloads. You’ll learn quick steps and tips to protect and manage your data easily.

Google Sheets13 min read

Balance Sheet Template in Google Sheets for Visual Insights

A balance sheet template in Google Sheets helps track assets, liabilities, and equity. Click here to learn how to easily create, analyze, and visualize your financial data.

ChartExpo logo

Turn Data into Visual
Stories

CHARTEXPO

  • Home
  • Gallery
  • Videos
  • Services
  • Pricing
  • Contact us
  • FAQs
  • Privacy policy
  • Terms of Service
  • Sitemap

TOOLS

  • ChartExpo for Google Sheets
  • ChartExpo for Microsoft Excel
  • Power BI Custom Visuals by ChartExpo
  • Word Cloud

CATEGORIES

  • Bar Charts
  • Circle Graphs
  • Column Charts
  • Combo Charts
  • Comparison Charts
  • Line Graphs
  • PPC Charts
  • Sentiment Analysis Charts
  • Survey Charts

TOP CHARTS

  • Sankey Diagram
  • Likert Scale Chart
  • Comparison Bar Chart
  • Pareto Chart
  • Funnel Chart
  • Gauge Chart
  • Radar Chart
  • Radial Bar Chart
  • Sunburst Chart
  • see more
  • Scatter Plot Chart
  • CSAT Survey Bar Chart
  • CSAT Survey Chart
  • Dot Plot Chart
  • Double Bar Graph
  • Matrix Chart
  • Multi Axis Line Chart
  • Overlapping Bar Chart
  • Control Chart
  • Slope Chart
  • Clustered Bar Chart
  • Clustered Column Chart
  • Box and Whisker Plot
  • Tornado Chart
  • Waterfall Chart
  • Word Cloud
  • see less

RESOURCES

  • Blog
  • Resources
  • YouTube
SIGN UP FOR UPDATES

We wouldn't dream of spamming you or selling your info.

© 2025 ChartExpo, all rights reserved.