Categories
Whoever said numbers can’t speak never ran a small business. Numbers, my friends, aren’t just digits on a spreadsheet; they’re the royal court guiding your business to prosperity. Without them, you’re in the dark with a blindfold on, walking backward down an alley.


You need a tool like the Profit and Loss statement to make sense of these numbers.
Sounds intimidating, right?
Not quite.
The Profit and Loss statement isn’t a fire-breathing dragon. It’s a friendly beast, ready to guide you through the financial labyrinth.
Is it vital?
Well, without oxygen, we can’t breathe. Similarly, your small business can’t breathe without a Profit and Loss statement. It’s the financial oxygen keeping your entrepreneurial dreams alive.
Moreover, the Profit and Loss statement is a fortune-teller. It predicts your business’s future with the accuracy of a crystal ball. Small business owners, investors, and lenders rely on this financial lifeline to assess performance. From this, one can make informed choices and plan for the future.
So, let’s tame this beast together, shall we?
Definition: A Profit and Loss (P&L) statement for a small business is a financial report that shows the company’s revenues, costs, and expenses over a set period, such as a month, quarter, or year.
It reveals whether the business made a profit or a loss and provides insights into financial health, cost management, and growth opportunities. For small businesses, the P&L is a key tool for tracking performance, identifying trends, and making informed decisions.
A Profit and Loss (P&L) statement is essential for small businesses because it shows whether the company is making money or losing it over a given period. It helps owners:
Small businesses can prepare Profit and Loss (P&L) statements in different formats depending on their needs. The two main types are:
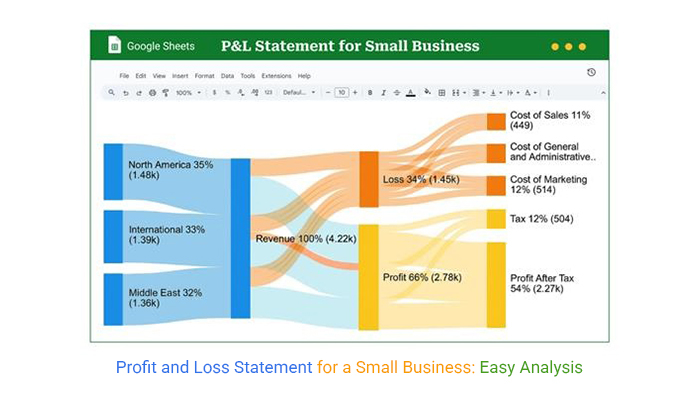
Let’s look at a small bakery’s P&L for Small Business for one month:
Welcome to the world of data, where numbers dance, insights pop, and graphs tell tales. Data visualization is the life of this party, turning the complex into comprehensible. It’s the magic wand of data analysis.
But, alas, Google Sheets sometimes feels like it’s left its visualization dancing shoes at home.
Fear not, though! ChartExpo, with its dynamic data visualization powers and tools like the Sankey Diagram maker, steps up to the plate where Google Sheets falls short. As a result, data visualization and analysis become a breeze.
Benefits of Using ChartExpo
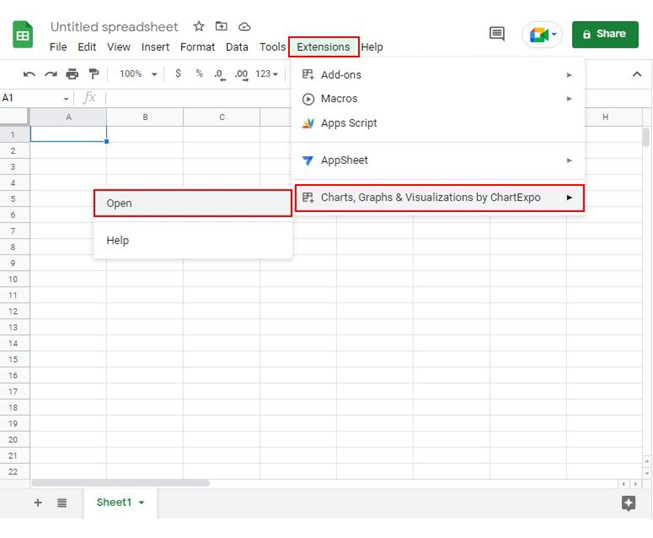
How to Install ChartExpo in Google Sheets?
ChartExpo charts and graphs are available both in Google Sheets and Microsoft Excel. Please use the following CTA’s to install the tool of your choice and create beautiful visualizations in a few clicks in your favorite tool.
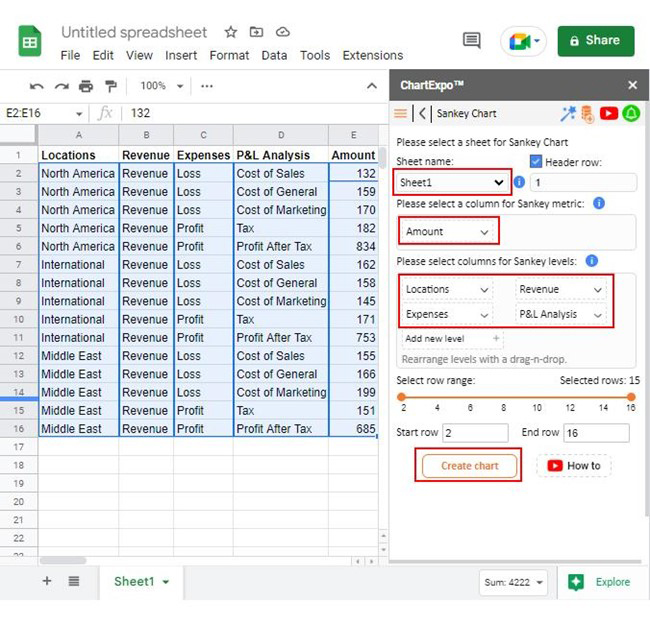
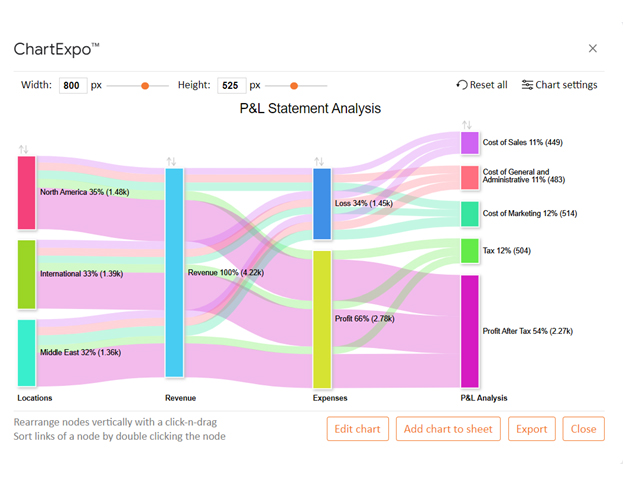
The sample data below is for a Profit and Loss statement for a small business.
| Locations | Revenue | Expenses | P&L Analysis | Amount |
| North America | Revenue | Loss | Cost of Sales | 132 |
| North America | Revenue | Loss | Cost of General and Administrative | 159 |
| North America | Revenue | Loss | Cost of Marketing | 170 |
| North America | Revenue | Profit | Tax | 182 |
| North America | Revenue | Profit | Profit After Tax | 834 |
| International | Revenue | Loss | Cost of Sales | 162 |
| International | Revenue | Loss | Cost of General and Administrative | 158 |
| International | Revenue | Loss | Cost of Marketing | 145 |
| International | Revenue | Profit | Tax | 171 |
| International | Revenue | Profit | Profit After Tax | 753 |
| Middle East | Revenue | Loss | Cost of Sales | 155 |
| Middle East | Revenue | Loss | Cost of General and Administrative | 166 |
| Middle East | Revenue | Loss | Cost of Marketing | 199 |
| Middle East | Revenue | Profit | Tax | 151 |
| Middle East | Revenue | Profit | Profit After Tax | 685 |
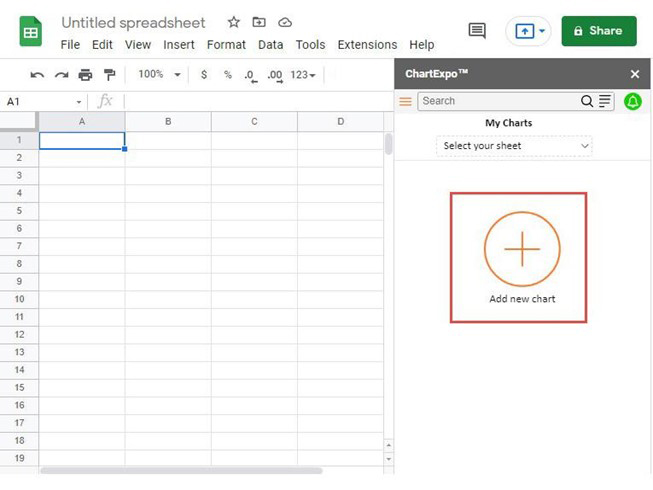
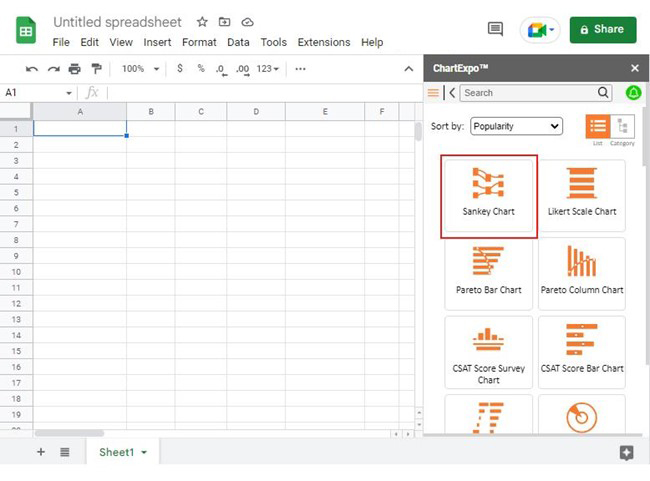
Follow the steps below to learn how to create a visualization for this data using ChartExpo.
The basics of profit and loss revolve around tracking how much money your business earns (revenue) and how much it spends (expenses).
A Profit and Loss (P&L) statement summarizes these numbers over a set period (monthly, quarterly, or yearly) to show whether the business made a net profit (income is greater than expenses) or a net loss (expenses are greater than income).
You can calculate profit and loss with a simple formula:
Yes, the P&L (Profit and Loss) statement is the same as an income statement. Both terms are interchangeable and represent a financial document summarizing a company’s revenues, costs, expenses, and profitability.
The Profit and Loss Statement for a small business is the financial lifeblood that keeps businesses thriving and steering clear of perilous waters.
This financial report, with its meticulous calculations, reflects the true health of a business. It succinctly portrays whether the venture is thriving, barely keeping its head above water, or sinking into losses.
Small business owners often juggle numerous responsibilities, from managing operations to nurturing customer relationships. The P&L statement, in all its numerical glory, condenses this complexity into a clear-cut financial snapshot. It provides insight into revenue sources, expense patterns, and the bottom line.
Beyond a mere financial report, it becomes the North Star for sound decision-making. It guides entrepreneurs in charting a course toward growth and prosperity. This is achieved by highlighting the strengths and weaknesses of their financial strategies.
With its insight, the Profit and Loss Statement for a small business is not just a tool; it’s a trusted ally. It helps set realistic goals, streamline operations, attract investors, and navigate the labyrinth of taxes and regulations.
Get started with the Profit and Loss statement today with ChartExpo and propel your business to success.
How much did you enjoy this article?


Calculate accounts receivable turnover ratio to measure credit collection speed, improve cash flow, and strengthen your financial strategy. Read on!

Change Management KPIs are the key to tracking adoption, performance, and ROI during transitions. Find out which metrics matter. Read on!

Data collection methods and techniques determine the quality of every insight you act on. Explore key approaches for gathering reliable data. Read on!


