Categories
Understanding the difference between Return on Assets vs. Return on Equity is vital for making informed investment choices. It helps you comprehend the distinct aspects of a company’s performance.


Picture this: You’re at a bustling stock market, trying to make sense of numbers and financial jargon. As you evaluate the investment opportunities, two key metrics stand out: Return on Assets (ROA) vs. Return on Equity (ROE).
These metrics are key to understanding how efficiently a company uses its resources. They also tell you how well it’s generating profits for its shareholders.
But what does return on assets vs. return on equity mean, and how do they differ?
Return on Assets vs. Return on Equity are vital indicators of a company’s performance and financial health. Understanding the disparities between these metrics is crucial for investors, financial analysts, and business professionals. ROA assesses a company’s proficiency in deriving profits from its asset base. On the other hand, ROE focuses on how effectively it’s utilizing shareholder equity to generate profits.
Continue reading to understand the difference between Return on Assets vs. Return on Equity. We’ll also dissect their definitions, formulas, and real-world implications.
By the end of this exploration, you’ll have a solid grasp of the disparities between ROA vs. ROE. Then, you can wield these invaluable metrics as discerning tools in financial analysis.
Definition: Return on Assets (ROA) is a financial metric that measures a company’s efficiency in generating profit from its assets. Such assets include:
ROI is calculated by dividing the company’s net income by its average total assets.
Here is the formula;
ROA =(Annual Net Income)/(Total Assets)
A higher ROA indicates better asset utilization and profitability. It is expressed as a percentage, with higher percentages reflecting more effective asset management.
Investors use ROA to assess a company’s operational efficiency and compare its performance with industry peers. However, it’s crucial to interpret ROA with industry benchmarks and other financial metrics. This provides a comprehensive evaluation of a company’s financial performance.
Definition: Return on Equity (ROE) is a financial metric that assesses a company’s profitability of its shareholders’ equity. It provides insight into how well a company generates returns for its shareholders’ investment. ROE is calculated by dividing the company’s net income by its average shareholders’ equity.
Here is the formula;
ROE =(Annual Net Income)/(Average Shareholder Equity)
A higher ROE is generally indicative of effective financial management and strong performance. ROE is expressed as a percentage, with higher percentages reflecting better shareholder value creation.
Investors use ROE to evaluate a company’s ability to generate profits from its equity base. However, while a high ROE is desirable, it’s essential to consider industry benchmarks, financial leverage, and other factors. This provides a comprehensive assessment of a company’s financial performance and sustainability.
Return on Assets (ROA) vs. Return on Equity (ROE) offer distinct perspectives on a company’s financial health. Let’s explore their differences to understand their unique roles in evaluating a company’s performance.
ROA: Return on Assets gauges a company’s ability to generate profit from its total assets. It measures operational efficiency.
ROE: Return on Equity assesses a company’s profitability relative to its shareholders’ equity, emphasizing the returns generated for shareholders.
ROA: Primarily focuses on asset utilization and how efficiently a company converts its assets into profit.
ROE: Concentrates on shareholder equity, emphasizing how effectively a company generates shareholder returns.
ROA: Calculated by dividing net income by average total assets. It reflects the efficiency of asset deployment.
ROE: Calculated by dividing net income by average shareholders’ equity. It emphasizes the relationship between profitability and equity.
ROA: Provides insights into the efficiency of utilizing assets for profit generation.
ROE: Reflects the profitability of the company and its ability to create value for shareholders.
ROA: Essential for comparing a company’s asset efficiency with industry benchmarks, revealing its operational standing.
ROE: Crucial for evaluating a company’s effectiveness in generating shareholder returns compared to industry peers.
ROA: Demonstrates operational efficiency, indicating how well a company uses its assets to generate profit.
ROE: Illustrates how effectively a company employs shareholder funds to generate profits, reflecting overall financial health.
ROA = (Annual Net Income)/(Total Assets) — 100
This formula calculates the percentage of profit generated for every dollar of assets employed.
ROE = (Annual Net Income)/(Average Shareholder Equity) — 100
This formula assesses the company’s profitability relative to the equity provided by shareholders.
Data analysis is an intricate puzzle, demanding patience and skill to decode the insights hidden within the numbers. In this labyrinth of data, data visualization emerges as a guiding light, illuminating the path to comprehension.
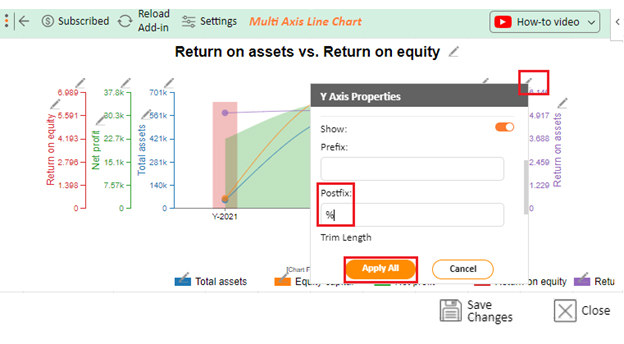
Visualizing ROA vs. ROE is crucial for comprehensively understanding a company’s financial performance, especially when you want to calculate return on investment capital. However, while Excel is a stalwart for data management, its capacity for advanced data visualization is limited. This is where ChartExpo steps in to bridge the gap by offering enhanced visualization capabilities.
So, how can you examine Return on Assets vs. Return on Equity using ChartExpo?
Let’s embark on this enlightening journey of financial analysis together.
But first”¦
Let’s learn how to Install ChartExpo in Excel.
ChartExpo charts are available both in Google Sheets and Microsoft Excel. Please use the following CTA’s to install the tool of your choice and create beautiful visualizations in a few clicks in your favorite tool.
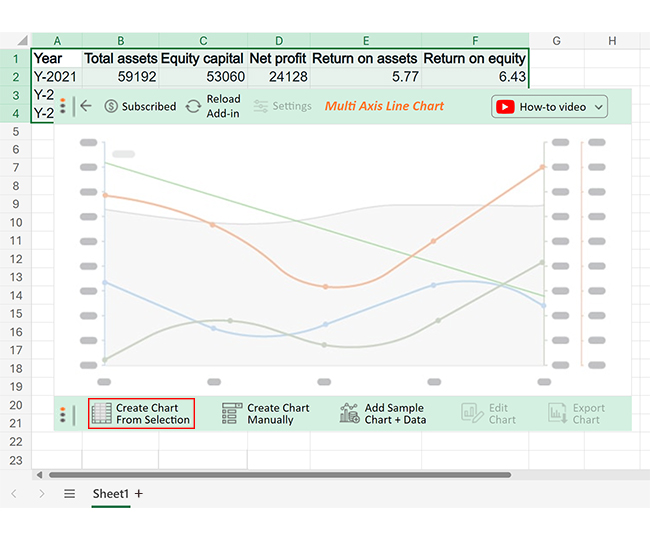
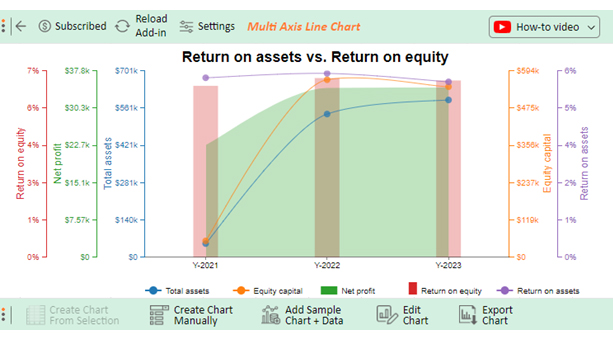
The table below contains sample financial data for a company over three years.
| Year | Total assets | Equity capital | Net profit | Return on assets | Return on equity |
| Y-2021 | 59192 | 53060 | 24128 | 5.77 | 6.43 |
| Y-2022 | 614022 | 570748 | 36290 | 5.91 | 6.72 |
| Y-2023 | 674353 | 548400 | 36371 | 5.64 | 6.63 |
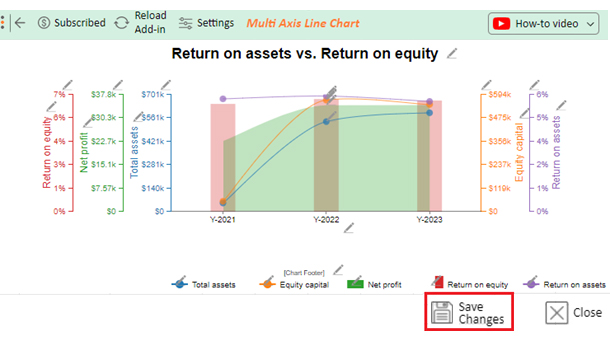
Let’s visualize this Return on Assets vs. Return on Equity data using ChartExpo and glean valuable insights.


No, return on assets (ROA) and return on equity (ROE) differ. Each metric provides distinct insights into a company’s financial performance. ROA assesses profitability relative to total assets, while ROE evaluates profitability about shareholders’ equity.
If ROA is higher than ROE, it suggests that a company is generating more profit from its assets. Moreover, it indicates that the company relies less on equity to achieve profitability.
No, ROA and ROE serve different purposes. ROA measures operational efficiency in utilizing assets, while ROE assesses the profitability of shareholder equity. The choice depends on the aspect of performance a stakeholder wants to evaluate.
The difference between Return on Assets vs. Return on Equity illuminates the multifaceted nature of financial performance evaluation. ROA, focusing on asset efficiency, gauges how adeptly a company converts its assets into profit. Consequently, it provides insights into operational effectiveness. Conversely, ROE emphasizes shareholder value creation, evaluating how well a company generates returns for its equity base.
The calculation processes reveal the uniqueness of each metric. ROA requires determining net income and average total assets, showcasing how efficiently a company utilizes its asset base. In contrast, ROE involves net income and shareholders’ equity, highlighting the profitability generated for shareholders.
The nuanced insights provided by these metrics empower you to make well-informed decisions. A higher ROA emphasizes efficient asset deployment, demonstrating the company’s prowess in converting investments into earnings. Meanwhile, a superior ROE demonstrates the ability to generate substantial returns for shareholders relative to their equity investment.
Juxtaposing ROA and ROE enables you to gain a comprehensive perspective, catering to diverse analytical needs. It offers a holistic evaluation, capturing the intricacies of both operational efficiency and equity management.
In essence, Return on Assets vs. Return on Equity is an indispensable tool in the financial analyst’s toolkit. Their nuanced perspectives complement each other, offering a comprehensive view of a company’s performance.
Do not hesitate.
Embrace Return on Assets vs. Return on Equity with ChartExpo and make informed investment decisions.
How much did you enjoy this article?


Calculate accounts receivable turnover ratio to measure credit collection speed, improve cash flow, and strengthen your financial strategy. Read on!

Change Management KPIs are the key to tracking adoption, performance, and ROI during transitions. Find out which metrics matter. Read on!

Data collection methods and techniques determine the quality of every insight you act on. Explore key approaches for gathering reliable data. Read on!


